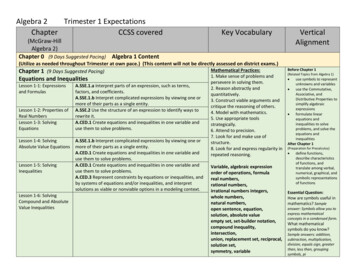
Transcription
Algebra 2Trimester 1 ExpectationsChapterCCSS coveredKey VocabularyVerticalAlignment(McGraw-HillAlgebra 2)Chapter 0 (9 Days Suggested Pacing) Algebra 1 Content(Utilize as needed throughout Trimester at own pace.) (This content will not be directly assessed on district exams.)Mathematical Practices:Chapter 1 (9 Days Suggested Pacing)Before Chapter 1Equations and Inequalities Lesson 1-1: Expressionsand FormulasLesson 1-2: Properties ofReal NumbersLesson 1-3: SolvingEquationsLesson 1-4: SolvingAbsolute Value EquationsLesson 1-5: SolvingInequalitiesLesson 1-6: SolvingCompound and AbsoluteValue InequalitiesA.SSE.1.a Interpret parts of an expression, such as terms,factors, and coefficients.A.SSE.1.b Interpret complicated expressions by viewing one ormore of their parts as a single entity.A.SSE.2 Use the structure of an expression to identify ways torewrite it.A.CED.1 Create equations and inequalities in one variable anduse them to solve problems.A.SSE.1.b Interpret complicated expressions by viewing one ormore of their parts as a single entity.A.CED.1 Create equations and inequalities in one variable anduse them to solve problems.A.CED.1 Create equations and inequalities in one variable anduse them to solve problems.A.CED.3 Represent constraints by equations or inequalities, andby systems of equations and/or inequalities, and interpretsolutions as viable or nonviable options in a modeling context.1. Make sense of problems andpersevere in solving them.2. Reason abstractly andquantitatively.3. Construct viable arguments andcritique the reasoning of others.4. Model with mathematics.5. Use appropriate toolsstrategically.6. Attend to precision.7. Look for and make use ofstructure.8. Look for and express regularity inrepeated reasoning.Variable, algebraic expressionorder of operations, formulareal numbers,rational numbers,irrational numbers integers,whole numbers,natural numbers,open sentence, equation,solution, absolute valueempty set, set-builder notation,compound inequality,intersection,union, replacement set, reciprocal,solution set,symmetry, variable(Related Topics from Algebra 1)use symbols to representunknowns and variables use the Commutative,Associative, andDistributive Properties tosimplify algebraicexpressions formulate linearequations andinequalities to solveproblems, and solve theequations andinequalitiesAfter Chapter 1(Preparation for Precalculus) define functions,describe characteristicsof functions, andtranslate among verbal,numerical, graphical, andsymbolic representationsof functionsEssential Question:How are symbols useful inmathematics? Sampleanswer: Symbols allow you toexpress mathematicalconcepts in a condensed form.What mathematicalsymbols do you know?Sample answers: addition,subtraction, multiplication,division, equals sign, greaterthan, less than, groupingsymbols, pi
Chapter 2 (13 Days Suggested Pacing)Linear Relations and FunctionsLesson 2-1: Relations andFunctionsLesson 2-2: LinearRelations and FunctionsLesson 2-3: Rate ofChange and SlopeLesson 2-4: WritingLinear EquationsLesson 2-5: Scatter Plotsand Lines of RegressionLesson 2-6: SpecialFunctionsF.IF.4 For a function that models a relationship between twoquantities, interpret key features of graphs and tables in termsof the quantities, and sketch graphs showing key features givena verbal description of the relationship.F.IF.5 Relate the domain of a function to its graph and, whereapplicable, to the quantitative relationship it describes.F.IF.4 For a function that models a relationship between twoquantities, interpret key features of graphs and tables in termsof the quantities, and sketch graphs showing key features givena verbal description of the relationship.F.IF.9 Compare properties of two functions each representedin a different way (algebraically, graphically, numerically intables, or by verbal descriptions).F.IF.4 For a function that models a relationship between twoquantities, interpret key features of graphs and tables in termsof the quantities, and sketch graphs showing key features givena verbal description of the relationship.F.IF.6 Calculate and interpret the average rate of change of afunction (presented symbolically or as a table) over a specifiedinterval. Estimate the rate of change from a graph.A.SSE.1.b Interpret complicated expressions by viewing one ormore of their parts as a single entity.A.CED.2 Create equations in two or more variables to representrelationships between quantities; graph equations on coordinateaxes with labels and scales.F.IF.4 For a function that models a relationship between twoquantities, interpret key features of graphs and tables in termsof the quantities, and sketch graphs showing key features givena verbal description of the relationship.F.IF.4 For a function that models a relationship between twoquantities, interpret key features of graphs and tables in termsof the quantities, and sketch graphs showing key features givena verbal description of the relationship.F.IF.7.b Graph square root, cube root, and piecewise-definedfunctions, including step functions and absolute value functions.Before Chapter 2(Related Topics from Algebra 1)Mathematical Practices:1. Make sense of problems andpersevere in solving them.2. Reason abstractly andquantitatively.3. Construct viable arguments andcritique the reasoning of others.4. Model with mathematics.5. Use appropriate toolsstrategically.6. Attend to precision.7. Look for and make use ofstructure.8. Look for and express regularity inrepeated reasoning.one-to-one functiononto functiondiscrete relationcontinuous relationvertical line testindependent variable dependentvariablelinear equationlinear functionrate of changebivariate datapositive correlationnegative correlationline of fitregression linepiecewise-linear functionabsolute value functionparent functionquadratic functionlinear inequality identify domains andranges for givensituations determine intercepts ofthe graphs of linearfunctions determine slopes fromgraphs, tables, andalgebraicrepresentations graph and writeequations of lines use data to determinefunctional relationshipsbetween quantities formulate linearinequalities to solveproblems and investigatemethods for solvingthemAfter Chapter 2(Preparation for Precalculus) describe parentfunctions symbolicallyand graphically,including f(x) x determine the domainand range of functionsusing graphs, tables, andsymbolsuse regression todetermine theappropriateness of alinear function to modelreal-life dataEssential Question:How can mathematicalideas be represented?You can representmathematical ideas verbally,
Lesson 2-7: ParentFunctions andTransformationsLesson 2-8: GraphingLinear and AbsoluteValue InequalitiesF.IF.4 For a function that models a relationship between twoquantities, interpret key features of graphs and tables in termsof the quantities, and sketch graphs showing key features givena verbal description of the relationship.F.BF.3 Identify the effect on the graph of replacing f(x) by f(x) k, k f(x), f(kx), and f(x k) for specific values of k (both positiveand negative); find the value of k given the graphs. Experimentwith cases and illustrate an explanation of the effects on thegraph using technology.A.CED.3 Represent constraints by equations or inequalities, andby systems of equations and/or inequalities, and interpretsolutions as viable or nonviable options in a modeling context.algebraically, numerically andgraphically. For example, anequation can be described inwords or could berepresented by a table ofvalues or a graph
Chapter 3 (15 Days Suggested Pacing)Systems of Equations and InequalitiesLesson 3-1: SolvingSystems of EquationsLesson 3-2: SolvingSystems of Inequalitiesby GraphingLesson 3-3: Optimizationwith Linear ProgrammingLesson 3-4: Systems ofEquations in ThreeVariablesLesson 3-5: Operationswith MatricesLesson 3-6: MultiplyingMatricesLesson 3-7: SolvingSystems of EquationsUsing Cramer's RuleLesson 3-8: SolvingSystems of EquationsUsing Inverse MatricesA.CED.3 Represent constraints by equations or inequalities, andby systems of equations and/or inequalities, and interpretsolutions as viable or nonviable options in a modeling context.A.CED.3 Represent constraints by equations or inequalities, andby systems of equations and/or inequalities, and interpretsolutions as viable or nonviable options in a modeling context.A.CED.3 Represent constraints by equations or inequalities, andby systems of equations and/or inequalities, and interpretsolutions as viable or nonviable options in a modeling context.A.CED.3 Represent constraints by equations or inequalities, andby systems of equations and/or inequalities, and interpretsolutions as viable or nonviable options in a modeling context.A.CED.3 Represent constraints by equations or inequalities, andby systems of equations and/or inequalities, and interpretsolutions as viable or nonviable options in a modeling context.A.CED.3 Represent constraints by equations or inequalities, andby systems of equations and/or inequalities, and interpretsolutions as viable or nonviable options in a modeling context.A.CED.3 Represent constraints by equations or inequalities, andby systems of equations and/or inequalities, and interpretsolutions as viable or nonviable options in a modeling context.Mathematical Practices:1. Make sense of problems andpersevere in solving them.2. Reason abstractly andquantitatively.3. Construct viable arguments andcritique the reasoning of others.4. Model with mathematics.5. Use appropriate toolsstrategically.6. Attend to precision.7. Look for and make use ofstructure.8. Look for and express regularity inrepeated reasoning.Before Chapter 3break-even stitution methodelimination methodfeasible rminantCramer’s Rulecoefficient matrixidentity matrixsquare matrixinverse matrixvariable matrixconstant matrixEssential Question:How can you find thesolution to a mathproblem? Sample answers:Use a graph; analyze atable of values; solve anequation; guess and check.(Related Topics from Algebra 1) graph equations of linestransform and solveequationsAfter Chapter 3(Preparation for Precalculus) define functions,describe characteristicsof functions, andtranslate among verbal,numerical, graphical, andsymbolic representationsof functionsuse functions and theirproperties to model andsolve real-life problems
ChapterCCSS coveredKey VocabularyVertical Alignment(McGraw-Hill Algebra 2)Chapter 4 (14 Days Suggested Pacing)Quadratic Functions and RelationsLesson 4-1: GraphingQuadratic FunctionsLesson 4-2: SolvingQuadratic Equations byGraphingLesson 4-3: SolvingQuadratic Equations byFactoringLesson 4-4: ComplexNumbersLesson 4-5: Completingthe SquareLesson 4-6: The QuadraticFormula and theDiscriminantLesson 4-7:Transformations ofQuadratic GraphsLesson 4-8: QuadraticInequalitiesA.SSE.1.a Interpret parts of an expression, such as terms, factors, andcoefficients.F.IF.9 Compare properties of two functions each represented in adifferent way (algebraically, graphically, numerically in tables, or byverbal descriptions).A.CED.2 Create equations in two or more variables to representrelationships between quantities; graph equations on coordinate axeswith labels and scales.F.IF.4 For a function that models a relationship between twoquantities, interpret key features of graphs and tables in terms of thequantities, and sketch graphs showing key features given a verbaldescription of the relationship.A.SSE.2 Use the structure of an expression to identify ways to rewriteit.F.IF.8.a Use the process of factoring and completing the square in aquadratic function to show zeros, extreme values, and symmetry of thegraph, and interpret these in terms of a context.N.CN.1 Know there is a complex number i such that i2 –1, and everycomplex number has the form a bi with a and b real.N.CN.2 Use the relation i2 –1 and the commutative, associative, anddistributive properties to add, subtract, and multiply complex numbers.N.CN.7 Solve quadratic equations with real coefficients that havecomplex solutions.F.IF.8.a Use the process of factoring and completing the square in aquadratic function to show zeros, extreme values, and symmetry of thegraph, and interpret these in terms of a context.N.CN.7 Solve quadratic equations with real coefficients that havecomplex solutions.A.SSE.1.b Interpret complicated expressions by viewing one or more oftheir parts as a single entity.A.CED.1 Create equations and inequalities in one variable and usethem to solve problems.A.CED.3 Represent constraints by equations or inequalities, and bysystems of equations and/or inequalities, and interpret solutions asviable or nonviable options in a modeling context.Mathematical Practices:1. Make sense of problems andpersevere in solving them.2. Reason abstractly andquantitatively.3. Construct viable arguments andcritique the reasoning of others.4. Model with mathematics.5. Use appropriate toolsstrategically.6. Attend to precision.7. Look for and make use ofstructure.8. Look for and express regularity inrepeated reasoning.quadratic termlinear term, constant termvertex, maximum valueminimum valuequadratic equationstandard formroot, zero, imaginary unitpure imaginary numbercomplex numbercomplex conjugatescompleting the squareQuadratic Formuladiscriminant, vertex formquadratic inequalityBefore Chapter 4(Related Topics From Algebra 1) approximate the value ofirrational numbersanalyze graphs ofquadratic functions anddraw conclusionssolve linear inequalitiesusing graphs(Previous Topics from Algebra 2) use tools includingfactoring to transformand solve equationsAfter Chapter 4(Preparation for Precalculus) determine the domainand range of functionsusing graphs, tables, andsymbols recognize and useconnections amongsignificant values of afunction, points on thegraph of a function, andthe symbolicrepresentation of afunction apply basictransformations to theparent functionsEssential Question:Why do we use differentmethods to solve mathproblems?
Number and QuantityThe Complex Number System N-CNPerform arithmetic operations with complex numbers.1. Know there is a complex number i such that i2 1, and every complex number has the form a biwith a and b real.2. Use the relation i2 1 and the commutative, associative, and distributive properties to add, subtract, and multiply complexnumbers.Use complex numbers in polynomial identities and equations.7. Solve quadratic equations with real coefficients that have complex solutions.8. ( ) Extend polynomial identities to the complex numbers.9. ( ) Know the Fundamental Theorem of Algebra; show that it is true or quadratic polynomials.AlgebraSeeing Structure in Expressions A-SSEInterpret the structure of expressions.1. Interpret expressions that represent a quantity in terms of its context. a. Interpret parts of an expression, such as terms, factors, and coefficients.b. Interpret complicated expressions by viewing one or more of their parts as a single entity.2. Use the structure of an expression to identify ways to rewrite it.Write expressions in equivalent forms to solve problems.4. Derive the formula for the sum of a finite geometric series (when the common ratio is not 1), and use the formula to solveproblems. Arithmetic with Polynomials and Rational Expressions A-APRPerform arithmetic operations on polynomials.1. Understand that polynomials form a system analogous to the integers, namely, they are closed under the operations ofaddition, subtraction, and multiplication; add, subtract, and multiply polynomials.Understand the relationship between zeros and factors of polynomials.2. Know and apply the Remainder Theorem: For a polynomial p(x) and a number a, the remainder on division by x a is p(a),so p(a) 0 if and only if (x a) is a factor of p(x).
3. Identify zeros of polynomials when suitable factorizations are available, and use the zeros to construct a rough graph of thefunction defined by the polynomial.Use polynomial identities to solve problems.4. Prove polynomial identities and use them to describe numerical relationships.5. ( ) Know and apply the Binomial Theorem for the expansion of (x y)n in powers of x and y for a positive integer n,where x and y are any numbers, with coefficients determined for example by Pascal's Triangle.Rewrite rational expressions.6.Rewrite simple rational expressions in different forms; writein the form, where a(x), b(x), q(x), and r(x) arepolynomials with the degree of r(x) less than the degree of b(x), using inspection, long division, or, for the more complicatedexamples, a computer algebra system.7. ( ) Understand that rational expressions form a system analogous to the rational numbers, closed under addition, subtraction,multiplication, and division by a nonzero rational expression; add, subtract, multiply, and divide rational expressions.Creating Equations A-CEDCreate equations that describe numbers or relationships.1. Create equations and inequalities in one variable and use them to solve problems.2. Create equations in two or more variables to represent relationships between quantities; graph equations on coordinate axeswith labels and scales.3. Represent constraints by equations or inequalities, and by systems of equations and/or inequalities, and interpret solutions asviable or non-viable options in a modeling context.4. Rearrange formulas to highlight a quantity of interest, using the same reasoning as in solving equations.Reasoning with Equations and Inequalities A-REIUnderstand solving equations as a process of reasoning and explain the reasoning.2. Solve simple rational and radical equations in one variable, and give examples showing how extraneous solutions may arise.Represent and solve equations and inequalities graphically.11. Explain why the x-coordinates of the points where the graphs of the equations y f(x) and y g(x) intersect are the solutionsof the equation f(x) g(x); find the solutions approximately, e.g., using technology to graph the functions, make tables ofvalues, or find successive approximations. Include cases where f(x) and/or g (x ) are linear, polynomial, rational, absolutevalue, exponential, and logarithmic functions. FunctionsInterpreting Functions F-IFInterpret functions that arise in applications in terms of the context.
4. For a function that models a relationship between two quantities, interpret key features of graphs and tables in terms of thequantities, and sketch graphs showing key features given a verbal description of the relationship. 5. Relate the domain of a function to its graph and, where applicable, to the quantitative relationship it describes.6. Calculate and interpret the average rate of change of a function (presented symbolically or as a table) over a specifiedinterval. Estimate the rate of change from a graph. Analyze functions using different representations.7. Graph functions expressed symbolically and show key features of the graph, by hand in simple cases and using technologyfor more complicated cases. b. Graph square root, cube root, and piecewise-defined functions, including step functions and absolute value functions.c. Graph polynomial functions, identifying zeros when suitable factorizations are available, and showing end behavior.e. Graph exponential and logarithmic functions, showing intercepts and end behavior, and trigonometric functions, showingperiod, midline, and amplitude.8. Write a function defined by an expression in different but equivalent forms to reveal and explain different properties of thefunction.a. Use the process of factoring and completing the square in a quadratic function to show zeros, extreme values, andsymmetry of the graph, and interpret these in terms of a context.b. Use the properties of exponents to interpret expressions for exponential functions.9. Compare properties of two functions each represented in a different way (algebraically, graphically, numerically in tables, orby verbal descriptions).Building Functions F-BF1. Build a function that models a relationship between two quantities.b. Combine standard function types using arithmetic operations.Build new functions from existing functions.3. Identify the effect on the graph of replacing f(x) by f(x) k, k f(x), f(kx), and f(x k) for specific values of k (both positive andnegative); find the value of k given the graphs. Experiment with cases and illustrate an explanation of the effects on the graphusing technology.4. Find inverse functions.a. Solve an equation of the form f(x) c for a simple function f that has an inverse and write an expression for the inverse.Linear, Quadratic, and Exponential Models F-LEConstruct and compare linear and exponential models and solve problems.4. For exponential models, express as a logarithm the solution to abct d where a, c, and d are numbers and the base b is 2, 10,or e; evaluate the logarithm using technology.Trigonometric Functions F-TF
Extend the domain of trigonometric functions using the unit circle.1. Understand radian measure of an angle as the length of the arc on the unit circle subtended by the angle.2. Explain how the unit circle in the coordinate plane enables the extension of trigonometric functions to all real numbers,interpreted as radian measures of angles traversed counterclockwise around the unit circle.Model periodic phenomena with trigonometric functions.5. Choose trigonometric functions to model periodic phenomena with specified amplitude, frequency, and midline. Prove and apply trigonometric identities.8. Prove the Pythagorean identity sin2(θ) cos2(θ) 1 and use it to calculate trigonometric ratios.Statistics and ProbabilityInterpreting Categorical and Quantitative Data S-IDSummarize, represent, and interpret data on a single count or measurement variable.4. Use the mean and standard deviation of a data set to fit it to a normal distribution and to estimate population percentages.Recognize that there are data sets for which such a procedure is not appropriate. Use calculators, spreadsheets, and tablesto estimate areas under the normal curve.Making Inferences and Justifying Conclusions S-ICUnderstand and evaluate random processes underlying statistical experiments1. Understand statistics as a process for making inferences about population parameters based on a random sample from thatpopulation.2. Decide if a specified model is consistent with results from a given data-generating process, e.g., using simulation.Make inferences and justify conclusions from sample surveys, experiments, and observational studies3. Recognize the purposes of and differences among sample surveys, experiments, and observational studies; explain howrandomization relates to each.4. Use data from a sample survey to estimate a population mean or proportion; develop a margin of error through the use ofsimulation models for random sampling.5. Use data from a randomized experiment to compare two treatments; use simulations to decide if differences betweenparameters are significant.6. Evaluate reports based on data.Using Probability to Make Decisions S-MD6. ( ) Use probabilities to make fair decisions (e.g., drawing by lots, using a random number generator).7. ( ) Analyze decisions and strategies using probability concepts (e.g., product testing, medical testing, pulling a hockey goalieat the end of a game).( ) Advanced Mathematics Standards Mathematical Modeling Standards
Algebra 2 Trimester 1 Expectations Chapter (McGraw-Hill Algebra 2) CCSS covered Key Vocabulary Vertical Alignment Chapter 0 (9 Days Suggested Pacing) Algebra 1 Content (Utilize as needed throughout Trimester at own pace.) (This content will not be directly assessed on district exams.) Chapter 1 (9 Days Suggested Pacing)
