Transcription
STATE OF WISCONSINSCHOOLREPORT CARDS2016-2017 School Year
DEPARTMENT OF PUBLIC INSTRUCTION“AGENDA 2017”ESEA Waiver(2011)College &Career ReadyStandardsSchool &EducatorEffectivenessStrongerAssessmentandData SystemsACT 55(2015-17 State Budget )REPORT CARDCHANGESTONIGHT’s FOCUS2
WI SCHOOL REPORT CARD 3
4
STATE OF WISCONSIN REPORT CARDS2016-17 CHANGES 5
ACT 55 &WI REPORTCARDS6
SCORE FLUCTUATIONS 7
ESSA & WI REPORT CARDS 8
A WALK THROUGH OF THE REPORT CARD9
10
11
12
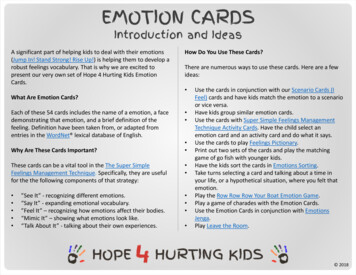
State of WI AccountabilityDeterminations - 2016/1713RATINGScore RangeStatePercentage forSCHOOLSStatePercentage forDISTRICTSSignificantly ExceedsExpectations83 to 10016%10%(361/2447)(44/422)Exceeds Expectations73 to 82.932%45%(719/2447)(190/422)Meets Expectations63 to 72.929%39%(643/2447)(166/422)Meets Few Expectations53 to 62.912%5%(261/2447)(20/422)Fails to Meet Expectations0 to 52.95%%(117/2447)(0/422)*411 schools were NOT scored / 1 district was NOT scored due toAlternative Accountability schools and/or choice programs with one year of data.
14A weighted average of PRIORITY AREAscores is used - NOT simple averaging.The weighting is different for schoolswithout all four PRIORITY AREAS(mostly High School)The weighted average includesVARIABLE WEIGHTINGbetween Student Achievement andStudent Growth based on the proportion ofeconomically disadvantaged students.The higher the proportion of economicallydisadvantaged students, the greater theweight is assigned to Student Growth andthe lesser to Student Achievement.
15
16Student Achievement for Reading and Math –Students’ level of knowledge and skills attainedcompared against State standards in EnglishLanguage Arts (ELA) and MathStudent Growth - How rapidly students aregaining knowledge and skills from year to year(pace of improvement in students’ performance)Closing Gaps – How much the school or district isclosing achievement gaps between student groupsOn-Track and Post-Secondary Readiness –Are students “on track” for meeting career andcollege readiness benchmarks? Measures for thisinclude grade 3 reading, grade 8 math, attendanceand graduation rate.Each PRIORITY AREA 100 points50 points for ELA50 points for Math
17
18DEDUCTIONSAbsenteeism Rate Must be less than 13%Dropout Rate Must be less than 6%If any of these data points are present, the school ordistrict is deducted 5 points from the total score.
19
20DemographicsSchool Type (Elem, MS or HS)EnrollmentRace / Ethnicity GroupsOther Student Groups including: Students with Disabilities Economically Disadvantaged Limited English Proficient
21
22Overall Proficiency &State AveragePercent Proficient & Advanced forMath (overall)Percent Proficient & Advanced forReading (overall)Comparison to State Average
FORT ATKINSONRESULTS23
24
SDFA Goals for StudentAchievement & State Report Cards: Performing above State Average Widening our Distance from State Average Performing Competitively with ComparableDistricts Evidence of Continuous Growth Schools and District Exceeding Expectations25
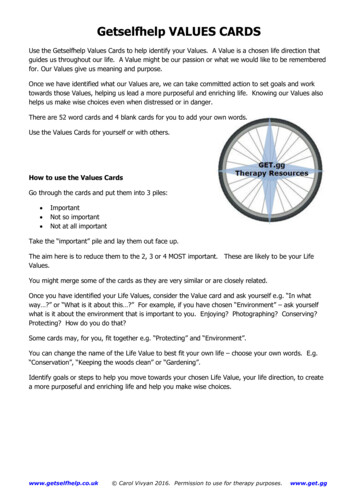
FORT ATKINSON REPORT CARD RESULTS26DISTRICT LEVEL7TH OVERALL OUT OF 16 COMPARABLE DISTRICTS*There were no report cards issued in 2015
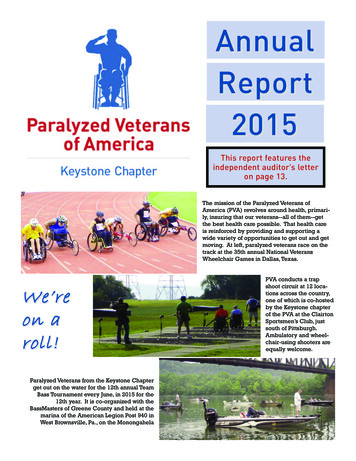
FORT ATKINSON REPORT CARD RESULTS 2017SCHOOL LEVEL OVERALL SCORE Accountability ScoreAccountability RatingBarrie81.3Exceeds ExpectationsLuther79.4Exceeds ExpectationsPurdy73.2Exceeds ExpectationsRockwell75.6Exceeds ExpectationsMiddle School78.4Exceeds ExpectationsHigh School64.8Meets Expectations
29ElementaryStrategicImprovementsPrior to 2018Test Administration
30Middle SchoolStrategicImprovementsPrior to 2018Test Administration
31 High School StrategicImprovements Prior to 2018Test Administration
32
To our teachers,support staff,principals,parents,Board of Education& communityfor their continuouscommitment toachieving ourmission33
34
FORT ATKINSON REPORT CARD RESULTS 2017 SCHOOL LEVEL OVERALL SCORE Accountability Score Accountability Rating Barrie 81.3 Exceeds Expectations Luther 79.4 Exceeds Expectations Purdy 73.2 Exceeds Expectations Rockwell 75.6 Exceeds Expectations Middle School 78.4 Exceeds Expectations High School 64.8 Meets Expectations