Transcription
THE SANBERNARDINOCOUNTYLABOR MARKETINTELLIGENCEREPORT
PROLOGUESan Bernardino County ranks among the fastest-growing population and jobcreation centers in the United States. Its impressive employment growthexceeds that of Southern California's Orange, Los Angeles and San Diegocounties.A creative and productive workforce greatly contributes to the long-termeconomic success of a region. Intelligent investment in the County’s laborforce propels our region and business community forward. We must applyenhanced understanding of the needs of our dynamic economy to theeducation of our existing and future talent base. We must instill the skillsessential to success.This Labor Market Intelligence and Analytics Report is the first of a collectionof Workforce Roadmap studies. It serves as a baseline to better understandwhere the region’s workforce and economic opportunities exist. The reportprovides valuable information to our partners across the educational andworkforce system including K-12, community colleges and universities, allservice providers, County departments, and the business community at large.We now have a greater understanding of our region with respect to labormarkets, our capacity to provide services to address needs, as well as vitaleconomic trends.With this first report, we embark on something unique. Traditionally, thesestudies tell us where we’ve been rather than looking forward to what liesahead. However, this report integrates predictive analytics. It applies real-timeintelligence through business engagement and enhanced labor market data.As a result, the report serves as a greatly improved tool to predict and guidefuture skills development. It highlights essential insight into emerging skillsdemand within the County.We must plan for the skills that will be in demand tomorrow by educatingpeople with those skills today. Once education and workforce systemsbecome predictive in nature, we have the means to proactively close our skillsgap.Vision2Succeed, a county-wide campaign launched this year, underscores thiscommitment. It strengthens the career skills of our local workforce. It connectsresidents to opportunities that enhance their qualifications to support existingemployers while attracting new employers to San Bernardino County.When we anticipate the skills of tomorrow and enhance existing skills, westrengthen the County’s greatest economic resource, our workforce.Tony MyrellChair, San Bernardino County Workforce Development Board
PREFACEThe overarching goal of the report is to identify key trends in theregion’s core industries in order to inform the Board’s investments inworkforce programs.The San Bernardino CountyWorkforce Development Board(WDB) engaged UC RiversideSchool of Business Center forEconomic Forecasting andDevelopment to undertake a LaborMarket Intelligence analysis with afocus on San Bernardino County ’sindustries and workforce. Theoverarching goal of the reportis to identify key trends in theregion’s core industries in orderto inform the Board’s investmentsin workforce programs. Using theUCR Labor Market Intelligencereport, the San Bernardino CountyWorkforce Development Boardwill continue its work of allocatingfunds to prepare the County ’sworkers for a dynamic economyand the evolving set of skills itdemands.
TABLE OFCONTENTS02EXECUTIVESUMMARY07ECONOMIC TRENDS:NATIONAL AND STATE19SAN BERNARDINOCOUNTY OVERVIEW37KEY INDICATORS:BROAD WORKFORCE TRENDS55INTEGRATEDINDUSTRY ANALYSIS111POLICYRECOMMENDATIONS
1
SAN BERNARDINO COUNTYLABOR MARKET INTELLIGENCE REPORTEXECUTIVESUMMARY2
SAN BERNARDINO COUNTYLABOR MARKET INTELLIGENCE REPORTSAN BERNARDINOCOUNTYOVERVIEWCounty employment grew3.6% year-to-year as ofQ1 2018 (CA, 2.4%). TheCounty’s average annual wageincreased 2.7% year-to-year.KEY INDICATOR 1MIGRATIONKEY INDICATOR 2COST OF LIVINGKEY INDICATOR 3LABOR FORCEPARTICIPATION RATE(LFPR)3The economy is expected to grow at a slower rate over the nearterm compared to previous years. Since 2010, the County’seconomy has added over 130,000 jobs, a growth rate of 27% (CA,19%). From 2010-2017, San Bernardino County wages grew by16% compared to 25% for the entire state. In 2017, the averagewage paid by the County’s employers stood at 43,033 per yearcompared to 65,492 at the state level.In 2017, the County on net saw roughly 25,000 new residents settlein the region through domestic migration.Home prices in San Bernardino County are 60% less than inneighboring Orange County and 50% less than in neighboring LosAngeles County. In 2017, median contract rent in San BernardinoCounty accounted for roughly 30% of median household income,below the 33% in Los Angeles and Orange Counties.While San Bernardino County’s youths (ages 16 to 24) have ahigher Labor Force Participation Rate (LFPR) than their coastalcounterparts, among the County’s prime working age population(ages 25 to 64), LFPR has been trending down for workers of alleducational attainment levels.
SAN BERNARDINO COUNTYLABOR MARKET INTELLIGENCE REPORT4
SAN BERNARDINO COUNTYLABOR MARKET INTELLIGENCE REPORTINTEGRATEDINDUSTRY ANALYSISLogistics (Transportation and Warehousing)Logistics employment is up by 13.8% year-to-year as of the first quarter of 2018. Since mid 2009, the Logisticssector has nearly doubled in size in San Bernardino County. Together, Warehousing and Transportation account for16% of the County’s total employment (1 in 6 jobs). The sector’s growth is expected to continue over the near termbut double-digit growth is not considered sustainable.INDUSTRY 1TRANSPORTATIONINDUSTRY 2WAREHOUSING5In 2017, the Transportation sector accounted for around 6% of Countyemployment. Since 2010, employment in Transportation has grown byapproximately 27% (around 9,000 jobs), which is in line with the sector’s growthat the state level. Transportation wages have been growing since 2010 and haveincreased by 13% since then (compared to 16% for overall wages in the County).The Transportation sector has created more jobs than the locally available talentpool can accommodate.In 2017, the Warehousing sector accounted for around 9% of Countyemployment. From 2010-2017, the number of warehousing jobs in the Countyhas nearly doubled, growing from roughly 35,000 to nearly 69,000. Wages in theWarehousing industry have grown by 5% since 2010 and on an annualized basis,accounting for inflation, real wages in Warehousing have declined since 2010.Trends in Warehousing wages have acted as a drag on the capacity for wagesto increase in the County’s broader economy. While the share of temporary helpservices workers has come down from its peak in 2015, temporary workers haverepresented a greater share of the County’s employment than they have in thestate since 1998.
SAN BERNARDINO COUNTYLABOR MARKET INTELLIGENCE REPORTINDUSTRY 3MANUFACTURINGINDUSTRY 4HEALTHCAREIn 2017, the Manufacturing sector accounted for around 9% of all jobs in both SanBernardino County and the State of California. Although historically declining,Manufacturing employment has grown 22.5% since 2010 in the County (CA,6% and U.S., 8%). The industry in the County has been growing at three timesthe pace of the industry’s growth in the rest of the state. In 2017, the averageManufacturing job in San Bernardino County paid an annual wage of 55,670.From 2012-2017, the number of Manufacturing workers commuting from LosAngeles County to San Bernardino County doubled. Among Manufacturingworkers in San Bernardino County who have less than a high school diploma,59% earned less than 30,000 in 2017, whereas 70% of those with at least abachelor’s degree made at least 50,000.In 2017, the Healthcare sector represented 14.3% of County employment. TheCenter expects the Healthcare industry to make the largest contributions to jobgains in San Bernardino County over the period from 2018 to 2028. From 20102017, the Healthcare sector grew by an impressive 59%, adding around 38,000jobs. Over that same period, wages in the Healthcare industry have been flat, ataround 47,000 per year. The number of County residents working in Healthcarewith a bachelor’s degree or above increased by 38% over the last five years.All four industry clusters profiled grew faster in terms of employment in San Bernardino County since 2010 thanthey did at the state or national levels. Together, these sectors account for around 40% of the County’s totalemployment, but they have accounted for 55% of all job growth in the County since 2010.6
NATIONAL & STATEOUTLOOK
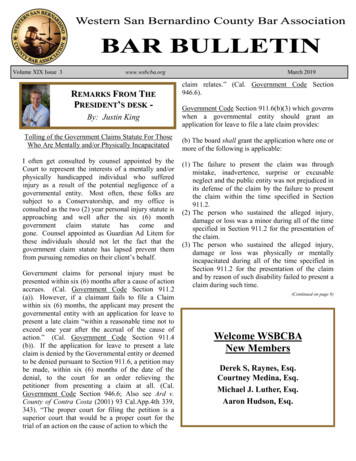
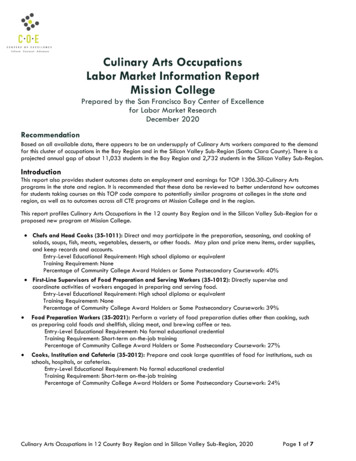
SAN BERNARDINO COUNTYLABOR MARKET INTELLIGENCE REPORTNATIONALOUTLOOKThe Center’s economic outlook for the U.S. economy hasn’t changed muchover the course of 2018, despite the fact that we are on the edge of thelongest economic expansion in the nation’s history.Growth has progressed at asteady, sustainable pace sincethe 2015 commodity bust andmild economic slowdown thatoccurred that year. Growth in thelast quarter of 2018 is expectedto come in at slightly less than3%, with growth for the entireyear reaching 3.2%. This modestjump is being driven by the fiscalstimulus plan passed by congressat the end of 2017. Outside of therapidly growing Federal budgetdeficit, the U.S. economy looksto be well-balanced in terms ofthe structure of growth with solidfundamentals including privatesector debt levels, consumersavings rates, rising wages, theoverall pace of homebuilding,and business investment.Unemployment is low—but jobgrowth remains steady.The Center ’s economic forecastremains boringly positive, and yes,that outlook is expected to stayin place through 2020. This isn’toptimism. Rather, we don’t haveany real reason to think otherwise.GDP AND TOTAL NONFARM GROWTHQ3-03 TO Q3-185420003201-20000-1-4000-2-3-6000-4-8000Change (000s)GDP GrowthSource: U.S. Bureau of Economic Analysis and U.S. Bureau of Labor Statistics; Analysis by UCR Forecast 10Q3-09Q3-08Q3-07Q3-06Q3-05Q3-04Q3-03-5Year over Year % GrowthChange in Employment (Thousands)4000
SAN BERNARDINO COUNTYLABOR MARKET INTELLIGENCE REPORT10
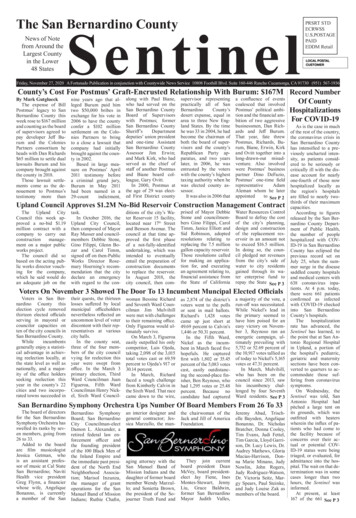
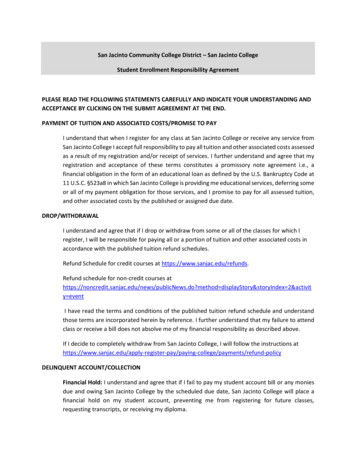
SAN BERNARDINO COUNTYLABOR MARKET INTELLIGENCE REPORTThe only major short-term worry hasbeen wrapped around the directionof U.S. trade policy, but the worstscenarios have not materialized. Ratherthan unilaterally pull out of NAFTA asthreatened, the United States insteadnegotiated a new trade agreementwith our two neighbors and largesttrading partners that, thankfully,looks almost exactly like the old tradeagreement. A brewing trade fight withthe European Union that began withsteel tariffs has also settled down,and there are now discussions aboutrenewing talks and working towards anew trade agreement.From a technical standpoint thereis not much change in the Center’sforecast for the U.S. economy. Theframing of the outlook is anotherstory. While little has changed in theactual economy, much of the publicdiscourse surrounding the economyhas taken a sharp turn for the worse.This new wave of pessimism has likelybeen driven by the sell-off in the stockmarket, slowing home sales, andrising interest rates. Yet, as we see it,these short run trends do not amountto anything that could truly threatenthe current expansion.Yes, the China trade dispute is stillbrewing. But even a major trade warwith China would not be sufficient toend the current economic expansion.The United States exports fairlylittle to China—only 8% of all thenation’s exports. And what does getshipped out typically doesn’t havea long supply chain. The greaterthreat comes from the fact that theUnited States sources 20% of itsmanufactured imports from China.But the tariff-increased costs to U.S.importers have been largely offsetby a 13% depreciation in the Yuanrelative to the U.S. dollar.FIXED RATES: MORTGAGE RATESNOV-83 TO NOV-18161412Rates-108642Source: Freddie Mac; Analysis by UCR Forecast v-93Mar-92Jul-90Nov-88Mar-87Jul-85Nov-830
SAN BERNARDINO COUNTYLABOR MARKET INTELLIGENCE REPORTPCE AND M2 GROWTHPCE GrowthM2 Year over Year % 0Feb-0410.0Oct-022.5Jun-0112.0Feb-003.0Oct-98PCE Year Over Year % GrowthOCT-98 TO OCT-18M2 GrowthSource: U.S. Bureau of Economic Analysis, Federal Reserve; Analysis by UCR Forecast CenterConsider rising interest rates. Mortgagesare now hovering just below 5%, up onepercentage point from where they weretwo years ago. But while this is a recenthigh, it is hardly a historic one. In fact,it is still lower than any time between1968 and 2008. Rates are higher butthey certainly aren’t high. And it isn’tsurprising that rates have drifted up giventhat the economy has been growing welland there has been a sharp increase inFederal borrowing.One wrongly assumed reason for risingrates is inflation. After years of inflationtracking below the Fed-targeted pace,price growth finally increased abovethe 2% mark. This should have madeinvestors more confident as deflation isless of a risk. Instead, it created a panicabout the potential for further increases.They need not have worried: the mostrecent numbers now show inflation backbelow the 2% range.The Center expects inflation to remainweak over the next few years. Oil pricesare once again down based on high levelsof U.S. output. Money supply growth isalso very constrained at the moment. Andyes, unemployment sits at an extremelylow 3.7%—but if this were going tohave an effect, we would already feelinflationary pressures on the economy.Add it up and we don’t see much chancefor rates to continue their upward drift.Moreover, the Federal Reserve seems tobe taking the hint from the flattening yieldcurve and has been signaling a gentlerfuture path on short run rates.The U.S. housing market has slowedas a result of the bump in mortgagerates, which has created considerableconsternation. However, there is a bigdifference between a housing pause anda housing bust. The U.S. housing marketis not overpriced, nor has there beenmuch risky lending – or lending in general– occurring. The pace of building hasbeen reasonable, so there is no excesssupply to worry about. That the market isresponding to changes in interest ratesis a good thing. Prices need to adjust to ahigher carrying cost; once that happens,the market should get back on track.The slowing pace of sales is part of thatprocess.As for the stock market sell off, it’s quiteamazing that the recent dip has createdsuch a wave of concern as it is no lessthan the sixth major sell off since theGreat Recession ended. And this saysmore about the stock market than theeconomy. Excessive growth in equityprices followed by excessive sell-offs isthe new normal in today’s high-speedelectronic trading environment. There hasalso been a lot of good news for corporateAmerica recently. Corporate taxes werecut sharply a year ago and gross profitsare growing again after being flat lastyear.So, for now, the Center is forecasting theexpansion to continue and, barring someunexpected external impact, does notanticipate any major change in economicgrowth between now and 2020.12
SAN BERNARDINO COUNTYLABOR MARKET INTELLIGENCE REPORT13
SAN BERNARDINO COUNTYLABOR MARKET INTELLIGENCE REPORTCALIFORNIAOUTLOOKAs 2018 progressed it became evident that the California economy wouldcontinue to prosper despite the challenge of a tight labor market andconcerns about the state’s housing situation.Indeed, California’s economicperformance was remarkablysteady in 2018, fueled byexpansion in the state’s industries,increases in incomes and wages,and in response to Federal taxcuts enacted early in the year. TheCenter expects a continuation ofthese trends in 2019 and possiblyinto 2020.As of October 2018, the state is ontrack to add approximately 337,000jobs in 2018, slightly less thanthe 340,000 added in all of 2017.Between February and October2018, California has consistentlyadded jobs at an average yearlyrate of 2.0%, virtually identicalrate to that of the same periodone year ago. The state’sunemployment rate has been inhistorically low territory for mostof the year, dropping to 4.1% in thelast two months, marginally higherthan the U.S. rate of 3.7%. All inall, the headline numbers lookgood as we move from 2018 into2019.14
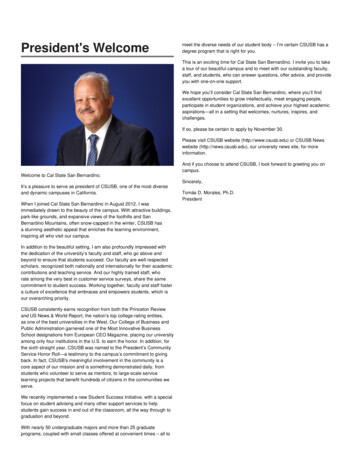
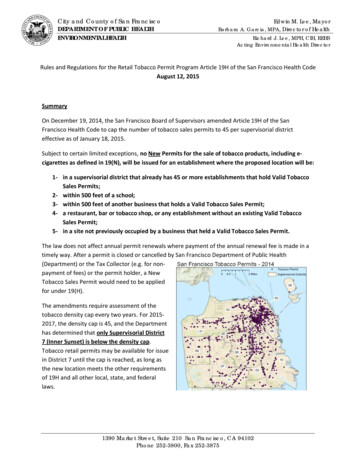
SAN BERNARDINO COUNTYLABOR MARKET INTELLIGENCE REPORTFor the month of October 2018,California’s 308,700 year-to-year jobgain was the second largest amongthe 50 states. One-fifth of the increaseoccurred in Healthcare (63,100),followed by Professional, Scientificand Technical Services, Leisure andHospitality, Administrative Services,Government, Construction, andTransportation. These seven industriesaccounted for 96% of the jobs addedin October, and have consistentlycontributed the lion’s share of job gainsthroughout the year. Over the sameperiod, three industries saw lossestotaling 8,000 jobs, small relative to thetotal, but evidence of recent weaknessin job growth in these areas.JOB GROWTH ACROSS CALIFORNIA INDUSTRIESIndustryOctober-18YTYYTY %Total Nonfarm17,236,600308,7001.8%Healthcare & Social Assistance2,357,20063,1002.8%Prof., Scientific & Technical Services1,287,00052,0004.2%Leisure & Hospitality2,009,50046,9002.4%Administrative Support Waste 001.4%Construction858,20030,0003.6%Transportation, Warehousing & al Services372,8005,5001.5%Real Estate & Rental & Leasing287,2003,1001.1%Mgmt. of Companies & Enterprises235,0001,4000.6%Finance & Insurance548,7001,0000.2%Mining and Logging22,30000.0%Retail Trade1,698,000-1,500-0.1%Wholesale Trade724,900-2,000-0.3%Other Services561,600-4,600-0.8%Source: CaliforniaUCR ForecastEmploymentCenter Development Department; Analysis by UCR Forecast Center15
SAN BERNARDINO COUNTYLABOR MARKET INTELLIGENCE REPORTWith California industries expandingin a tightening labor market, workershave experienced wage growth forseveral quarters running. In the secondquarter of 2018, the average weeklywage for private sector workerswas 1,265, up 4.6% over the prioryear. Over the same period, prices inCalifornia increased 2.6%, implyinga 2% inflation-adjusted gain in theaverage wage. This continues a recenttrend of wage increases generallyoutpacing inflation, giving workersmore purchasing power to drivespending and economic activity.CALIFORNIA AVERAGE WEEKLY WAGE OUTPACING INFLATION2017 TO Q2-20180.060.050.040.030.020.010.018.Q12017YTY % Change in Average California Weekly Wage (BLS QCEW)18.Q2CA Inflation Rate (DOF)Source: Quarterly Census of Employment and Wages, BLS; California Department of Finance; Analysis by UCR Forecast CenterMost headline economic numbersfor the state show that Californiamaintained an edge over thenation throughout the year. Its1.8% yearly growth rate in jobssurpassed the 1.6% gain for theUnited States in October 2018.California’s gross state productgrowth outpaced U.S. GDP inthe second quarter, with a 3.3%year-to-year gain compared to2.9% nationally. Over the sameperiod, the average weekly wagein California increased morerapidly at 4.6% compared to 3.4%for the nation. However, the U.S.labor force grew by 1.0% over thefirst ten months of this year, wellahead of California’s 0.4% growthrate. The scant increase in thestate’s work force is cause forconcern in 2019, although thereis evidence that metro area laborforce dynamics are such thatrapidly growing regions continueto attract workers, most notably inthe San Francisco Bay Area andthe Inland Empire.16
SAN BERNARDINO COUNTYLABOR MARKET INTELLIGENCE REPORTLooking ahead to 2019, the question is,where will growth occur in California?The answer depends on the type ofgrowth. Over the past three years,half of the job gains among thestate’s industries have occurred inits population serving sectors. Thistrend was led by Healthcare, which
School of Business Center for Economic Forecasting and Development to undertake a Labor Market Intelligence analysis with a focus on San Bernardino County’s industries and workforce. The overarching goal of the report is to identify key trends in the region’s core industries in order