Transcription
Earth Syst. Dynam., 12, 601–619, 2021https://doi.org/10.5194/esd-12-601-2021 Author(s) 2021. This work is distributed underthe Creative Commons Attribution 4.0 License.Interacting tipping elements increase risk ofclimate domino effects under global warmingNico Wunderling1,2,3 , Jonathan F. Donges1,4 , Jürgen Kurths1,5 , and Ricarda Winkelmann1,21 EarthSystem Analysis and Complexity Science, Potsdam Institute for Climate Impact Research (PIK),Member of the Leibniz Association, 14473 Potsdam, Germany2 Institute of Physics and Astronomy, University of Potsdam, 14476 Potsdam, Germany3 Department of Physics, Humboldt University of Berlin, 12489 Berlin, Germany4 Stockholm Resilience Centre, Stockholm University, Stockholm 10691, Sweden5 Institute of Information Technology, Mathematics and Mechanics, Lobachevsky University of NizhnyNovgorod, Nizhnij Novgorod 603950, RussiaCorrespondence: Nico Wunderling (nico.wunderling@pik-potsdam.de)and Ricarda Winkelmann (ricarda.winkelmann@pik-potsdam.de)Received: 26 March 2020 – Discussion started: 3 April 2020Revised: 15 March 2021 – Accepted: 7 April 2021 – Published: 3 June 2021Abstract. With progressing global warming, there is an increased risk that one or several tipping elementsin the climate system might cross a critical threshold, resulting in severe consequences for the global climate,ecosystems and human societies. While the underlying processes are fairly well-understood, it is unclear howtheir interactions might impact the overall stability of the Earth’s climate system. As of yet, this cannot be fullyanalysed with state-of-the-art Earth system models due to computational constraints as well as some missingand uncertain process representations of certain tipping elements. Here, we explicitly study the effects of knownphysical interactions among the Greenland and West Antarctic ice sheets, the Atlantic Meridional OverturningCirculation (AMOC) and the Amazon rainforest using a conceptual network approach. We analyse the risk ofdomino effects being triggered by each of the individual tipping elements under global warming in equilibriumexperiments. In these experiments, we propagate the uncertainties in critical temperature thresholds, interactionstrengths and interaction structure via large ensembles of simulations in a Monte Carlo approach. Overall, wefind that the interactions tend to destabilise the network of tipping elements. Furthermore, our analysis revealsthe qualitative role of each of the four tipping elements within the network, showing that the polar ice sheetson Greenland and West Antarctica are oftentimes the initiators of tipping cascades, while the AMOC acts as amediator transmitting cascades. This indicates that the ice sheets, which are already at risk of transgressing theirtemperature thresholds within the Paris range of 1.5 to 2 C, are of particular importance for the stability of theclimate system as a whole.11.1IntroductionTipping elements in the climate systemThe Earth system comprises a number of large-scale subsystems, the so-called tipping elements, that can undergolarge and possibly irreversible changes in response to environmental or anthropogenic perturbations once a certain critical threshold in forcing is exceeded (Lenton et al., 2008).Once triggered, the actual tipping process might take several years up to millennia depending on the respective response times of the system (Hughes et al., 2013; Lenton etal., 2008). Among the tipping elements are cryosphere components such as the continental ice sheets on Greenland andAntarctica; biosphere components such as the Amazon rainforest, boreal forests and coral reefs; and large-scale atmospheric and oceanic circulation patterns such as monsoonPublished by Copernicus Publications on behalf of the European Geosciences Union.
602N. Wunderling et al.: Interacting tipping elements increase risk of climate domino effects under global warmingsystems and the Atlantic Meridional Overturning Circulation (AMOC). With continuing global warming, it becomesmore likely that critical thresholds of some tipping elementsmight be exceeded, possibly within this century, triggeringsevere consequences for ecosystems, infrastructure and human societies. These critical thresholds can be quantifiedwith respect to the global mean surface temperature (GMT),resulting in three clusters of tipping elements that are characterised by their critical temperature between 1 and 3, between 3 and 5, and above 5 C of warming compared withpre-industrial temperatures respectively (Schellnhuber et al.,2016). The most vulnerable cluster, which is already at riskbetween 1 and 3 C of warming, includes several cryospherecomponents, specifically mountain glaciers as well as theGreenland and West Antarctic ice sheets. Recent studies suggest potential early-warning indicators for these tipping elements, showing that some of them are approaching or mighthave already transgressed a critical threshold (Lenton et al.,2019; Caesar et al., 2018; Nobre et al., 2016; Favier et al.,2014).1.2Interactions between climate tipping elementsThe tipping elements in the Earth system are not isolated systems; they interact on a global scale (Lenton et al., 2019;Kriegler et al., 2009). These interactions could have stabilising or destabilising effects, increasing or decreasing the probability of emerging tipping cascades, and it remains an important problem to understand how the interactions betweenthe tipping elements affect the overall stability of the Earthsystem. Despite the considerable recent progress in globalEarth system modelling, current state-of-the-art Earth systemmodels cannot yet comprehensively simulate the non-linearbehaviour and feedbacks between some of the tipping elements due to computational limitations (Wood et al., 2019).Furthermore, the interactions between tipping elements haveonly partially been described in a framework of more conceptual (but process-based) models, and our current understanding of the interaction structure of tipping elements ispartly based on expert knowledge. For a subset of five tipping elements, an expert elicitation was conducted that synthesised a causal interaction structure and an estimation forthe probability of tipping cascades to emerge (Kriegler etal., 2009). These studied tipping elements were the Greenland Ice Sheet, the West Antarctic Ice Sheet, the AtlanticMeridional Overturning Circulation (AMOC), the El Niño–Southern Oscillation (ENSO) and the Amazon rainforest (seeFigs. 1 and S3). Although this network is not complete withrespect to the physical interactions between the tipping elements and the actual set of tipping elements themselves(Wang and Hausfather, 2020; Lenton et al., 2019; Steffenet al., 2018), it presented a first step towards synthesisingthe positive and negative feedbacks between climate tippingelements. To the best of our knowledge, a systematic update of this assessment or a comparably comprehensive exEarth Syst. Dynam., 12, 601–619, 2021pert assessment has not been undertaken since Kriegler et al.(2009).Based on the network from this expert elicitation and aBoolean approach founded on graph grammars, an earlierstudy found that the strong positive–negative feedback loopbetween the Greenland Ice Sheet and the AMOC might actas a stabiliser to the Earth system (Gaucherel and Moron,2017). Also, using the interaction network data of Kriegleret al. (2009), it has been shown that large economic damages due to tipping cascades could arise with respect to thesocial cost of carbon, using a stochastic and dynamic evaluation of tipping points in an integrated assessment model (Caiet al., 2016). Other studies also quantified the economic impacts of single climate tipping events and tipping interactions(Lemoine and Traeger, 2016; Cai et al., 2015). In the lightof recent studies that hypothesise a considerable risk of current anthropogenic pressures triggering tipping cascades, upto a potential global cascade (towards a so-called “hothousestate” of the Earth system) (Lenton et al., 2019; Steffen et al.,2018), we here aim at developing a conceptual dynamic network model that can assess whether interactions of tippingelements have an overall stabilising or destabilising effecton the global climate state. As such, we view our approachas a hypotheses generator that produces qualitative scenarios(rather than exact quantifications or projections) that can thenbe further examined by more process-detailed Earth systemmodels. In this way, the results of this study can lay the foundations and possibly guide towards a more detailed analysiswith more complex models or data-based approaches.1.3Constraints from current observations andpalaeoclimatic evidenceObservations over the past decades show that several tippingelements are already impacted by progressing global warming (Wang and Hausfather, 2020; Lenton et al., 2019; IPCC,2014; Levermann et al., 2010). Ice loss from Greenland andWest Antarctica has increased and accelerated over the pastdecades (Shepherd et al., 2018; Khan et al., 2014; Zwally etal., 2011). Recent studies suggest that the Amundsen Basin inWest Antarctica might in fact have already crossed a tippingpoint (Favier et al., 2014; Rignot et al., 2014). The groundinglines of glaciers in this region are rapidly retreating, whichcould induce local marine ice sheet instabilities and eventually lead to the disintegration of the entire basin (Mercer,1978; Weertman, 1974). Palaeoclimate records suggest thatparts of Antarctica and larger parts of Greenland might already have experienced strong ice retreat in the past, especially during the Pliocene as well as during Marine IsotopeStage 5e and 11 (Dutton et al., 2015).It has also been shown that the AMOC experienced a significant slowdown since the mid 20th century (Caesar et al.,2018), which has led to the weakest AMOC state in centuries (Caesar et al., 2021). Models from Phase 5 of the Coupled Model Intercomparison Project (CMIP5) have shownhttps://doi.org/10.5194/esd-12-601-2021
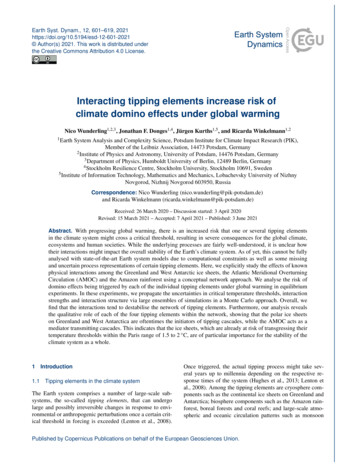
N. Wunderling et al.: Interacting tipping elements increase risk of climate domino effects under global warming603Figure 1. Interactions between climate tipping elements and their roles in tipping cascades. The Greenland Ice Sheet, the West Antarctic IceSheet, the Atlantic Meridional Overturning Circulation (AMOC) and the Amazon rainforest are depicted along with their main interactions(Kriegler et al., 2009). The links between the tipping elements are colour coded, where red arrows depict destabilising and blue arrows depictstabilising interactions. Where the direction is unclear, the link is marked in grey. A more thorough description of each of the tipping elementsand the links can be found in Tables 1 and 2 as well as in Sect. 2. Where tipping cascades arise, the relative size of the dominoes illustrateshow many ensemble members the respective climate component initiates tipping cascades in (red domino) or how many tipping cascades therespective climate component occurs in (blue domino). Standard deviations for these values are given in Fig. S1a and b. Generally, the polarice sheets are found to more frequently take on the role of cascade initiators than the AMOC and Amazon rainforest.that weakening of the AMOC is currently largely causedby changing surface buoyancy fluxes (Levang and Schmitt,2020). However, in the future, the overturning strength ofthe AMOC might also be adversely impacted by increasedfreshwater forcing of the North Atlantic ocean by meltwater influx from Greenland (Bakker et al., 2016; Böning et al.,2016). An AMOC slowdown also likely occurred during thelast deglaciation in the Heinrich event 1 and Younger Dryascold periods, as proxies from sea surface and air temperatures as well as climate model simulations suggest (Ritz etal., 2013).The Amazon rainforest is not only directly impacted byanthropogenic climate change, including the increased riskof extensive drought events or heat waves (Marengo and Espinoza, 2015; Brando et al., 2014), but also by deforestationand fire (Thonicke et al., 2020; Malhi et al., 2009). This increases the likelihood that parts of it will shift from a rainforest to a savannah state, for instance through diminishedmoisture recycling (Staal et al., 2018; Zemp et al., 2017). It issuspected that the Amazon rainforest could be close to a critical extent of deforestation which might, along with globalwarming, suffice to initiate such a critical transition (Nobreet al., 2016). This could put 30 %–50 % of rainforest ecosystems at risk of shifting the rainforest to tropical savannah ordry forests (Nobre et al., 2016). From a local to regional pointof view, the potential for critical transitions in the s further examined by more recent studies (Staal et al., 2020;Ciemer et al., 2019).1.4Structure of this workIn Sect. 2, we provide an overview of the biogeophysical processes governing the individual dynamics and interactionsof the four tipping elements considered here as well as howthese are represented in our conceptual network model. Wealso describe the construction of the large-scale Monte Carloensemble which enables us to propagate the parameter uncertainties inherent in the modelled tipping elements and theirinteractions. In Sect. 3, we explore how the critical threshold temperature ranges of the tipping elements change withincreasing overall interaction strength. We also show whichtipping elements initiate and transmit tipping cascades, revealing the characteristic roles of the tipping elements in theEarth system. Moreover, we discuss the distinct nature ofENSO as a potential tipping element and present results ofa robustness analysis including this additional tipping element in our network model. Section 4 summarises the resultsand discusses the limitations of our approach. It also outlinespossible further lines of research concerning tipping elementinteractions and the risks of emerging tipping cascades withmore process-detailed models.Earth Syst. Dynam., 12, 601–619, 2021
604N. Wunderling et al.: Interacting tipping elements increase risk of climate domino effects under global warmingFigure 2. Schematic overview of the generalised tipping element and time series of a tipping cascade. (a) Exemplary bifurcation diagramof a tipping element with two stable regimes: the lower state indicates the stable baseline regime, and the upper state indicates the stabletransitioned regime. For the Greenland Ice Sheet, for instance, these correspond to its pre-industrial, almost completely ice-covered state(stable baseline regime) and an almost ice-free state (stable transitioned regime), as can be expected in the long term for higher warmingscenarios (Robinson et al., 2012). There are two ways that a tipping element can transgress its critical threshold (unstable manifold) andmove into the transitioned state: an increase in the global mean surface temperature or via interactions with other climate components. Inboth cases, the tipping element converges to the stable transitioned regime indicated by the red hollow circles. (b) Exemplary time seriesshowing a tipping cascade of two elements. Here, Greenland transgresses its critical temperature (Tlimit,Greenland ) first, i.e. would becomeice-free. Through its interaction with the West Antarctic Ice Sheet, the West Antarctic Ice Sheet then transgresses the unstable manifold inthe vertical direction (following the path of the red upward-directed arrow in panel a). This example is based on a scenario with global meansurface temperature increase of 1.6 C above pre-industrial levels and an interaction strength d 0.16 (see also Fig. 3).2MethodsIn the following, we present our dynamic network approachfor modelling tipping interactions and cascades in the Earthsystem. In Sect. 2.1, we motivate the use of a stylised equation to represent climate tipping elements in a conceptualmanner. This equation exhibits a double-fold bifurcation (seeFig. 2)i1dxi h 3 xi xi ci.(1)dtτiHere, xi indicates the state of a certain tipping element, ci isthe critical parameter and τi the typical tipping timescalewith i (Greenland Ice Sheet, West Antarctic Ice Sheet,AMOC, Amazon rainforest). This approach has already beenused frequently for qualitatively describing tipping dynamicsin different applications and network types and has been applied to systems in climate, ecology, economics and politicalscience (Klose et al., 2020; Krönke et al., 2020a; Wunderling et al., 2020a; Dekker et al., 2018; Brummitt et al., 2015;Abraham et al., 1991).To describe the tipping elements’ interactions, we extendEq. (1) by a linear coupling term (Klose et al., 2020; Krönkeet al., 2020a; Brummitt et al., 2015) to yield Coupling termIndividual dynamics termz} {z} { 1Xdxi 1 xi3 xi ci dij xj 1 , (2) τidt2 jj 6 iand we describe the physical interpretation of these interactions between the tipping elements in Sect. 2.2. While thefirst term (individual dynamics term) determines the dynamical properties of each individual tipping element, the secondEarth Syst. Dynam., 12, 601–619, 2021term (coupling term) describes the effects of interactions between tipping elements. If the prefactors in front of the cubicand the linear term are unity as in Eq. (2) and the additivecoupling term is neglected (dij 0 for all i, j ), the criticalthreshold values where qualitative state changes occur areci1,2 4/27 (Klose et al., 2020). The system describedby this differential equation is bistable for values of the critical parameter between c1 and c2 and can here be separatedinto a transitioned and a baseline state, where xi 1 denotes the baseline state and xi 1 the completely transitioned one (see Fig. 2).Building on these model equations, we describe the fullyparameterised model and its parameters as it is used in thisstudy in Sect. 2.3. Specifications of how tipping cascades areevaluated and timescales are chosen can be found in Sect. 2.4and 2.5. Lastly, our large-scale Monte Carlo ensemble approach for the propagation of parameter and interaction network uncertainties is described in Sect. 2.6.2.1From conceptual to process-detailed models ofclimate tipping elementsIn the conceptual network model investigated in this study,the main dynamics of each of the tipping elements are condensed to a non-linear differential equation with two stablestates representing the current (baseline) state and a possibletransitioned state capturing the qualitative dynamics of generalised tipping elements (see Eq. 1). This serves as a stylisedrepresentation of the Greenland Ice Sheet, the West Antarctic Ice Sheet, the AMOC and the Amazon rainforest. Here,we focus on these four out of a larger range of tipping elements in the cryosphere, biosphere, and oceanic and atmospheric circulation patterns that have been suggested in thehttps://doi.org/10.5194/esd-12-601-2021
N. Wunderling et al.: Interacting tipping elements increase risk of climate domino effects under global warmingliterature (Schellnhuber et al., 2016; Scheffer et al., 2009;Lenton et al., 2008). In this study, we do not consider possible “back-tipping” (or hysteresis behaviour) of climate tipping elements, as the forcing represented by global meansurface temperature anomalies is only increased, never decreased, in our experiments. It is clear that the representationof a complex climate tipping element with all its interacting processes as well as positive and negative feedbacks ina stylised cusp bifurcation model is a strong simplification.In the following, we elaborate on why such a cusp bifurcation structure (Eq. 1) can nonetheless be assumed to capturethe overall stability behaviour of these four tipping elements(Bathiany et al., 2016) before we introduce more mathematical details of our dynamical systems approach in Sect. 2.3.2.1.1AMOCEarly conceptual models introduced in the 1960s showed thatthe AMOC could exhibit a cusp-like behaviour, using simplified box models based on the so-called salt–advection feedback (Stommel, 1961; Cessi, 1994). Many extensions and updates to this well-known box model approach have been putforward, each confirming the potential multi-stability of theAMOC (e.g. Wood et al., 2019). More complex Earth system models including a fully implicit ocean model (Huismanet al., 2010), Earth system models of intermediate complexity (EMICs, e.g. CLIMBER; Rahmstorf et al., 2005) and anatmosphere–ocean general circulation model (AOGCM, e.g.the FAMOUS model; Hawkins et al., 2011) have shown hysteresis behaviour which is qualitatively similar to Eq. (1).Furthermore, palaeoclimatic evidence suggests a bistability of the AMOC: in palaeoclimate records, Dansgaard–Oeschger events (see e.g. Crucifix, 2012) have been associated with large reorganisations of the AMOC (Ditlevsen etal., 2005; Timmermann et al., 2003; Ganopolski and Rahmstorf, 2002), where ice core data link the events to sea surfacetemperature increases in the North Atlantic. Even thoughthere are considerable uncertainties, estimates from the literature suggest that the level of global warming sufficient fortipping the AMOC is between 3.5 and 6.0 C (Schellnhuberet al., 2016; Lenton, 2012; Levermann et al., 2012; Lenton etal., 2008), with the risk of crossing a critical threshold considerably increasing beyond 4 C above pre-industrial temperature levels (Kriegler et al., 2009).2.1.2Greenland Ice SheetPrevious studies have shown that a double fold-like bifurcation structure for the ice sheets can arise from the melt–elevation feedback (Levermann and Winkelmann, 2016) aswell as from the marine ice sheet instability and other positive feedback mechanisms (e.g. DeConto and Pollard, 2016;Schoof, 2007). In particular, dynamic ice sheet model simulations have identified irreversible ice loss once a criticaltemperature threshold is crossed (Toniazzo et al., 2004), leadhttps://doi.org/10.5194/esd-12-601-2021605ing to multiple stable states and hysteresis behaviour for theGreenland Ice Sheet (Robinson et al., 2012; Ridley et al.,2010). In Robinson et al. (2012), the critical temperaturerange for an irreversible disintegration of the Greenland IceSheet has been estimated between 0.8 and 3.2 C of warmingabove pre-industrial global mean surface temperature levels.Palaeoclimate evidence further suggests that there have beensubstantial, potentially self-sustained retreats of the Greenland Ice Sheet in the past. It has, for instance, been simulated that the Greenland Ice Sheet can disintegrate if warmerocean conditions from the Pliocene are applied to an initiallyglaciated Greenland (Koenig et al., 2014). Further, Greenland was nearly ice-free for extended interglacial periods during the Pleistocene (Schaefer et al., 2016). Sea level reconstructions further suggest that large parts of Greenland couldhave been ice-free during Marine Isotope Stage 11 and thePliocene (Dutton et al., 2015).2.1.3West Antarctic Ice SheetCompared with the case of the Greenland Ice Sheet, different processes make the West Antarctic Ice Sheet susceptibleto tipping dynamics. As large parts of West Antarctica aregrounded in marine basins, changes in the ocean are key indriving the evolution of the ice sheet. The marine ice sheetinstability can trigger self-sustained ice loss where the icesheet is resting below sea level on retrograde sloping bedrock(Weertman, 1974; Schoof, 2007). This destabilising mechanism is possibly already underway in the Amundsen Sea region (Favier et al., 2014; Joughin et al., 2014; Joughin andAlley, 2011). Once triggered, a single local perturbation viaincreased sub-shelf melting in the Amundsen region couldlead to wide-spread retreat of the West Antarctic Ice Sheet(Feldmann and Levermann, 2015). Further, a recent studyhas shown strong hysteresis behaviour for the whole Antarctic Ice Sheet, identifying two major thresholds that lead toa destabilisation of West Antarctica around 2 C of globalwarming and large parts of East Antarctica between 6 and9 C of global warming (Garbe et al., 2020). It is likely thatthe West Antarctic Ice Sheet has experienced brief but dramatic retreats during the past 5 Myr (Pollard and DeConto,2009). Prior collapses have been suggested from deep-seacore isotopes and sea level records (Gasson, 2016; Dutton etal., 2015; Pollard and DeConto, 2005).2.1.4Amazon rainforestConceptual models of the Amazon have identified multistability between rainforest, savannah and treeless states,leading to hysteresis (Staal et al., 2016, 2015; Van Nes etal., 2014). This hysteresis has been found to be shaped bylocal-scale tipping points of the Amazon rainforest, and itsresilience might be diminished under climate change untilthe end of the 21st century (Staal et al., 2020). More complex dynamic vegetation models also found alternative stableEarth Syst. Dynam., 12, 601–619, 2021
606N. Wunderling et al.: Interacting tipping elements increase risk of climate domino effects under global warmingstates of the Amazon ecosystem (Oyama and Nobre, 2003)and suggest that rainforest dieback might be possible dueto drying of the Amazon Basin under future climate changescenarios (Nobre et al., 2016; Cox et al., 2004, 2000). Observational data further support the potential for multi-stabilityof the Amazon rainforest (Ciemer et al., 2019; Hirota et al.,2011; Staver et al., 2011). While it remains an open question whether the Amazon has a single system-wide tippingpoint, the projected increase in droughts and fires (Malhiet al., 2009; Cox et al., 2008) is likely to impact the forest cover on a local to regional scale, which might spreadto other parts of the region via moisture-recycling feedbacks(Zemp et al., 2017, 2014; Aragão, 2012). It is important tonote that in contrast to the ice sheets and ocean circulation,the rainforest is able to adapt to changing climate conditions to a certain extent (Sakschewski et al., 2016). However, this adaptive capacity might still be outpaced if climatechange progresses too rapidly (Wunderling et al., 2020c).A dieback of the Amazon rainforest has been found undera business-as-usual emissions scenario (Cox et al., 2004),which would be equivalent to a global warming of more than3 C above pre-industrial levels until 2100 ( 3.5–4.5 C(see also Schellnhuber et al., 2016)), mainly due to more persistent El Niño conditions (Betts et al., 2004).2.2Physical interpretation of tipping elementinteractionsBased on these conceptual models as well as building onfirst coupled experiments with a discrete state Boolean model(Gaucherel and Moron, 2017) and economic impact studies(Cai et al., 2016; Lemoine and Traeger, 2016; Cai et al.,2015), we describe the interactions of the four tipping elements in a network approach using a set of linearly coupled,topologically equivalent differential equations (Kuznetsov,2004). In the following, we go through the different main interactions of the four tipping elements considered here andexpand on the underlying physical processes. Overall, theadditional literature supports and refines the results from anearly expert elicitation (Kriegler et al., 2009).2.2.1Greenland Ice Sheet AMOCIncreasing freshwater input from enhanced melting of theGreenland Ice Sheet can lead to a weakening of the AMOC,as supported by palaeoclimate evidence as well as modelling studies (Driesschaert et al., 2007; Jungclaus et al.,2006; Rahmstorf et al., 2005). Palaeoclimatic records further suggest that the AMOC could exist in multiple stablestates, based on observed temperature changes associatedwith meltwater influx into the North Atlantic (Blunier andBrook, 2001; Dansgaard et al., 1993). Therefore, it is likelythat a tipping of the Greenland Ice Sheet would lead to adestabilisation of the AMOC (see Fig. 1).Earth Syst. Dynam., 12, 601–619, 20212.2.2AMOC Greenland Ice SheetConversely, if the AMOC weakens, leading to a decline inits northward surface heat transport, Greenland might experience cooler temperatures (e.g. Jackson et al., 2015; Timmermann et al., 2007; Stouffer et al., 2006), which wouldhave a stabilising effect on the ice sheet. With version 3 ofthe Hadley Centre Global Environment Model (HadGEM3),it has been shown that temperatures in Europe could drop byseveral degrees if the AMOC collapses, regionally up to 8 C(Jackson et al., 2015). A cooling trend in sea surface temperatures (SSTs) over the subpolar gyre, as a result of a weakening AMOC, has been confirmed by recent reanalysis andobservation data (Caesar et al., 2018; Jackson et al., 2016;Frajka-Williams, 2015; Robson et al., 2014). This “fingerprint” translates a reduction in overturning strength of 1.7 Svper century to 0.44 K SST cooling per century (Caesar et al.,2018). AMOC regime shifts between weaker and strongeroverturning strength during the last glacial period have beenassociated with large regional temperature changes in Greenland, for example during Dansgaard–Oeschger or Heinrichevents (Barker and Knorr, 2016). Moreover, there is palaeoclimatic evidence from 3.6 Myr ago that a weaker North Atlantic current as part of the AMOC fostered Arctic sea icegrowth which might have preceded continental glaciation inthe Northern Hemisphere at that time (Karas et al., 2020).Based on these findings, we assume that a weakening of theAMOC would have a stabilising effect on the Greenland IceSheet (see Fig. 1).2.2.3West Antarctic Ice Sheet AMOCIt remains unclear whether increased ice loss from the WestAntarctic Ice Sheet has a stabilising or destabilising effect onthe AMOC (see Fig. 1). Swingedouw et al. (2009) identifieddifferent processes based on freshwater hosing experimentsinto the Southern Ocean, which could be associated with amelting West Antarctic Ice Sheet (Swingedouw et al., 2009).Using the LOVECLIM1.1 EMIC, the authors found both enhancing and weakening effects on the AMOC strength. First,deep-water adjustments are observed. This means that an increase in t
ages due to tipping cascades could arise with respect to the social cost of carbon, using a stochastic and dynamic evalua-tion of tipping points in an integrated assessment model (Cai et al.,2016). Other studies also quantified the economic im-pacts of single climate tipping events and tipping interactions (Lemoine and Traeger,2016;Cai et al .