Transcription
Peer ReviewedTitle:Levee Decisions and Sustainability for the Sacramento-San Joaquin DeltaJournal Issue:San Francisco Estuary and Watershed Science, 8(2)Author:Suddeth, Robyn J, University of California, DavisMount, Jeff, University of California, DavisLund, Jay R, University of California - DavisPublication Date:2010Publication Info:San Francisco Estuary and Watershed Science, John Muir Institute of the Environment, UC 5j84gKeywords:levee, decision analysis, reliability, policy, DeltaAbstract:California’s Sacramento-San Joaquin Delta has fragile levees subject to several trends that makethem increasingly prone to failure. To assess the likely extent of Delta island flooding, this studypresents an economic decision analysis approach for evaluating Delta levee upgrade and repairdecisions for 34 major subsided agricultural islands that make up most of the Delta’s PrimaryZone and include all subsided, non-urban islands. The decision analysis provides a quantitativeframework to address several relevant questions about reasonable levee upgrade and repairinvestments. This initial analysis indicates that it is economically optimal not to upgrade levees onany of the 34 subsided Delta islands examined, mostly because levee upgrades are expensiveand do not improve reliability much. If upgrades can improve reliability more, it becomes optimalto upgrade some levees. Our analysis also suggests that, accounting for land and asset values,it is not cost effective to repair between 18 and 23 of these islands when they fail. When propertyvalues for all islands were doubled, only four islands originally not repaired become cost effectiveto repair. The decision analysis provides a quantitative framework for addressing several relevantquestions regarding reasonable levee upgrade and repair investments. These initial results mayact as a springboard for discussion, and the decision analysis model as a working framework forislands of high priority. An inescapable conclusion of this analysis is that maintaining the currentDelta landscape is unlikely to be economical from business and land use perspectives.
AUGUST 2010Levee Decisions and Sustainability for theSacramento-San Joaquin DeltaRobyn Suddeth1, Jeffrey Mount, and Jay LundCenter for Watershed Sciences, University of California, DavisOne Shields Avenue, Davis, CA 95616ABSTRACTCalifornia’s Sacramento-San Joaquin Delta has fragile levees subject to several trends that make themincreasingly prone to failure. To assess the likelyextent of Delta island flooding, this study presents aneconomic decision analysis approach for evaluatingDelta levee upgrade and repair decisions for 34 majorsubsided agricultural islands that make up most ofthe Delta’s Primary Zone and include all subsided,non-urban islands. The decision analysis provides aquantitative framework to address several relevantquestions about reasonable levee upgrade and repairinvestments. This initial analysis indicates that it iseconomically optimal not to upgrade levees on anyof the 34 subsided Delta islands examined, mostlybecause levee upgrades are expensive and do notimprove reliability much. If upgrades can improvereliability more, it becomes optimal to upgrade somelevees. Our analysis also suggests that, accounting forland and asset values, it is not cost effective to repairbetween 18 and 23 of these islands when they fail.When property values for all islands were doubled,only four islands originally not repaired become costeffective to repair. The decision analysis provides aquantitative framework for addressing several relevant questions regarding reasonable levee upgradeand repair investments. These initial results may act1 Corresponding author: robynsuddeth@gmail.comas a springboard for discussion, and the decisionanalysis model as a working framework for islands ofhigh priority. An inescapable conclusion of this analysis is that maintaining the current Delta landscape isunlikely to be economical from business and land useperspectives.KEYWORDSLevee, decision analysis, reliability, policy, DeltaINTRODUCTION: THE DELTA’S LEVEE SYSTEMCalifornia’s Sacramento-San Joaquin Delta is currently defined by its 1,770 km (1,100 miles) of levees.The Delta levee network was developed during thelate 19th and early 20th centuries to reclaim morethan 450,000 acres of freshwater and brackish marsh,mainly for agriculture. By the mid- and late-20thcentury, these levees became integral to local, state,and federal efforts to export water for urban andagricultural use. Four drivers are increasing probabilities of levee failure and island flooding: sea levelrise, subsidence, changing inflows, and earthquakes(Mount and Twiss 2005; URS Corporation and J. R.Benjamin & Associates 2009; Cayan 2008a, 2008b;Church and White 2006; Deverel 2007; IPCC 2007;Stewart and others 2005). Physically and financially,the Delta cannot easily withstand these increasing pressures (Lund and others 2007, 2008, 2010).
SAN FRANCISCO ESTUARY & WATERSHED SCIENCEDeltas around the world are having similar problems(Syvitski and others 2009).failure highlighted the high costs of levee failuresand caused some state planners to question the economic viability of funding repairs and upgrades,especially when this money might be applied towardsother public benefits or focused on prioritized islands(L. Harder, Senate Hearing, May 2006)Physically, the Delta’s levee network is rigid andbrittle. Most levees were poorly constructed onweak, seismically unstable foundations. They are thedescendents of originally small, private structuresthat have been expanded to cope with gradual landsubsidence, sea level rise, and erosion. This expansion, accomplished by adding material to the top andsides, was, until recently, not subject to modern engineering standards.Acting together, these physical and financial drivers or constraints are likely to shift the Delta fromits current configuration of narrow channels andsubsided islands toward a system with several additional bodies of open water. In this analysis, wefirst present current estimates of failure probabilitiesfor Delta levees, based principally on the recentlyreleased Delta Risk Management Strategy (DRMS)Phase 1 report (URS Corporation and J. R. Benjamin& Associates 2009), and identify resource allocationdecisions the State currently faces. We evaluate theeconomic costs of maintaining the current levee configuration in the Delta and present a simplified, yetthoughtful, decision analysis to economically optimize levee repair and upgrades for individual islands.Our conclusions about upgrade and repair policies inthe Delta extend those found in earlier studies (Logan1989). Decision analysis is broadly used as a tool forpublic policy makers, both as a way to understand,organize, and quantify a problem, and as a way tocompare the costs and benefits of various strategies.Decision analysis is valuable because it forces thedecision maker to articulate how various parametersinteract with each other, and identify a realistic andholistic set of alternatives (Hobbs and others 1997;Cheng and others 2008; Lund 2009).Delta levees can fail in several ways (Linsley and others 1964; Wood 1977; Mount and Twiss 2005; Mossand Eller 2007). Most commonly, levees fail fromslumping, rupturing, erosion or overtopping duringstorm events, or when high winds create large wavesat high tides. Levees also may fail on a relativelycalm day from internal degradation that has occurredover time with seepage, or from slumping and cracking that allows water to flow through and over thelevee. Seepage is common in most levees and usually does not lead to failure, but when water pressuregradients are great, seepage can erode material withinand under the levee, causing sand boils on the leveeinterior that eventually lead to collapse. Poor foundations, weak construction materials, and rodents allexacerbate these problems. Finally, a levee can failduring earthquakes. Shaking causes the foundation orembankments to lose cohesion, deform, and collapse.With continued levee degradation and increasingexternal forces, these failure pressures are all likely tobecome worse and more frequent (Mount and Twiss2005). Without intervention, it seems likely that leveefailures will increase in the future.Failure Probabilities: Certain Future,Uncertain TimingThe levees are under growing financial pressure aswell, often competing with other public interests inthe Delta and elsewhere for funds, amidst great concern for the region’s declining ecosystem and nativespecies. The fragile levee system depends largely onthe willingness of landowners and state and federalgovernments to invest in upgrading the levees orrepairing them when they fail. With 166 levee failures over the past 100 years, that willingness to payhas kept all but three major islands intact. However,the roughly 90 million cost of the 2004 Jones TractDelta levees are a certain to fail. For more than 100years, federal and state governments and Delta landowners have adapted to this reality. If the past were areliable predictor of the future, the state could simplymaintain the current Delta policy of supporting leveemaintenance and repairs, fighting floods, and repairing islands when their levees fail. However, conditions are not static in the Delta, and risks and costsare increasing.Using data from the DRMS Phase 1 report (URS2
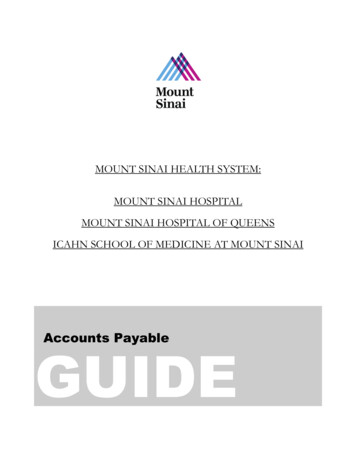
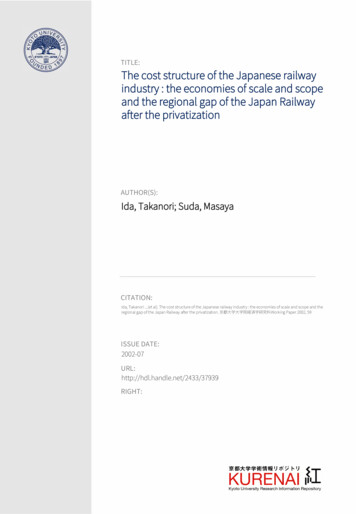
AUGUST 2010increasing through-seepage and under-seepage failures, and amplify the effects of poor levee construction and foundation conditions to increase the likelihood of levee failure during earthquakes. And all fourprocesses increase the frequency and consequence ofisland failures, while increasing the costs of repairand upgrades.Corporation and J. R. Benjamin & Associates 2009),we calculated the annual probability of island leveefailure from either hydrologic events or earthquakesfor 34 Delta islands that have subsided below meansea level (based on analysis in Mount and Twiss2005). Figure 1 shows the range of failure probabilities for 36 islands (including the two urbanizedislands, Bethel Tract and Hotchkiss Tract) over thenext 100 years. Based on current flood and seismicfailure probabilities, the median Delta island has a95% probability of failure between now and 2050and a 99% probability of failure by 2100. This probability of failure over extended periods is especiallyhigh for western Delta islands where, based on theDRMS data, each island has a roughly 99 percentWithout substantial and sustained levee investments,levee failures will transform some Delta islands toextensive bodies of open water. State and federal policy and funding for improving, repairing, restoring orabandoning levees will play a key role in determiningfuture Delta landscapes.Current Levee Policy and Policy ChallengesRoughly a third of Sacramento-San Joaquin Deltalevees are within federally authorized flood control projects, known as “project levees.” The othertwo-thirds are owned and maintained by local reclamation districts on behalf of private land-owners(“non-project levees”). Most project levees are maintained by local reclamation districts with oversightand inspection from the state, following federal leveepolicies. This analysis focuses on non-project levees.After significant floods in the Delta in 1986, the stateset new standards for Delta levees to reduce the frequency of island flooding. The Sacramento Districtof the Army Corps of Engineers and the CaliforniaDepartment of Water Resources (DWR) set standardsfor levee crown height and width and levee slopesfor agricultural levees. The State Hazard MitigationPlan (HMP) standard was viewed as an intermediatestandard with the long-term goal of upgrading to ahigher federal standard, termed “PL 84-99.” Thesestandards are summarized below in Figure 2. Leveesmeeting PL 84-99 standards qualify for federal aidif they are damaged by flooding. Discussions withseveral state and private Delta engineers indicate thatmost non-project Delta levees meet HMP standards,but few meet PL 84-99 standards.Figure 1 Maximum, median, and minimum probability of flooding from either earthquakes or floods for 36 Delta islandsprobability of at least one failure by 2050.These estimates are based solely on current likelihoods of failure; without major investments inlevees, the probabilities of island failures willincrease. Additionally, the effects of four processes—subsidence, flood inflows, sea level rise, and earthquakes—mutually re-enforce levee failure. IncreasingDelta inflows and sea level rise together reduce thefreeboard of the levees, increasing the frequency oflevee overtopping. Subsidence, sea level rise, andincreasing inflows act together to increase the relative difference in elevation between island interiorsand surrounding water surfaces. All three factors increase hydraulic gradients within the levees,Allocating ResourcesGiven the current fragility of the Delta levee systemand the increasing risks of failure, the state will need3
SAN FRANCISCO ESTUARY & WATERSHED SCIENCEpally through the Subventions Program (averaging roughly 6 million per year), which helpsfund levee maintenance. However, as shownbelow, the costs of upgrading all Delta levees toeven minimal current standards would requireextraordinary increases in state contributions,with only small decreases in flood risk.2. Repair and Restoration of Islands After Levee Failure.When island levees fail, state and local entities incurconsiderable island repair and recovery costs. Ashighlighted by the Jones Tract failure in June 2004,the economic impacts and costs to repair an islandwill often exceed the value of the land, often byseveral-fold. The cost of repairing a levee breach istypically 20 million to 40 million, depending onlocal conditions, with roughly equal additional costsfrom damages to island assets and losses to the localeconomy (URS Corporation and J. R. Benjamin &Associates 2009). The substantial investments neededto repair an island do little to reduce the likelihoodof future failures since the size of a levee breach isusually small compared to the length of levee onan island. Given the high cost of these repairs, thelow values of land they restore, and that repairsdo not reduce future failure rates, the state mightadopt a policy of not repairing all islands that failand to prioritize repairs, particularly when multipleisland failures occur in a single storm or earthquake.California’s Department of Water Resources (DWR)announced such a policy after Jones Tract flooded,but it has yet to be tested.Figure 2 Comparison of state and federal levee standardsto address at least three critical policy issues.1. Distribution of Available Resources. California voters, by passing Proposition 1E and Proposition 84 in2006, allocated more than 3 billion in state bondfunds to support levee improvements in the CentralValley (including the Delta). These funds and anyfuture state and federal funds can be distributed intwo ways:3. Levee Upgrades and Climate Adaptation. Californiais recognized as a national leader in climate changemitigation policies. However, to date, the state doesnot have well-defined policies regarding climatechange adaptation (Luers and Moser 2006; CaliforniaNatural Resources Agency 2009). This problem isparticularly acute in flood management in Californiain general (Galloway and others 2007) and in theDelta specifically. Climate change will require developing adaptation strategies that go beyond simplyimproving all Delta levees. This issue can be partlyaddressed with elements of the two policy challenges described above: selective investments in leveeupgrades and repair of islands that flood. Equally everywhere to mitigate flood riskthroughout the 1,770 kilometers of Delta leveesand the 2,735 kilometers of project levees outside of the Delta, or Concentrated at specific locations to meetbroader state objectives such as water supply,ecosystem restoration, transportation, and recreation, or to reduce the economic impacts oflevee failures. In the Delta, the state’s historicalapproach has been to apply a modest level ofresources broadly without prioritization, princi4
AUGUST 2010METHODS: EVALUATION OF LEVEEPOLICY DECISIONSDecision Analysis: Framework and MethodologyFormal analysis of levee and other flood-controldecisions requires a comparison of costs and benefits,weighed by probabilities, for several alternatives.Most levee or dike investments aim to reduce netflood damages (damages plus levee costs). This presents a dilemma for the decision-maker because thevalue of his or her investment is in part a function ofan uncertain future. Decision analysis provides a logical framework for cost-benefit comparisons of decisions options with uncertainty about their outcomes(Hobbs and others 1997; Cheng and others 2008;Lund 2009). All decision analyses require a probability model and a “value” model (Maguire 2004). Forflood structure analyses, the probable effectivenessof a levee or dike investment is factored into its economic evaluation by including probabilistic reliabilityanalysis in the economic decision theory framework.To address the three policy issues concerning futurelevee investments and repairs—how to distributefunds, whether investments to repair islands areworth the cost, and how to adapt levee policies toclimate change—we developed the Levee DecisionAnalysis Model (LDAM). This model supports a comparison of strategic options for levee managementfrom an economic perspective.Six combinations of levee upgrade and post-failurerepair are considered, with three upgrade levels eachhaving two post-failure repair strategies ("repair" or"no repair"). The three upgrade actions considered are1. No upgrade to levees2. Upgrade to PL 84-99 standards3. Upgrade to PL 84-99 standards plus 0.3 m (1 ft)to mitigate for expected sea level rise by midcentury (denoted upgrade PL 84-99 0.3 m SLR)Reliability analysis developed independently fromdecision analysis. Assessing the probability of structural failure for a levee or dike is a complicatedgeotechnical endeavor, depending on several otherstochastic variables such as storm events, underlying soils, river discharge, and location of an initialbreach (Wood 1977; Moss and Eller 2007). Manystudies focus almost exclusively on determining theappropriate probability distribution for flood eventsor a structural failure (Ang and Tang 1975; VanManen and Brinkhuis 2005). Given the complexity ofreliability analysis, it is common for decision analyses to adopt failure probabilities determined by a separate effort (Van Dantzig 1956; Eijgenraam 2006). Inthis analysis, we use the current failure probabilitiesfor Delta levees provided in the DRMS Phase 1 report(URS Corporation and J. R. Benjamin & Associates2009), and then, as sensitivity analysis, explore howresults change for lower failure probabilities.For each island, each upgrade policy comes with anaccompanying decision of whether or not to repairthat island when its levees fail (Table 1).Table 1 Levee Decision Analysis Model (LDAM) policy optionsOptionNumber123456Current Upgrade PolicyFuture RepairDecisionNo UpgradeNo UpgradeRepairNo RepairPL 84-99PL 84-99RepairNo RepairPL 84-99 0.3 m SLRRepairPL 84-99 0.3 m SLRNo RepairWe begin with a summary of the decision analysisframework and method, and then describe how thisanalytical framework can be applied to the Delta’slevees. We exclude heavily urbanized islands fromthe decision analysis results. Levee upgrades forurbanized islands will be subject to FederalEmergency Management Agency (FEMA) NationalFlood Insurance Program standards that are notaccommodated well in this initial decision analysis.Some studies bridge the gap between reliabilityand cost-benefit analysis by assessing the “risk” or“expected value” for a given levee height, width,or other characteristic (Voortman and others 2002;USACE 1996, 1999a, 1999b). These risk-based performance values are typically attained by summingthe net cost or benefit of future events multipliedby their probability of occurrence. Probabilistic5
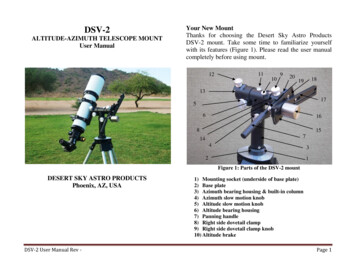
SAN FRANCISCO ESTUARY & WATERSHED SCIENCEweighting for the value of a current decision waspioneered in the Netherlands in Van Dantzig’s 1956assessment of optimal dike heights, and generallyin the United States in a body of economic decisiontheory work (Pratt and others 1964; Raiffa 1968).Reliability-based design uses these calculations todetermine flood protection investments based upona pre-accepted probability of failure (van Manen andBrinkhuis 2005; Bouma and others 2005; Woodalland Lund 2009).which provides the expected benefits (or costs) of aproject, given an amount of uncertainty in its futureperformance. For cases where economic consequencesare small relative to the overall wealth of the societyor decision-maker, risk-aversion should be negligible, and expected-value calculations are appropriate (Arrow and Lind 1970). The structure of decisionoptions and outcomes is often represented in a decision tree.The framework for organizing the sequence of decisions necessary for levee investments appears inFigure 3. Decision points among options (in our caseto upgrade levees, and to repair or abandon levees)are represented by boxes. Chance events and theiroutcome probabilities, such as levee failures, arerepresented by circles. The outcome values for eachchain of decisions and events appear at the right sideof the tree, and are used to assess the expected costsof the decision options. The tree branches out intoDecision analysis brings risk or expected benefitcalculations into a broader decision framework toallow comparison of several alternatives, as well asto incorporate a sequence of possible future decisions and/or events. Decision analysis is common inwork on optimal flood-protection design (Davis andothers 1972; USACE 1999a; Aven and Kørte 2002;Voortman and others 2002; Cheng and others 2008).An expected value is derived for each alternative,Figure 3 Island levee decision analysis tree for assessing whether to upgrade levees and to restore islands following flooding.Pff(t) probability of first failure at time t, Pf current probability of failure, r discount rate, Bk one year of island profits.6
AUGUST 2010Cost of Repairing an Island when it fails is a functionof the materials and engineering costs of fixing andre-enforcing breached levees, pumping out the island,and the lost profits from one year of lost agriculturalproduction on the island (assuming annual crops),plus those same costs occurring again and againfurther into the future each time the island fails.This second future cost term is represented by aninfinite series of future costs for repairing the islandeach (probabilistic) time it fails again. The presentvalue benefits of all future profits of the island (here,assumed equivalent to a property value corrected forfailure rate) are subtracted from these costs. In mathematical terms:the future. In this way, a decision analysis facilitatesthe logical structuring and comparison of alternativesunder uncertainty.The LDAM presented here applies these ideas. Asmentioned earlier, the state has three initial optionsfor Delta levees: (1) no upgrade to levees, (2) upgradeto PL 84-99 standards, or (3) upgrade to PL 84-99standards plus 0.3 m (1 ft) to mitigate for expectedsea level rise by mid-century. Regardless of whichdirection is taken now, in some (uncertain) futureyear the state will need to decide whether to repairan island when its levee fails. This formulation is avariant of a classic decision tree: the node of uncertainty does not split off into different uncertainevents with varying probabilities, but rather into different uncertain time-frames in which one event willoccur. In other words, like life insurance, uncertaintyrevolves around when failure will occur, not if failurewill occur.Cost CRepair Bk (CRepair Bk)(Pf /r) – (Bk/r)Where CRepair is the average cost of repairing afailure, Bk is one year of island profits, r is theinflation-corrected interest (discount) rate, and Pf isthe probability of island failure in any given year.The first term (CRepair) is the cost of repairing thefirst failure. The second term, Bk, is the loss of oneyear’s farm profit from island failure. The third term,[(CRepair Bk)(Pf /r)] is the present value cost of allfuture failures (derived under “Present Cost of Repair”below), and the fourth term [(Bk/r)] is the presentvalue of island profits (a negative cost).Because the present value of a current upgrade decision depends on the possible future flood and repairevents that follow, it must be calculated by workingbackwards. This procedure is called “folding back” insome analyses, and has been compared to backwarddynamic programming (Hobbs and others 1997).Values are estimated for repair choices occurringfurthest into the future for each upgrade strategy,and then the costs of those choices are weighted byan outcome probability and assigned to the presentvalue of that strategy. In other words, the first step inthe analysis is to look at the choices remaining afteran initial policy has been employed (for which costsare sunk) and a future uncertain event has occurred.More complex, non-stationary decision analysisproblems, such as long-term adaptation of levees toclimate change, can be optimized using dynamic programming (Zhu and others 2007).Cost of Not Repairing an Island when it fails is thesum of the cost of rebuilding or re-locating existinginfrastructure (such as highways, towns and railroads)and the cost of fortifying nearby islands that wouldbe newly vulnerable to wind and waves from newlyopen water. In mathematical terms:Cost of No Repair Cost to Reinforce DownwindIslands Cost of Lost InfrastructureOnce the cost of no repair and the cost of repair foreach island have been estimated, the least expensive(or most profitable) action (repair or no repair) can beidentified. The cost of this action is brought back tothe present time and assigned a present value. This iswhere probabilities and discount rates are importantfor the analysis. Because the costs of funding or notfunding repair are summed over an infinite rangeof potential times to failure, formulas are derivedto express these present values (Suddeth and others2008).Decision to Repair after FailureThe first step is to look at a point in the future justafter an island has failed, and determine if the economic value of the failed island justifies the costs ofits repair. The costs of each choice for an individualisland are discussed next.7
SAN FRANCISCO ESTUARY & WATERSHED SCIENCEDecision to Repair or Not Repair after Failure withUpgradesori-1-i(1 r )i 1For our problem, there is no failure in the present,but the first failure occurs at some uncertain time inthe future, so Wv W – C, or:Present Cost of Repair is the present value of allpresent and future repair costs, plus the cost ofupgrades, minus the present value of all future profits. Mathematically:W' Cost Upgrade Cost – (Bk/r) (CRepair Bk)(Pf /r)C 1- Pf (1- Pf )i-1-C-i(1 r )i 1The first cost term will not exist in the “no upgrade”case. In the case of an enhanced upgrade to mitigatefor 0.3 m (1 ft) of sea level rise, it will include thecost of that additional fortification. The only significant change in this formula from that of repair costswhen an island fails (presented above) is that there isno current cost of repairing the island today (becauseit has not yet failed), so that (CRepair Bk) onlyappears once and is multiplied by (Pf /r). The cost ofcurrent upgrades is incorporated to allow comparisonof the three strategies.Note that i-1-i P (1- P ) (1 r )fi 1f Pf1- Pf i 11- Pf1 ri Pfr Pfsince this part is an infinite geometric series. Thisallows the entire expression to be simplified toWv C Pf /r. Or, DFisf Pf /r for the present value(DF discount factor). The annualized value of thesecosts over an indefinite future period would be calculated by simply multiplying the cost C by the probability of failure Pf .The derivation of the infinite series of future repaircosts (third term) is as follows:Let C be the cost of each failure episode, andthe repair and damage costs of a failure event.Friedenfelds (1981) provides a useful formula forunderstanding the present value of an infiniteseries of future costs (W), W C W(1 r)-t ,which can be re-arranged algebraically to:The Present Cost of No Repair is the cost of upgradesapplied today to the island, plus the net presentexpected cost of upgrading surrounding islands andrebuilding infrastructure (roads, houses, railroads),minus the profit made from the island until the timeof failure. In mathematical terms:CCost Upgrade Cost – (Bk/r) (CNo repair Bk/r)*[Pf * [(1 r)/(r Pf )]]1- (1 r )-t .Where (Bk/r) - (Bk/r)*[Pf * [(1 r)/(r Pf )]] is thepresent expected value of the profit made on theisland until time of failure. The profits made beforefailure are subtracted from the total cost of abandoning the island.As the time between failures (t) increases, the presentvalue cost decreases both because failures are becoming less frequent and because of the increased effectsof discounting. For Freidenfeld’s derivation, the infinite series begins with a failure in the present. Whenthe time of failure is uncertain and represented by aprobability distribution, this becomes: 1- Pf (1- Pf )This logic can now be extended to the costs of repairor no repair for levees that have been upgraded.W CW i(CNo repair)*[Pf * [(1 r)/(r Pf )]] is the presentexpected cost of upgrading surrounding islands andrebuilding infrastructure (roads, houses, railroads).-iW C W Pf (1- Pf ) (1 r )The expected value of the discount factor for a failure cost occurring at an uncertain future time (th
Suddeth, Robyn J, University of California, Davis Mount, Jeff, University of California, Davis Lund, Jay R, University of California - Davis Publication Date: 2010 Publication Info: San Francisco Estuary and Watershed Science, John Muir Institute of the Environment, UC Davis Permalink: