Transcription
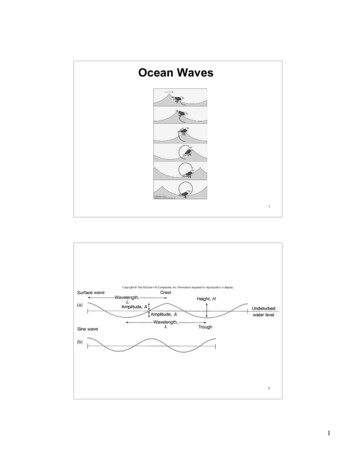
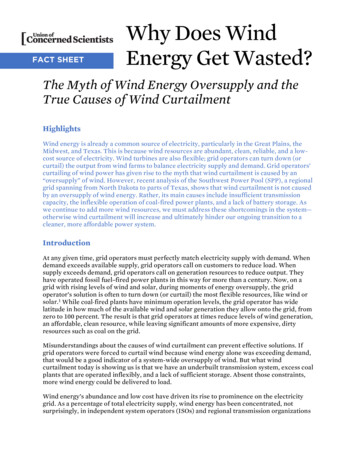
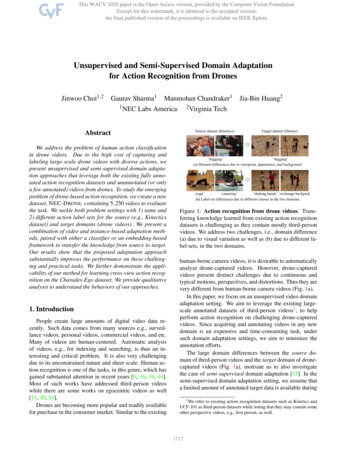
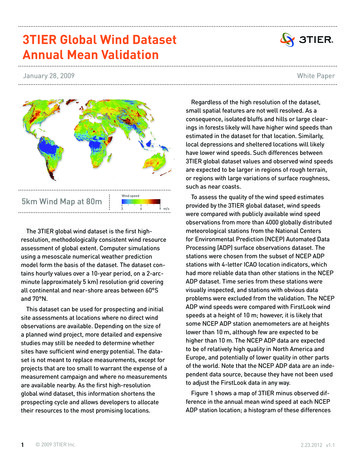
3TIER Global Wind DatasetAnnual Mean ValidationJanuary 28, 2009White PaperRegardless of the high resolution of the dataset,small spatial features are not well resolved. As aconsequence, isolated bluffs and hills or large clearings in forests likely will have higher wind speeds thanestimated in the dataset for that location. Similarly,local depressions and sheltered locations will likelyhave lower wind speeds. Such differences between3TIER global dataset values and observed wind speedsare expected to be larger in regions of rough terrain,or regions with large variations of surface roughness,such as near coasts.5km Wind Map at 80mWind speed369 m/sThe 3TIER global wind dataset is the first highresolution, methodologically consistent wind resourceassessment of global extent. Computer simulationsusing a mesoscale numerical weather predictionmodel form the basis of the dataset. The dataset contains hourly values over a 10-year period, on a 2-arcminute (approximately 5 km) resolution grid coveringall continental and near-shore areas between 60 Sand 70 N.This dataset can be used for prospecting and initialsite assessments at locations where no direct windobservations are available. Depending on the size ofa planned wind project, more detailed and expensivestudies may still be needed to determine whethersites have sufficient wind energy potential. The dataset is not meant to replace measurements, except forprojects that are too small to warrant the expense of ameasurement campaign and where no measurementsare available nearby. As the first high-resolutionglobal wind dataset, this information shortens theprospecting cycle and allows developers to allocatetheir resources to the most promising locations.1 2009 3TIER Inc.To assess the quality of the wind speed estimatesprovided by the 3TIER global dataset, wind speedswere compared with publicly available wind speedobservations from more than 4000 globally distributedmeteorological stations from the National Centersfor Environmental Prediction (NCEP) Automated DataProcessing (ADP) surface observations dataset. Thestations were chosen from the subset of NCEP ADPstations with 4-letter ICAO location indicators, whichhad more reliable data than other stations in the NCEPADP dataset. Time series from these stations werevisually inspected, and stations with obvious dataproblems were excluded from the validation. The NCEPADP wind speeds were compared with FirstLook windspeeds at a height of 10 m; however, it is likely thatsome NCEP ADP station anemometers are at heightslower than 10 m, although few are expected to behigher than 10 m. The NCEP ADP data are expectedto be of relatively high quality in North America andEurope, and potentially of lower quality in other partsof the world. Note that the NCEP ADP data are an independent data source, because they have not been usedto adjust the FirstLook data in any way.Figure 1 shows a map of 3TIER minus observed difference in the annual mean wind speed at each NCEPADP station location; a histogram of these differences2.23.2012 v1.1
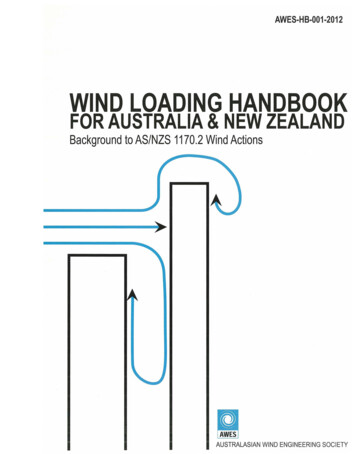
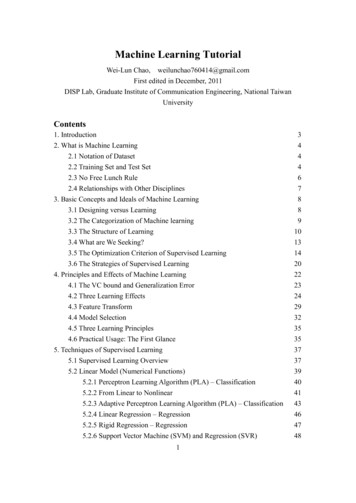
is displayed in Figure 2. The data show that the difference is less than 0.5 m/s at 50% of the stations, andthe difference is less than 1 m/s at 78% of the stations.The overall bias is 0.05 m/s relative to NCEP ADPobservations, and the root mean square error (RMSE)is 0.93 m/s.Because meteorological stations measure windspeeds at heights (typically 10 m) that are lower thanthose of interest for wind energy generation, 3TIER’swind speeds were also compared with wind observations from more than 400 tall towers in the U.S. andCanada with heights between 18 and 100 m. Figure 3shows a map of 3TIER minus observed difference inthe annual mean wind speed at each tower location; ahistogram of these differences is displayed in Figure 4.The difference is less than 0.5 m/s at 45% of the towers, and the difference is less than 1 m/s at 70% of thetowers. The bias is -0.22 m/s relative to tower observations, and the RMSE is 0.97 m/s. The larger differencesrelative to tower observations are likely due to thehigher wind speeds at tower observation heights thanat NCEP ADP observation heights.The map in Figure 1 indicates that there are variations in the magnitude of 3TIER minus observed differences from region to region. Figures 5-16 show mapsand histograms of 3TIER minus observed annual meanwind speed differences for six regions of the globe.The statistics of the comparisons for each regionare summarized in Table 1. Differences are relativelysmall in North America and Australia, and relativelylarge in Asia (particularly Japan and Korea), SouthAmerica (particularly Central America and the Caribbean), and Africa.The comparison with observations reveals that3TIER wind speed estimates are particularly good inareas of flat terrain. Differences from observationstend to be larger over rough terrain and near coasts,where there are naturally occurring strong gradientsin windspeed.Table 1. Summary of FirstLook minus observed annual mean difference statistics for specifiedregions, for the comparison with NCEP ADP station data.2Regionn 0.5 m/s 1 m/sBiasRMSENorth America242054%82%-0.14 m/s0.85 m/sSouth America30443%73% 0.26 m/s1.13 m/sAfrica22939%71% 0.34 m/s1.03 m/sEurope87146%75% 0.25 m/s0.94 m/sAsia28937%64% 0.61 m/s1.15 m/sAustralia4255%76%-0.19 m/s0.77 m/sGlobal415550%78% 0.05 m/s0.93 m/s 2009 3TIER Inc.2.23.2012 v1.1
GlobalFigure 1Figure 1. Map of 3TIER minus NCEP ADP observedFigure 2annual mean wind speed differences (m/s), for the3TIER global wind dataset.Figure 2. Histogram of 3TIER minus NCEP ADPobserved annual mean wind speed differences (m/s),for the 3TIER global wind dataset.3 2009 3TIER Inc.2.23.2012 v1.1
Figure 3U.S. and Canada Tall TowersFigure 3. Map of 3TIER minus tall tower observedFigure 4annual mean wind speed differences (m/s), for theU.S. and Canada from the 3TIER global wind dataset.Figure 4. Histogram of 3TIER minus tall towerobserved annual mean wind speed differences(m/s), for the U.S. and Canada from the 3TIERglobal wind dataset.4 2009 3TIER Inc.2.23.2012 v1.1
Figure 5North AmericaFigure 5. Map of 3TIER minus NCEP ADP observedFigure 6annual mean wind speed differences (m/s), for theNorth America region (U.S./Canada/Mexico) from the3TIER global wind dataset.Figure 6. Histogram of 3TIER minus NCEP ADPobserved annual mean wind speed differences (m/s),for the North America region (U.S./Canada/Mexico)from the 3TIER global wind dataset.5 2009 3TIER Inc.2.23.2012 v1.1
Figure 7South AmericaFigure 7. Map of 3TIER minus NCEPADP observed annual mean wind speeddifferences (m/s), for the South Americaregion (including Central America andthe Caribbean) from the 3TIER globalwind dataset.Figure 8Figure 8. Histogram of 3TIER minus NCEP ADPobserved annual mean wind speed differences (m/s),for the South America region (including CentralAmerica and the Caribbean) from the 3TIER globalwind dataset.6 2009 3TIER Inc.2.23.2012 v1.1
Figure 9AfricaFigure 9. Map of 3TIER minusNCEP ADP observed annualmean wind speed differences(m/s), for the Africa region(including the Middle East) fromthe 3TIER global wind dataset.Figure 10Figure 10. Histogram of 3TIER minus NCEP ADPobserved annual mean wind speed differences (m/s),for the Africa region (including the Middle East) fromthe 3TIER global wind dataset.7 2009 3TIER Inc.2.23.2012 v1.1
Figure 11EuropeFigure 11. Map of 3TIER minus NCEP ADP observedFigure 12annual mean wind speed differences (m/s), for theEurope region (including Greenland, far northernAfrica, and western Asia) from the 3TIER global winddataset.Figure 12. Histogram of 3TIER minus NCEP ADPobserved annual mean wind speed differences (m/s),for the Europe region (including Greenland, farnorthern Africa, and western Asia) from the 3TIERglobal wind dataset.8 2009 3TIER Inc.2.23.2012 v1.1
Figure 13AsiaFigure 13. Map of 3TIERminus NCEP ADP observedannual mean wind speeddifferences (m/s), for theAsia region (includingIndonesia) from the 3TIERglobal wind dataset.Figure 14Figure 14. Histogram of 3TIER minus NCEP ADPobserved annual mean wind speed differences (m/s),for the Asia region (including Indonesia) from the 3TIERglobal wind dataset.9 2009 3TIER Inc.2.23.2012 v1.1
Figure 15AustraliaFigure 15. Map of 3TIER minus NCEP ADP observedFigure 16annual mean wind speed differences (m/s), for theAustralia region (including New Zealand) from the3TIER global wind dataset.Figure 16. Histogram of 3TIER minus NCEP ADPobserved annual mean wind speed differences (m/s),for the Australia region (including New Zealand) fromthe 3TIER global wind dataset.10 2009 3TIER Inc.2.23.2012 v1.1
Canada with heights between 18 and 100 m. Figure 3 shows a map of 3TIER minus observed difference in the annual mean wind speed at each tower location; a histogram of these differences is displayed in Figure 4. The difference is less than 0.5 m/s at 45% of the tow-ers, and the difference is less than 1 m/s at 70% of the towers.