Transcription
Advancements in WindIntegration Study Data Modeling:The Wind Integration NationalDataset (WIND) ToolkitPreprintC. Draxl, B.-M. Hodge, K. Orwig, W. Jones,K. Searight, and D. GetmanNational Renewable Energy LaboratoryS. Harrold and J. McCaa3TIERJ. Cline and C. ClarkU.S. Department of EnergyTo be presented at the 12th International Workshop on the LargeScale Integration of Wind Power into Power SystemsLondon, EnglandOctober 22—24, 2013NREL is a national laboratory of the U.S. Department of EnergyOffice of Energy Efficiency & Renewable EnergyOperated by the Alliance for Sustainable Energy, LLC.This report is available at no cost from the National Renewable EnergyLaboratory (NREL) at www.nrel.gov/publications.Conference PaperNREL/CP-5D00-60269October 2013Contract No. DE-AC36-08GO28308
NOTICEThe submitted manuscript has been offered by an employee of the Alliance for Sustainable Energy, LLC(Alliance), a contractor of the US Government under Contract No. DE-AC36-08GO28308. Accordingly, the USGovernment and Alliance retain a nonexclusive royalty-free license to publish or reproduce the published form ofthis contribution, or allow others to do so, for US Government purposes.This report was prepared as an account of work sponsored by an agency of the United States government.Neither the United States government nor any agency thereof, nor any of their employees, makes any warranty,express or implied, or assumes any legal liability or responsibility for the accuracy, completeness, or usefulness ofany information, apparatus, product, or process disclosed, or represents that its use would not infringe privatelyowned rights. Reference herein to any specific commercial product, process, or service by trade name,trademark, manufacturer, or otherwise does not necessarily constitute or imply its endorsement, recommendation,or favoring by the United States government or any agency thereof. The views and opinions of authorsexpressed herein do not necessarily state or reflect those of the United States government or any agency thereof.This report is available at no cost from the National Renewable Energy Laboratory (NREL)at www.nrel.gov/publications.Available electronically at http://www.osti.gov/bridgeAvailable for a processing fee to U.S. Department of Energyand its contractors, in paper, from:U.S. Department of EnergyOffice of Scientific and Technical InformationP.O. Box 62Oak Ridge, TN 37831-0062phone: 865.576.8401fax: 865.576.5728email: mailto:reports@adonis.osti.govAvailable for sale to the public, in paper, from:U.S. Department of CommerceNational Technical Information Service5285 Port Royal RoadSpringfield, VA 22161phone: 800.553.6847fax: 703.605.6900email: orders@ntis.fedworld.govonline ordering: http://www.ntis.gov/help/ordermethods.aspxCover Photos: (left to right) photo by Pat Corkery, NREL 16416, photo from SunEdison, NREL 17423, photo by Pat Corkery, NREL16560, photo by Dennis Schroeder, NREL 17613, photo by Dean Armstrong, NREL 17436, photo by Pat Corkery, NREL 17721.Printed on paper containing at least 50% wastepaper, including 10% post consumer waste.
Advancements in Wind Integration StudyData ModelingThe Wind Integration National Dataset (WIND) ToolkitCaroline Draxl, Bri-Mathias Hodge, Kirsten Orwig,Wesley Jones, Keith Searight, Dan GetmanNational Renewable Energy LaboratoryGolden, CO, USAJoel Cline, Charlton ClarkU.S. Department of EnergyWashington, D.C., USASara Harrold, Jim McCaa3TIERSeattle, WA, USAintegration studies advanced. Some of the user-requestedimprovements included more-recent years of simulated data, alarger number of years for the evaluation of interannualvariability, a minimization of false ramps and spatial seams, amore-thorough incorporation of solar power inputs, and highertemporal resolution data. To address these needs, the U.S.Department of Energy wind and solar programs funded twoprojects to develop updated data sets: the Wind IntegrationNational Dataset (WIND) Toolkit and the Solar IntegrationNational Dataset (SIND) Toolkit. The WIND Toolkit spans theyears from 2007 to 2013 using advanced NWP methods run on anationwide 2-km grid with 5-min resolution, providing data atmore than 110,000 onshore and offshore wind power productionsites. This manuscript provides an overview of the WIND Toolkitmodeling advancements, site selection, data accessibility, andsome preliminary validation results.Abstract—Regional wind integration studies in the United Statesrequire detailed wind power output data at many locations toperform simulations of how the power system will operate underhigh-penetration scenarios. The wind data sets that serve as inputsinto the study must realistically reflect the ramping characteristics,spatial and temporal correlations, and capacity factors of thesimulated wind plants, as well as be time synchronized withavailable load profiles. The Wind Integration National Dataset(WIND) Toolkit described in this paper fulfills these requirements.A wind resource dataset, wind power production time series, andsimulated forecasts from a numerical weather prediction model runon a nationwide 2-km grid at 5-min resolution will be madepublically available for more than 110,000 onshore and offshorewind power production sites.Keywords-wind power; wind resourceintegration; numerical weather predictionI.assessment;windII.INTRODUCTIONA dearth of high-quality wind resource data for future windsites is one of the largest challenges in wind integration studies.Although observational data is to be favored, by definition itcannot be available for all locations considered for future highpenetration scenarios. Observed data should be used whereavailable, but care should be taken to recognize some of itslimitations. For example, wind speed data may be available atone location where a future wind plant is envisioned; however, itmay be at or near ground level. There can be significantdifferences between ground-level wind speeds and hub-heightwind speeds, and even then the single measurement point is notsufficient to represent the conditions at every one of tens ofturbines simultaneously. Some statistical techniques have beendeveloped to make the best use of limited datasets. Measure,correlate, predict (MCP) is one method that can be used tocompare the differences between observed winds at two locationsduring a short time period, and then produce longer time seriesbased on the relationships identified. This technique is best usedfor single locations that are geographically proximate to thedesired location.One of the difficulties in conducting integration studies ofhigh-penetration renewable energy futures is the requirement forhigh-resolution wind and solar power data. To conductsimulations of power system operations at these highpenetrations, wind power output at a minimum of 1-h resolutionis needed for a very large number of disparate locations. Becausethese future wind plants do not yet exist, the data used for thestudy must be simulated. Another requirement is that the windpower output should reflect the same weather conditions ashistorical load data which are also heavily influenced by theprevailing weather conditions. As part of the first phase of theWestern Wind and Solar Integration Study, a data set was createdby 3TIER using a mesoscale numerical weather prediction(NWP) model [1]. This dataset provided hourly wind power datafor approximately 30,000 sites in the Western Interconnection forthe three-year period from 2004 to 2006. These data sets were thefirst of their kind, and their output has subsequently been used inmany different types of research. However, improvements to thedataset were needed as the state of the art in renewableThis report is available at no cost from theNational Renewable Energy Laboratory (NREL)at www.nrel.gov/publications.MODELING BACKGROUND1
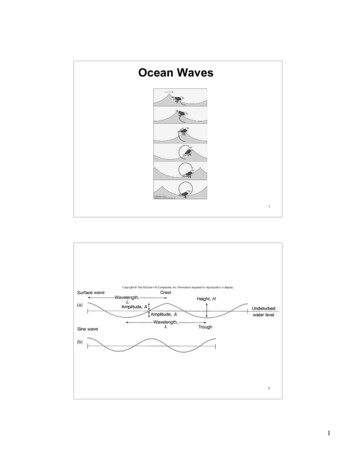
The use of reanalysis datasets [2] removes the need forobservational data, but still has many of the same flawsconcerning the discrepancy of conditions at even geographicallyproximate locations. Reanalysis datasets often contain substantialbiases [3], and are of too-coarse resolution for integration studies.Mesoscale NWP models can be used to downscale reanalysisdatasets while adding additional physical phenomena as a resultof their smaller spatial and temporal timescales, including theconsideration of local topographical features.Mesoscale models also have the advantage of being able tosimulate a large number of locations while maintaining thecorrelation of weather phenomena and their influence on localconditions from one location to the next. This spatial andtemporal correlation is essential for integration studies [4]. Lew etal. demonstrated some difficulties when utilizing NWP as thebasis for wind integration input datasets. Specifically, mesoscaleNWP models need to be nested/run regionally and restartedperiodically because of computational limitations. When splicedtogether, these temporal and spatial seams had some unintendedconsequences, such as false ramps, that resulted in unrealisticoutcomes (e.g., higher reserve requirements) during the powersystem modeling. These undesirable data characteristics had to becorrected or, if corrections were ineffective, chunks of the datahad to be removed. The following sections discuss in more detailthe current methodology and how some of these previous issueswere addressed.main selection criteria included: the wind resource, distance fromshore, and bathymetry. Location specification permitting was notconsidered. All of the sites were at least 8 km offshore with amaximum water depth of 30 m.Figure 1. Map of the final site locations. Each dot on this graph represents asite.IV.The WIND Toolkit was produced with the Weather Researchand Forecasting (WRF) model [5] version 3.4.1. By the end ofthe project, it will provide high-resolution NWP model outputthroughout a seven-year timeframe (2007 to 2013) at 5-mintemporal resolution. This data will be converted into publicallyavailable wind power production time series and simulatedoperational forecasts for 1-h, 4-h, 6-h, and day-ahead forecasthorizons at the 110,000 sites selected. The available parameterswill include power, barometric pressure, wind speed anddirection (at 100 m), relative humidity, temperature, and airdensity.The WRF model setup for the wind power production timeseries consisted of a main grid with horizontal grid spacing of 54km and three nested domains of 18 km, 6 km, and 2 km. For theforecasts, only the three outermost nested grids were used, whichcorresponds well with operational forecast grid spacing. Themodel was initialized and forced at the boundaries with InterimReanalyses of the European Centre for Medium-Range WeatherForecasts (ERA-Interim). The model terrain, roughness, and soilproperties were obtained from the U.S. Geological SurveyGTOPO30 data. Scale-selective grid nudging with the ERAInterim data was used. Grids were continuously relaxed towardthe large-scale reanalysis to prevent drift of the simulations awayfrom the analyzed synoptic patterns, and the model was restartedevery 30 days to avoid excessive drift. To eliminate temporalseams, the model was run with an overlap of 3 days aroundthese cold starts, during which the data were interpolated. Themodel physics options were based on a sensitivity study carriedout for this project, and included the NOAH land surface model,the YSU boundary layer scheme [6], and topographic windenhancement [7]. Model output statistics and post-processingtechniques will be applied before the data are made available.Creating and storing many terabytes of multiyear and highresolution wind resource output data requires innovativesolutions. The 2-km domain consists of 200 million grid points(3,007 x 1,633 horizontally and 41 vertical levels), which withoutput every 5 min would result in 10.6 petabytes for a seven-III. SITE SELECTIONThe site selection process was an important component of thedataset generation process. The goal of the site selectionmethodology was not to recommend future wind plant sites, butto select likely locations. Based on common-practice sitingcriteria, a total of 100,000 sites onshore and 10,000 offshore werechosen (see Fig. 1). Those included existing wind plants as wellas previous Western Wind and Solar Integration Study andEastern Wind Integration and Transmission Study locations. Eachsite was defined by a 2-km by 2-km grid cell in the NWP dataset,and it was assumed that eight 2-MW wind turbines was themaximum that could be accommodated per grid cell. Certainonsite locations were excluded from consideration based onenvironmental and land-use criteria: most federal lands and allNational Park Service and U.S. Fish and Wildlife Servicemanaged lands, open water areas, areas with a slope greater than20%, and those areas within a buffer area of developed land andairports. Although the location of existing transmission lines is animportant consideration in building a new wind plant, the largenumber of locations needed precluded transmission availability asa feasible criterion. However, because of the large number ofsites, users will have the ability to choose sites that mostadequately corresponded with their expected, planned, orsimulated transmission build-out scenarios.The site-selection model was run utilizing 3TIER’s 90 mcontinental U.S. wind resource dataset for mean annual windspeeds. Based on the exclusions and the buildable land area ineach cell, as well as the turbine type implied by the class of windspeed, each of the grid cells was provided with an effective MWhvalue. The sites were then ranked and the best 100,000 siteschosen, with care given to choose a geographically diversedataset, while enabling users to define plant build-outs byclustering sites. For the selection of the 10,000 offshore sites, theThis report is available at no cost from theNational Renewable Energy Laboratory (NREL)at www.nrel.gov/publications.MODEL RUNS2
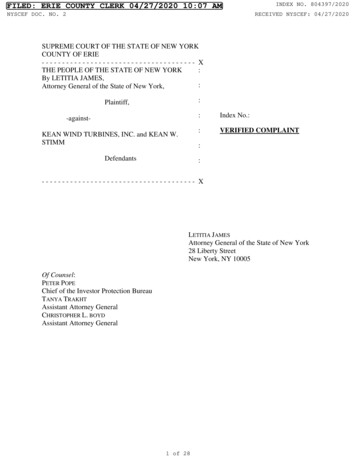
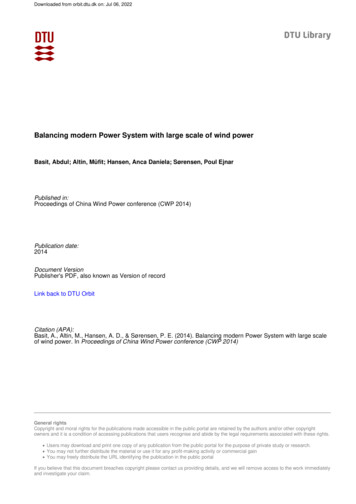
year simulation. This would require more than three years to runon a standard HPC system. Therefore, parallel asynchronous I/O(PnetCDF combined with WRF quilt-I/O) [7] was used to keeppace with continuous generation of output data. Thisasynchronous I/O method improved the output speed 50:1, andmade this project feasible.V.winter months. The bias is also higher during the winter.Although a zig-zag pattern is apparent during the summermonths, its amplitude is very small. Looking at seasonal anddiurnal cycles (not shown), we found this to be a result ofvariability in wind speed. The annual cycle of rank correlationfollows the behavior of RMSE, which reinforces the findingsabove.The distribution of the error metrics (Fig. 3) throughout a dayshows lower values for bias, CRMSE, and RMSE during themorning hours (14 – 21 UTC 7 – 14 local time). This is thetime when the mountains to the west of the NWTC heat up, andthe winds change to easterly. This is also the time when the windspeeds are often lower than at other times of the day. We suggesta combination of lower errors during low wind speeds and localforcing to be responsible for this pattern. The maximum ofRMSE, bias, and CRMSE around 11 UTC to 12 UTC (4 to 5local time) could be attributed to problems in capturing thetransition from stable boundary layers at night to convectiveboundary layers during the day. The rank correlation is highestwhen the errors are lowest, but is not high in general and does notchange much throughout a day. Values of higher correlationindicate similar patterns of wind speed in the model and theobservations.VALIDATIONAny data set is only of value if its deficiencies are known, asthen corrective actions may be taken. Therefore, we plan tovalidate the data set against tall towers in different geographicalareas and with different wind situations. The data will bevalidated from a meteorological point of view (e.g., diurnal andannual cycles, frequency distributions, error metrics), and from agrid integration perspective (e.g., ramps and variability of poweroutput). The power validation will be done against real poweroutput from existing wind plants, and cover, among others, rampsand variability distributions.The final validation will be performed against both the rawmodel data and the post-processed model output. Because theWIND Toolkit project is still underway, we show onlypreliminary results of the raw model output. As expected, thewinds are modeled more accurately in homogeneous than incomplex terrain, therefore we show results for a site in complexterrain: the National Wind Technology Center (NWTC) inColorado, United States. The NWTC is located at the foot of theRocky Mountains at an elevation of 1,850 m above sea level.Winds on-site are dominated by strong westerly winds, typicallyresulting from a drainage flow out of the nearby EldoradoCanyon. The site itself is flat and undeveloped, and the meanwind speed on-site is low, but winds can be extremely gusty andturbulent [8]. An 80-m tower monitors the wind flow in 1-minresolution, and serves as the truth against which the raw modeloutput of the WIND Toolkit for two years (2007 and 2008) wascompared.The absolute error metrics for the 5-min model output(instantaneous value) and the 1-min wind speed observations atthe same time, and those averaged over one hour, vary onlyslightly. A root-mean-squared-error (RMSE) for hourly averaged(5-min) values of 4.2 (4.5) m/s and a bias of 1.1 m/s show theneed for post-processing for complex wind sites. The values for asite on the U.S. East Coast and one in the Columbia River Gorgein the northwest United States are much lower (2.2 and 2.8 m/sfor RMSE, respectively). The model is prone to underpredictduring times of low wind speeds and overpredict during highwinds at the NWTC; however, the opposite is true for the othertwo sites. The post-processing will be done using a regionalapproach because of the number of sites and will nudge themodel closer to measured values. The error values throughout theyear and day are shown in Fig. 2 and Fig. 3, respectively.The annual cycle for the wind speed RMSE (Fig. 2 d) showslower RMSE values during the summer months and higher onesduring the winter months. The RMSE can be split into the biasand the centered root-mean-squared error (CRMSE) [9]. TheCRMSE considers the random component of the error andindicates the intrinsic skill of the model. The annual cycle of theRMSE is clearly dominated by the annual cycle of the CRMSE,which exhibits lower intrinsic skill at the NWTC during theThis report is available at no cost from theNational Renewable Energy Laboratory (NREL)at www.nrel.gov/publications.Figure 2. (a) Bias, (b) CRMSE, (c) RMSE, and rank correlation of 80-m windspeed at the NWTC for every month averaged during the years 2007 and 2008.3
VII. CONCLUSIONThe WIND Toolkit will be a freely available wind speed andpower data set that can be used for wind resource assessments, aswell as grid integration and grid planning studies. It will allowusers to perform detailed simulations of how the future powersystem will operate under high-penetration scenarios. The WINDToolkit dataset will realistically reflect ramping characteristics,spatial and temporal correlations, and capacity factors ofsimulated wind plants, as well as having the ability to be timesynchronized with available load profiles. In this manuscript, wedescribed the importance of creating this dataset, the challengesassociated with creating NWP simulations for a largegeographical area such as the continental United States, how thesimulated wind speeds will be converted to power, and initialvalidation results from the raw data set. The latter confirms theneed for regional post-processing approaches.ACKNOWLEDGMENTThis work was supported by the U.S. Department of Energyunder Contract No. DE-AC36-08-GO28308 with the NationalRenewable Energy Laboratory. The authors would like to thankall of the technical review committee participants who helped toshape the WIND Toolkit project.REFERENCES[1]Figure 3.C. Potter, D. Lew, J. McCaa, S. Cheng, S. Eichelberger, and E. Grimit,"Creating the Dataset for the Western Wind and Solar Integration Study,"Wind Engineering, vol. 32, pp. 325–338, 2008.[2] NOAA. NCEP Reanalysis. 2013. Available: www.esrl.noaa.gov/psd/[3] S. Pryor, R. Barhelmie, D. Young, E. Takle, R. Arritt, D. Flory, W.Gutowski, A. Nunes, and J. Roads, "Wind speed trends over the contiguousUnited States," J. Geophysical Research: Atmospheres, vol. 114, 2009.[4] D. Lew, C. Alonge, M. Brower, J. Frank, L. Freeman, K. Orwig, C. Potter,and Y.-H. Wan, "Wind data inputs for regional wind integration studies,"presented at the IEEE PES Annu. Meeting, Detroit, MI, 2011.[5] W. Skamarock, J. Klemp, J. Dudhia, D. Gill, D. Barker, M. Duda, X.-Y.Huang, W. Wang, and J. Powers, A Description of the Advanced ResearchWRF Version 3." Boulder, CO: National Center for Atmospheric Research,2008.[6] P. Jimenez and J. Dudhia, "Improving the representation of resolved andunresolved topographic effects on surface wind in the WRF model," J.Applied Meteorology and Climatology, vol. 51, 2012.[7] S.-Y. Hong, Y. Noh, and J. Dudhia, "A new vertical diffusion package withan explicit treatment of entrainment processes," Mon. Wea. Rev., 134, pp.2,318–2,341.[8] J. Li, W.-k. Liao, A. Choudhary, R. Ross, R. Thakur, W. Gropp, R.Latham, A. Siegel, B. Gallagher, and M. Zingale, "Parallel netCDF: Ahigh-performance scientific I/O interface," in ACM/IEEE SupercomputingConf., Phoenix, AZ, 2003.[9] A. Clifton, S. Schreck, G. Scott, N. Kelley, and J. Lundquist, "Turbineinflow characterization at the National Wind Technology Center,"presented at 50th AIAA Aerospace Sciences Meeting, Jan. 9–12, Nashville,TN, 2012. NREL/CP-5000-53525.[10] K. Taylor, "Summarizing multiple aspects of model performance in asingle diagram," J. Geophysical Research: Atmospheres, vol. 106, pp.7,183–7,192, 2001.[11] S. C. Pryor, R. J. Barthelmie, D. T. Young, E. S. Takle, R. W. Arritt, D.Flory, W. J. Gutowski Jr., A. Nunes, J. Roads, "Wind speed trends over thecontiguous United States," J. Geophysical Research: Atmospheres, vol.114, 2009.Same as Fig. 2, but as a function of time of the day (UTC).VI.POWER CONVERSIONThe conversion from wind to power will be done in thefollowing steps: 1) Bias removal from wind speeds, 2) windspeed adjustment for wakes with an empirical function, 3)application of power curves using different power curves foroffshore and Class 1 to Class 4 wind sites (Fig. 4), and 4)statistical adjustment to power.Figure 4. Power curves used to convert modeled wind speeds to power foroffshore and Class 1 to Class 4 locations.This report is available at no cost from theNational Renewable Energy Laboratory (NREL)at www.nrel.gov/publications.4
Integration Study Data Modeling: The Wind Integration National Dataset (WIND) Toolkit Preprint C. Draxl, B.-M. Hodge, K. Orwig, W. Jones, K. Searight, and D. Getman National Renewable Energy Laboratory S. Harrold and J. McCaa 3TIER J. Cline and C. Clark U.S. Department of Energy To be presented at the 12th International Workshop on the Large-