Transcription
An Analysis of the OperationalCosts of Trucking: 2017 UpdateOctober 2017
An Analysis of the Operational Costs of Trucking:2017 UpdateOctober 2017Alan HooperResearch AssociateAmerican Transportation Research InstituteAtlanta, GADan MurrayVice President, ResearchAmerican Transportation Research InstituteMinneapolis, MN950 N. Glebe Road, Suite 210Arlington, Virginia 22203www.atri-online.org
ATRI BOARD OF DIRECTORSJudy McReynoldsChairman of theATRI BoardChairman, President and CEOArcBest CorporationFort Smith, ARDavid S. CongdonVice Chairman and CEOOld Dominion Freight LineThomasville, NCMichael L. DuckerPresident and CEOFedEx FreightMemphis, TNRich FreelandPresident and COOCummins Inc.Columbus, INRobert E. LowPresident and CEOPrime Inc.Springfield, MORich McArdlePresidentUPS FreightRichmond, VAGregory L. OwenHead Coach and CEOAbility/ Tri-ModalTransportation ServicesCarson, CAAnnette SandbergPresident and CEOTranssafe Consulting, LLCDavenport, WAHugh H. FuglebergPresident and COOGreat West Casualty CompanySouth Sioux City, NERebecca M. BrewsterPresident and COOAmerican TransportationResearch InstituteAtlanta, GADave HuneryagerPresident and CEOTennessee TruckingAssociationNashville, TNChris SpearPresident and CEOAmerican TruckingAssociationsArlington, VADerek LeathersPresident and CEOWerner EnterprisesOmaha, NE
ATRI RESEARCH ADVISORY COMMITTEEScott Mugno, RAC ChairmanVice President, Safety,Sustainability and VehicleMaintenanceFedEx GroundSanford HodesRyder System, Inc.Senior Vice President and DeputyGeneral CounselJon BlackhamPolicy and Government AffairsCanadian Trucking AllianceKen HowdenDirector, 21st Century TruckPartnershipU.S. Department of EnergyAmy BoergerVice President, SalesCummins, Inc.Kelly KillingsworthVP of Inbound TransportationWal-mart Stores, Inc.Bill BrownManager of Fleet TelematicsSoutheastern Freight LinesVictoria KingVP Public AffairsUPSMichael ConynghamDirector of ResearchInternational Brotherhood ofTeamstersDustin KoehlVice President, Sales andMarketingTotal Transportation of MississippiBob CostelloSenior Vice President and ChiefEconomistAmerican Trucking AssociationsCaroline MaysDirector, Freight and InternationalTrade SectionTexas DOTTom CuthbertsonVice President, RegulatoryComplianceOmnitracs, LLCBrian McLaughlinPresidentTrimble Transportation MobilityMinnetonka, MNDennis DellingerPresidentCargo TransportersLisa MullingsPresident and CEONational Association of Truck StopOperatorsChip DudenVice President, Strategic BusinessAnalyticsWerner EnterprisesPaul J. EnosChief Executive OfficerNevada Trucking AssociationScott GeorgeChief Executive OfficerTCW, Inc.Mike GoliasDirector for Research,Intermodal Freight TransportationInstituteUniversity of MemphisVictor HartDirector of SafetyDOT Transportation, Inc.Tom MurthaSenior PlannerChicago Metropolitan Agency forPlanningBrenda NevillePresidentIowa Motor Truck AssociationDean NewellVice President, SafetyMaverick, Inc.Steve RaetzDirector of Research and MarketIntelligenceC.H. Robinson Worldwide, Inc.Karen RasmussenPresident and CEOHELP Inc.Wellington F. Roemer, IIIPresident and CEOWellington F. Roemer Insurance,Inc.Lee SarrattDirector of SafetyJ.B. HuntMark SavageDeputy ChiefColorado State PatrolAndrea SequinDirector, Regulatory ServicesSchneider National, Inc.Carl StebbinsCorporate Director ofAdmissions and MarketingNew England Tractor TrailerTraining SchoolHarold Sumerford, Jr.Chief Executive OfficerJ&M Tank LinesJames E. WardPresident and CEOD.M. BowmanTom WeakleyDirector of OperationsOwner-Operator IndependentDrivers Association Foundation
TABLE OF CONTENTSFIGURES AND TABLES . 2LIST OF ACRONYMS . 3INTRODUCTION . 4RESEARCH OBJECTIVE . 5METHODOLOGY . 6Representativeness . 9RESPONDENT DEMOGRAPHICS . 10Size of Operation . 10Type of Operation . 11Equipment . 12MOTOR CARRIER COSTS . 17Fuel . 17Equipment . 20Driver Pay . 20FINDINGS . 21Average Marginal Costs . 21Line Item Costs . 26Fuel Costs . 26Equipment Lease or Purchase Payments. 28Repair and Maintenance . 29Truck Insurance Premiums . 31Permits and Special Licenses . 32Tires . 33Tolls . 33Driver Wages and Benefits . 33Costs by Region. 35Straight Trucks . 35CONCLUSION . 37APPENDIX A . 381An Analysis of the Operational Costs of Trucking:2017 Update
FIGURES AND TABLESFigure 1: New and Expanded Survey Questions. 7Table 1: For-Hire Industry Sector Breakout . 9Figure 2: Respondent Fleet Size . 10Table 2: Respondent Revenue Statistics . 11Table 3: Survey Respondent Trip Types . 11Table 4: Survey Respondent Truck VMT and National Truck Registrations by Region 12Table 5: Survey Respondent Truck/Trailer Type, Average Truck Age, and AverageMiles Driven per Year per Truck . 13Table 6: Survey Respondent Equipment Trade Cycle. 13Table 7: Survey Respondent Reported Fuel Economy Compared to Typical OperatingWeight and Average Operating Speed . 15Figure 3: Average U.S. On-Highway Diesel Prices, 2008 – 2015 . 18Figure 4: Average U.S. On-Highway Diesel Prices, 2016 . 19Table 8: Average Marginal Costs per Mile, 2008-2016 . 23Table 9: Average Marginal Costs per Hour, 2008-2016 . 23Table 10: Annual Change of Average Marginal Costs . 24Table 11: Share of Total Average Marginal Cost, 2008-2016 . 25Table 12: Average Total Marginal Costs by Sector, 2008-2016 . 26Figure 5: Respondent Fuel Cost per Mile by Fleet Size . 28Table 13: Change in Annual VMT per Truck . 29Table 14: Repair and Maintenance Costs by Sector . 30Figure 6: Respondent Repair and Maintenance Cost per Mile by Fleet Size . 31Figure 7: Respondent Truck Insurance Premium Costs per Mile by Fleet Size . 32Table 15: Single Driver Bonus Pay by Type . 34Table 16: Average Marginal Cost per Mile by Region, 2016 . 35Table 17: Straight Truck Average Marginal Costs per Mile, 2016 . 36An Analysis of the Operational Costs of Trucking:2017 Update2
LIST OF MHOSLCVLNGLTLMCMPHNDAP&DRACR&MTLVMT3American Trucking AssociationsAmerican Transportation Research InstituteBureau of Labor StatisticsChief Financial OfficerCompressed Natural GasCost per HourCost per MileCompliance, Safety, AccountabilityEnergy Information AdministrationElectronic Logging DeviceFederal Highway AdministrationFederal Motor Carrier Safety AdministrationFreight Performance MeasuresHours-of-ServiceLonger Combination VehiclesLiquefied Natural GasLess-than-TruckloadMarginal CostMiles per HourNon-Disclosure AgreementPick-up and DeliveryResearch Advisory CommitteeRepair and MaintenanceTruckloadVehicle Miles TraveledAn Analysis of the Operational Costs of Trucking:2017 Update
INTRODUCTIONSince 2008, the American Transportation Research Institute (ATRI) has published AnAnalysis of the Operational Costs of Trucking, an annual report aimed at providing moreaccurate marginal cost data on motor carrier operations. In the 2008 inaugural study,ATRI identified historical research that reported cost calculation findings ranging from 22 per hour to over 370 per hour1 – figures which were considered unreasonably highor low by many in the trucking industry. Additionally, some of these studies calculatedcosts using highly subjective “value-of-time” calculations that may extend far beyonddirect costs – resulting in dramatic variability for industry costs depending on the metricsused.Consequently, ATRI undertook research to document and quantify motor carriers’ keyoperational costs, stratified by fleet size, sector, and region of the country. The goal ofthis research was to accurately identify and promulgate current operational costs basedon real-world data provided directly by motor carriers. The resulting analyses couldthen be used by both motor carriers as a high-level benchmarking tool, and by publicsector agencies for various transportation impact assessments.This research was initially identified as a top research priority by ATRI’s ResearchAdvisory Committee (RAC). 2 The RAC sought more accurate cost data to better informpolicymakers on the impact that new and potentially inefficient transportation fundingstrategies could have on freight movement. The trucking industry, which is heavilyreliant on the 4 million miles of public roadway in the United States, 3 has a vestedinterest in efficient, effective, and equitable funding and maintenance of the nation’stransportation system.Since its original publication in 2008, ATRI has received over 13,500 requests for theAnalysis of the Operational Cost of Trucking reports. Based on the continual highdemand for this research, ATRI has updated the “ops cost” data on an annual basis,making minor adjustments and improvements to the data collection methodology asneeded. Over the years, these improvements have led to a more streamlined processfor obtaining sensitive and proprietary fleet cost data on an annual basis. This reportincludes the most recent 2016 cost data.1Trego,Todd. An Analysis of the Operational Costs of Trucking. American Transportation Research Institute.Arlington, VA. 20082 The American Transportation Research Institute (ATRI) Research Advisory Committee (RAC) is comprised of industrystakeholders representing motor carriers, trucking industry suppliers, labor and driver groups, law enforcement, federalgovernment, and academics. The RAC is charged with annually recommending a research agenda for the Institute.3 Table HM-20 Public Road Length – Miles by Functional Class. Highway Statistics Series 2015. Federal HighwayAdministration, United States Department of Transportation. Available statistics/2015/pdf/hm20.pdfAn Analysis of the Operational Costs of Trucking:2017 Update4
RESEARCH OBJECTIVEThis research is predicated on the need for accurate and timely operational cost data inthe trucking industry. Although previous studies conducted by consultants andacademic entities have attempted to quantify these costs, the use of modeled data orhighly subjective value-of-time metrics produced immensely inconsistent results thatwere considered inaccurate or political by industry stakeholders. These disparateresults can be detrimental to both the trucking industry and public sector transportationplanners seeking objective, standardized data. For instance, lower operational costestimates have been used to downplay the value or significance of certaintransportation investments, while unreasonably high figures have been used tominimize the financial impact that innovative financing initiatives have on truckingcompanies and drivers.Continued improvements in ATRI’s operational cost methodology from 2008 through2016 4 have resulted in more precise cost metrics. The result of this research is astandardized survey methodology that captures and analyzes sensitive motor carrieroperational costs. The data presented in this report reflects 2016 cost data collectedfrom a wide range of motor carriers. With the addition of this 2016 data, ATRI has nowcollected nine years (2008 – 2016) of detailed operational cost data, providing aninvaluable presentation of changing industry costs over time.4Torrey, W. Ford and Dan Murray. An Analysis of the Operational Costs of Trucking: A 2016 Update. AmericanTransportation Research Institute. Arlington, VA. 2016.5An Analysis of the Operational Costs of Trucking:2017 Update
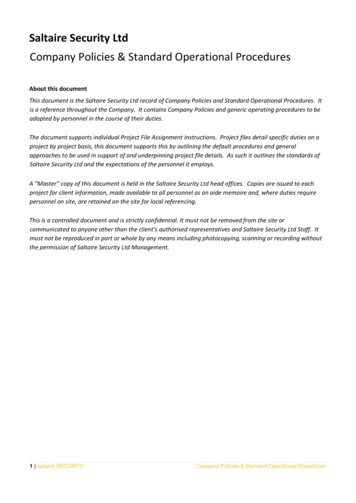
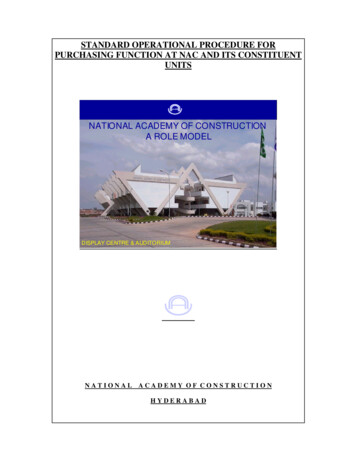
METHODOLOGYThis 2017 analysis utilized a similar data collection methodology to previous years.Several changes were made to the survey to allow for more detailed analyses of truckindustry segments and other operational factors in subsequent years as ATRI’srespondent base continues to grow.The first expansion in the 2017 survey was to allow respondents to provide a moredetailed classification of their business operations. The list was expanded to includeoperations that had previously been categorized as “Specialized;” namely Flatbed,Tanker, Express / Parcel Service, and Automotive Transportation operations (Figure 1).To account for this change, a second question was altered to collect information on theasset count and age from a more robust selection of trailer types to reflect the newbusiness operation categories for which information was requested.Another question was modified to allow for the collection of more granular incentive andbonus pay for both single and team truck-tractor drivers. Financial incentive and bonuspay per driver were requested for a set of standard industry incentives – safety bonus,on-time delivery bonus, new / starting driver bonus, and retention bonus – and alignedwith the same driver classifications for which driver wage and benefit data werecollected. These alterations will allow for a more comprehensive analysis of drivercompensation than had been possible in previous years.The most significant addition to the 2017 survey was an expansion of the informationcollected specifically on straight trucks, with a new section of the survey dedicated tothe costs associated with operating these trucks (Appendix A). Respondents are nowasked to provide a similar set of operational and cost data for straight trucks as hadbeen solicited for truck-tractors in previous iterations of the survey. The goal of thismajor expansion is to build a cost history and analysis for straight trucks in parallel withATRI’s current analysis of truck-tractor data. This expanded research scope will allowresearchers and practitioners to assess operational costs of straight trucks as their useproliferates with surging last-mile deliveries fueled by e-commerce.An Analysis of the Operational Costs of Trucking:2017 Update6
Figure 1: New and Expanded Survey QuestionsExpanded Question:What is your primary for-hire business operation type? (Select one)Truckload Less-Than-TruckloadFlatbedTankerExpress / Parcel ServiceIntermodal DrayageAutomotive TransportationDedicated ServicesHousehold Goods MoverOther (please specify):Expanded Question:What was your company’s fleet size, average age and average number of miles traveled (includingowner operators) in 2016 for each equipment type?Number ofAssetsTrailer TypeAverage Age(in years)28’ Trailer45’ Trailer48’ Trailer53’ TrailerTankFlatbedAuto TransporterRefrigerated TrailerOther (please specify):Other (please specify):Other (please specify):Expanded Question:Do you provide any additional financial incentives and/or bonus pay for SINGLE TRUCK-TRACTORdrivers that are not part of their regular wages? Yes No Don’t KnowIf yes, what was the average incentive and/or bonus pay paid per driver in 2016? (Please report as anannual average paid per driver.)Type of BonusCompany Driver /Company TruckLeased Driver /Company TruckOwner OperatorSafety BonusOn-Time Delivery BonusNew / Starting DriverRetention Bonus7An Analysis of the Operational Costs of Trucking:2017 Update
In addition to a host of demographic queries, the data collection form solicited commonindustry operational and financial metrics, and was beta-tested with motor carriers.Specifically, the research team solicited technical guidance and review from industryfinancial officers or those with working knowledge of motor carrier cost structures.Due to the highly competitive nature of the trucking industry and the extreme sensitivityassociated with corporate financials and expenditures, the operational cost informationwas collected confidentially from motor carriers at the per-mile or per-hour level, and thedata is presented in aggregate form only. ATRI also provided survey respondents withnon-disclosure agreements (NDA) as requested.Data collection efforts commenced in June 2017, with data request forms being sentelectronically to a representative group of for-hire carriers which included truckload (TL),less-than-truckload (LTL), and specialized fleets. ATRI also solicited carrierparticipation through targeted industry mailings and emails, news alerts, and coveragein major industry news outlets. The 50 State Trucking Associations also solicited
New England Tractor Trailer Training School . Harold Sumerford, Jr. Chief Executive Officer . J&M Tank Lines . James E. Ward . President and CEO . D.M. Bowman . Tom Weakley . Director of Operations . Owner-Operator Independent Drivers Association Foundation . An