Transcription
Foothill Transit AgencyBattery Electric Bus Progress ReportData Period Focus: Jan. 2020 through June 2020Leslie Eudy and Matthew JeffersDecember 2020NREL/PR‐5400‐76259
Table of ContentsIntroduction . 3Fleet Profile .4Report Structure 5Pomona BEB Results .6Results Summary . 7Evaluation Buses: Specifications 12Infrastructure Description . 14Data Summary .15Route Assignments . .17BEB Fleet Total Miles .18Availability Analysis .21Energy Consumption/Fuel EconomyAnalysis .28Road Call Analysis . . .36Maintenance Analysis . 38Arcadia BEB Results .57Results Summary .58Evaluation Buses: Specifications . 61Infrastructure Description 62Data Summary .63Route Assignments . . 64BEB Fleet Total Miles . 65Availability Analysis . 68Fuel Consumption/Fuel Economy . 73Road Call Analysis . . 80Maintenance Analysis 82Contacts . 96Acronyms and Abbreviations. 97Previous Foothill Transit Evaluation Reports 98Appendix A: Fleet Summary Statistics, Pomona. 100Appendix B: Fleet Summary Statistics, Arcadia . .112NREL 2
IntroductionThis report summarizes results of a battery electric bus (BEB) evaluation at Foothill Transit,located in the San Gabriel Valley area of Los Angeles, California. Foothill Transit is collaboratingwith the California Air Resources Board and the U.S. Department of Energy’s National RenewableEnergy Laboratory (NREL) to evaluate the buses in revenue service. The focus of this evaluation isto compare the performance and the operating costs of the BEBs to that of conventionaltechnology buses and to track progress over time. Previous reports documented results fromApril 2014 through December 2019 (report references). This report extends the previous dataanalysis through June 2020 and includes additional data analysis for a second fleet of BEBsoperating at another depot. The data period focus of this report is January 2020–June 2020. Thisis the final planned progress report on the Foothill Transit fleet. NREL will publish a final technicalreport in early 2021 that incorporates data through December 2020.Each NREL evaluation tracks data and performance results for a specific transit agency operatinga specific manufacturer’s technology design. Results from different original equipmentmanufacturer designs will vary and are not necessarily representative of a specific technology.Results also will vary from agency to agency and even between facilities within the same agency.Readers should keep this in mind when using these results for decision‐making.NREL 3
Fleet ProfileFoothill Transit serves a 327‐square‐mile area covering theSan Gabriel and Pomona Valleyregion of Los Angeles County.Foothill Transit’s administrativeoffice is located in West Covina,California. Foothill Transit isgoverned by a joint powersauthority of 22 member citiesand the County of Los Angeles.Foothill Transit operates 36 local and express routes, including commuter runs to downtown LosAngeles. The current bus fleet consists of 343 compressed natural gas (CNG) buses and 33 BEBs.NREL 4
Report StructureFoothill Transit operates BEB fleets at both its operation and maintenance facilities:Operations &Maintenance FacilityBEB Fleet DescriptionNREL BEB Number ofFleet IDBusesProterra, 35‐ft fast charge (originaldemonstration fleet)PomonaArcadiaCharging Strategy2On route, fast chargeProterra, 35‐ft fast chargeBEB 35FC12On route, fast chargeProterra, 40‐ft fast chargeBEB 40FC2On route, fast chargeProterra, 40‐ft Catalyst, extendedrangeBEB 40E214Plug in at depot with supplemental fastcharging on routeProterra, 35‐ft Catalyst, extendedrangeBEB 35E23Plug in at depotNREL is collecting data on the four BEB fleets with assigned fleet IDs above and two CNG baseline fleets—one ateach facility. The BEB 35E2 fleet at the Arcadia facility is not the focus of this report; however, NREL collectsselected data to enable analysis of cost per mile for all BEBs at the Arcadia facility. This report is organized into twosections based on where the buses are operated. The first section focuses on the buses operated out of Pomonaand the second section covers the buses operated out of Arcadia.NREL 5
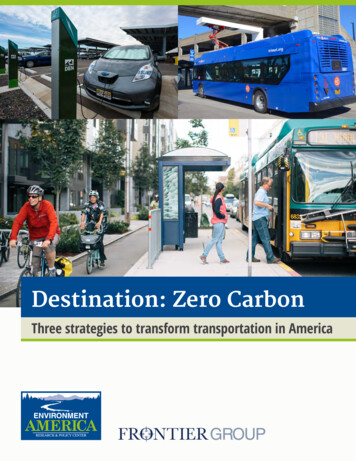
Pomona BEB ResultsProterra BEB 35FCProterra BEB 40FCNorth American Bus Industries (NABI) CNG baseline
Results SummaryBus fleets: Evaluation includes 12 Proterra 35‐ft fast charge buses (BEB 35FC), 2 Proterra 40‐ftCatalyst fast charge buses (BEB 40FC), and 8 NABI 42‐ft CNG buses.Bus use: The BEBs are operated on a 16‐mile route (Line 291) that circles through the PomonaTransit Center (PTC) for charging. The average speed for this route is 10.6 miles per hour (mph). TheCNG buses are randomly dispatched on all routes out of the operations facility, including higher‐speed commuter routes. The average speed for the CNG buses is 17.6 mph. This difference in dutycycle influences the comparison of mileage, fuel economy, and costs per mile between fleets.Reduced service: In April 2020, Foothill Transit reduced its service to 70% because of shutdownsfor the COVID‐19 pandemic. This resulted in significantly lower mileage accumulation on the BEBs,which has a noticeable effect on analyses that use mileage for calculations.Availability: Availability in the first half of 2020 was 53% for the BEB 35FC buses, 70% for the BEB40FC buses, and 90% for the CNG buses. Most unavailable time for the BEBs and CNG buses wasdue to general bus‐related problems. Issues with the low‐voltage batteries affected BEB availability.Other downtime resulted from issues with the energy storage system.NREL 7
Results Summary (continued)Fuel economy: From the beginning of the evaluation, NREL has collected miles and energy usefrom the Proterra data system on each bus. In 2018, Proterra transitioned its data system to anew system to increase capability. During the transition, some data were lost. In early 2018,Foothill Transit installed individual data loggers on each of its BEBs. NREL is using these data forcalculating the fuel economy for the 35‐ft buses. The data logger data for the BEB 40‐ft buseswere not available until May 2019. These data gaps are marked on the charts.BEB energy efficiency in the first half of 2020 was 1.91 kWh/mi for the BEB 35FC fleet and 1.92kWh/mi for the BEB 40FC. Fuel economy for the CNG bus fleet was 3.44 miles per gasoline gallonequivalent (mpgge). For comparison, diesel equivalent fuel economy was 19.69 miles per dieselgallon equivalent (mpdge) for the BEB 35FC, 19.61 mpdge for the BEB 40FC, and 3.94 mpdge forthe CNG fleet. The BEB fuel economy is approximately five times that of the CNG buses as theyare currently operated by Foothill Transit. Differences in duty cycle, such as number of stops andaverage speed, will impact the fuel economy of the fleets. Note that the 40‐ft CNG buses areheavier than the 35‐ft BEBs, which can also affect fuel economy.NREL 8
Results Summary (continued)Fuel cost: Since first placing its BEBs in service, Foothill Transit has been subject to three differentelectricity rate structures. The agency is currently on the TOU‐EV‐8 rate schedule with its utilityprovider, Southern California Edison. Based on energy purchased in the first half of 2020, the BEBfleet had a fuel cost of 0.44/mi (at 0.174/kWh) and the CNG fleet had a fuel cost of 0.31/mi(at 1.07/gge). The cost per unit of energy/fuel is the average for the data period of January2020–June 2020.NREL 9
Results Summary (continued)Maintenance cost: Cost to maintain the buses in the first half of 2020 was 1.37/mi for the BEB35FC buses, 0.84/mi for the BEB 40FC buses, and 0.51/mi for the CNG buses. This is a significantincrease from what was reported in the last data period. Several factors contributed to the highercost: Reduced service for the COVID‐19 pandemic results in lower mileage accumulation for all threefleets. During this time, any maintenance cost is amplified by the low number of miles. Actuallabor hours and parts costs were lower than the previous period for the BEB 35FC fleet, butthe mileage was 2.6 times less, resulting in a cost per mile that is 1.6 times higher. On‐site contractor staff handle all maintenance. For some work orders, increased labor hourswere needed to troubleshoot and repair issues. During the data period, maintenance staffspent labor hours troubleshooting issues with the high‐voltage batteries on several buses,although Proterra eventually handled the actual repair. Other issues resulting in higher laborhours were not due to advanced technology components. For one bus, the labor hours werehigh to replace a windshield wiper motor because the dash had to be removed to reach themotor.NREL 10
Results Summary (continued) Foothill Transit continues to have issues with the low‐voltage batteries. NREL updated thelow‐voltage battery data analysis for all three bus fleets. The BEBs averaged 11.6replacements per bus at approximately 10,500 miles between replacement. The CNG busesaveraged 2.6 replacements per bus at more than 121,000 miles between replacement. Oneissue is that the accessories (e.g., farebox, cameras) continually draw power from thesebatteries. The CNG buses are equipped with an auto shutoff for the accessories; the BEBsare not. Proterra reports that it has developed an auto‐shutoff feature for its new designs.The manufacturer will provide a retrofit for BEBs currently in service. Because this issue isnot related to the BEB technology, NREL has provided the costs with and without the low‐voltage battery replacement costs.o Total maintenance cost without low‐voltage battery costs was 1.18/mi for the BEB35FC buses, 0.65/mi for the BEB 40FC buses, and 0.47/mi for the CNG buses.Future analysis: NREL will continue to collect data on the two existing BEB fleets in comparison tothe CNG baseline fleet through the end of 2020.NREL 11
Evaluation Buses: SpecificationsVehicle SystemNumber of busesBus manufacturer/modelModel yearBus purchase costaLength/width/heightGVWRb/curb weightWheelbasePassenger capacityMotor or engineRated powerEnergy storage (BEB)Fuel capacity (CNG)AccessoriesEmissions equipmentTransmission/retarderBEB 35FC12Proterra/BE352014 904,49035 ft/102 in./129 in.37,320 lb/27,680 lbBEB 40FC2Proterra/Catalyst Fast Charge2016 879,84542.5 ft/102 in./134 in.39,050 lb/27,000 lbCNG8NABI/BRT‐07.032014 575,00042 ft/102 in./137 in.42,540 lb/33,880 lb237 in.296 in.308 in.35 seats, 2 wheelchair positions, 18standeesPermanent magnet, UQM, PP22040 seats, 2 wheelchair positions,18 standeesPermanent magnet, UQM, PP22038 seats, 2 wheelchair positions, 10standeesCNG engine, Cummins, 8.9 ISL G220 kW peak (295 hp)220 kW peak (295 hp)280 hp @ 2,200 rpmLithium‐titanate batteries,Altairnano, TerraVolt 368 volts, 88kWh total energyElectricN/ARegenerative brakingLithium‐titanate batteries,Toshiba, TerraVolt 331 volts, 106kWh total energyElectricN/ARegenerative braking7 Type IV cylinders,22,204 scfc at 3,600 psidMechanical3‐way catalystN/AaIncludes amenities such as painting of bus and livery, surveillance system, public address (PA) system, radio, and safety vision monitorGross vehicle weight ratingc Standard cubic feetd Pounds per square inchbNREL 12
Evaluation BusesBEB 35FCBEB 40FCPhoto by Leslie Eudy, NRELPhoto courtesy of Foothill TransitCNGPhoto by Leslie Eudy, NRELNREL 13
Infrastructure DescriptionFoothill worked with the City of Pomona to establish an on‐route fast charging station at the PTC. The stationfeatures two Eaton 500‐kW chargers in a climate‐controlled building with charge heads (right photo) positionedon either side (left photo). The two chargers operate as separate units with a dedicated control system for each.A common communication network serves both units with sensors to detect which charge head a bus isapproaching to enable proper bus‐to‐charger communication for docking. The system is designed to fully chargea bus in under 10 minutes. For Line 291, typical charge times are around 7 minutes, including docking time.Foothill Transit built a layover time into the schedule to allow enough time for charging. Software controlsprevent charging from surpassing the kilowatt‐hour limit that results in high demand charges.Photos by Leslie Eudy, NRELNREL 14
Data Summary: Total from Start of ServiceData ItemNumber of busesData periodNumber of monthsTotal mileage in data periodAverage monthly mileage per busAvailability (85% is target)Fuel consumption for BEBs (kWh/mile) or fuel economy for CNG buses (mpgge)Fuel economy (mpdge)Average speed, including stops (mph)Miles between road call (MBRCa)—busMBRCa—propulsion system onlyMBRCa—energy storage system (ESS) onlyTotal maintenance cost ( /mile)bTotal maintenance cost without low‐voltage battery costs ( /mile)cMaintenance cost—propulsion system only ( /mile)Propulsion system maintenance cost without low‐voltage battery costs ( /mile) cBEB 710.65,76814,142194,1420.4760.4180.1680.110BEB 6,929—0.3050.2950.1270.117aMBRC data cumulative from the clean point of April 2014 through end of current data periodorder maintenance costc See issue with the low‐voltage batteries explained on slide 56b WorkNREL 15
Data Summary: Jan.–June 2020Data ItemNumber of busesData periodNumber of monthsTotal mileage in data periodAverage monthly mileage per busAvailability (85% is target)Fuel consumption for BEBs (kWh/mile) or fuel economy for CNG buses (mpgge)Fuel economy (mpdge)Average speed, including stops (mph)MBRCa—busMBRCa—propulsion system onlyMBRCa—ESS onlyTotal maintenance cost ( /mile)bTotal maintenance cost without low‐voltage battery costs ( /mile)cMaintenance cost—propulsion system only ( /mile)Propulsion system maintenance cost without low‐voltage battery costs ( /mile) cBEB 5,76814,142194,1421.3721.1790.5890.396BEB 9—0.5070.4740.2490.216aMBRC data cumulative from the clean point of April 2014 through end of current data periodorder maintenance costc See issue with the low‐voltage batteries explained on slide 56b WorkNREL 16
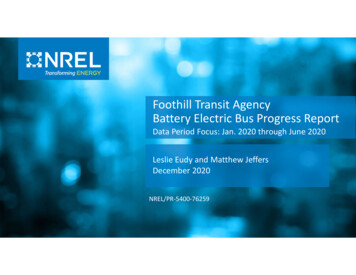
Route AssignmentsFoothill Transit uses the BEB 35FC buses to fully electrify Line 291, whichrequires seven buses during peak hours. Line 291 is a 16.1‐mile routebetween La Verne and Pomona that loops through the PTC in bothdirections. The average speed for the route is 10.6 mph. The agencyadjusted the schedule to accommodate time for charging the buses. Theadditional buses are used as spares to allow for maintenance downtimeand as fill‐in buses for other appropriate routes that go through the PTC,such as Line 855. The two 40‐ft buses (BEB 40FC) are also used on theseroutes. In October 2017, Line 855 was eliminated. From that period on,the buses were operated only on Line 291.The CNG buses are randomly dispatched on all routes out of PomonaOperations, including commuter routes. Average speed for PomonaOperations is 17.6 mph.Image courtesy of Foothill TransitNREL 17
BEB Fleet Total Miles Combined totals are shown for 12 BEB 35FC buses and 2 BEB 40FC buses.NREL 18
Fleet Average Monthly Miles by Bus: Jan.–June 2020BusMonthsAverage MonthlyMileageBus IDMiles200420052006Bus removed from service Jan. 12012201320142015BEB 35FC 1,0607346864431,809BEB 40FC Fleet13,510121,126Bus IDMilesBusMonthsAverage MonthlyMileage22002201220222032204220522062207CNG 4,1364,1043,692The average monthly operating mileage per bus for theCNG buses is 3–5 times that of the BEB fleets asoperated by Foothill Transit. The mileage for the BEBs ismuch lower than the mileage accumulation fromprevious periods for several reasons: Reduced service due to the COVID‐19 pandemic Issues with the BEBs.NREL 19
Fleet Average Monthly Miles Service for all buses was reduced in April through June 2020 due to the COVID‐19 pandemicAverage miles listed for each fleet on the chart is for the entire data periodCompared to the fleet averages, 2020 mileage was reduced by approximately 66% for BEB 35FC, 37% forNRELBEB 40FC, and 20% for the CNG fleet. 20
Availability AnalysisAvailability, which is a measure of reliability, is presented as the percentage of days the buses areavailable out of days that the buses are planned for passenger service. Buses available for servicemay have been used in passenger service, training, or special events, or they may have beenavailable but not used. Buses unavailable for service may have had issues with the propulsionsystem (energy storage system, electric drive system), general bus maintenance, or issues withthe charging system. Accidents are removed from the data—the bus is considered “not planned”during the repair time.The data presented are based on availability for morning pull‐out and don’t necessarily reflect all‐day availability. Transit agencies typically have a target of 85% availability for their fleets to allowfor time to handle scheduled and unscheduled maintenance. The Foothill Transit buses areplanned to operate every day, including weekends. For Foothill Transit, the source for availabilitydata is garage activity sheets for Pomona Operations, which list each bus that is not available formorning pull‐out and provide a general reason for unavailability. These activity sheets are for thefacility as a whole and include the BEBs as well as the CNG buses. The garage activity sheets aretypically available for weekdays.NREL presents availability as a monthly average trend and as overall availability. Unavailable timeis separated into several categories to show the primary reason for downtime.NREL 21
Availability Summary: Jan.–June 2020BEB 35FC(# days)BEB 35FC(%)BEB 40FC(# days)BEB 40FC(%)CNG(# days)CNG(%)1,287—234—930—Days .39310ESS20515.9219.0——CNG engine————40.4Electric drive181.400.0——Charging issues60.500.0——Preventive maintenance (PM)20.200.080.9General bus 7374.0CategoryPlanned work days The per‐bus availability for the BEBs ranged from a low of 15% to a high of 97% during the data periodBus 2004 was removed from service in early January and is not included in the analysisThe BEBs experienced issues with the ESS during the data period, accounting for 15.9% of the time for theBEB 35FC and 9% of the time for the BEB 40FC busesGeneral bus maintenance includes everything that doesn’t fall into one of the other categories.NREL 22
Monthly Availability: BEB 35FC Fleet The green line tracks the average monthly availability for the BEB 35FC fleetThe stacked bars provide the number of unavailable days by bus each month, separated by six categoriesDowntime was attributed to low‐voltage electrical, transmission, and traction motorNRELESS issues included time for troubleshooting high‐voltage electrical. 23
Monthly Availability: BEB 40FC Fleet The blue line tracks the average monthly availability for the BEB 40FC fleetThe stacked bars provide the number of unavailable days by bus each month, separated by six categoriesESS issues were primarily labor for troubleshooting high‐voltage electricalNRELDowntime included transmission issues and low‐voltage electrical. 24
Monthly Availability: CNG Fleet The blue line tracks the average monthly availability for the CNG fleetThe stacked bars provide the number of unavailable days by bus each month, separated by four categoriesOne bus experienced transmission issues that kept it from service in May 2020.NREL 25
Overall Fleet Availability: Full Data PeriodNREL 26
Overall Fleet Availability: Jan.–June 2020NREL 27
Energy Consumption/Fuel Economy AnalysisProterra records and stores data—including total electrical energy consumed (kWh), number ofcharges, and miles driven—on each of the buses. These data were provided to NREL for calculatingefficiency of the buses in kilowatt‐hours per mile. Foothill Transit’s CNG buses are typically fueledonce each day. Foothill Transit provided individual fueling records for the CNG buses. CNG istypically dispensed in units of gasoline gallon equivalent (gge).To compare the BEBs to the baseline buses, NREL converted the electrical energy from kWh todiesel gallon equivalent (dge) and converted the CNG fuel energy from gge to dge using thefollowing conversion factors:Energy content of fuel (Alternative Fuels Data Center: https://afdc.energy.gov/fuels/properties) Electricity: 3,414 Btua/kWh CNG: 112,114 Btu/gge (LHVb) Diesel: 128,488 Btu/dge (LHV)Conversion factors Electrical energy to dge: 37.64 kWh/dge CNG fuel energy to dge: 1.146 gge/dgeabBritish thermal unitsLower heating valueNREL 28
Fuel Consumption/Fuel Economy: Jan.–June 2020Bus BEB 35FCFleet20162017BEB .Bus removed from service Jan. ilesEnergya(kWh)kWh/miBus 052220421,440220523,822220623,4512207CNG Fleet 943.94 The BEB fuel economy is approximately five times theCNG fuel economy, as operated on current routes Differences in duty cycle, such as number of stops andaverage speed, will impact the fuel economy of thefleets.Total energy consumed by the bus does not include losses during chargingNREL 29
Fleet Average Monthly Fuel EconomyApril 2020 datapoints removeddue to pandemicslowdownEnergy data unavailableEnergy data unavailableFleetBEB 35FCBEB 40FCCNGOverallkWh/mi, mpggempdge2.1517.472.0917.993.754.30Jan.–June 2020kWh/mi, mpggempdge1.9119.691.9219.613.443.94NREL 30
Monthly Electric Utility Costs /kWh 550.186.840.186.66Summer Avg(June–Sep.)0.217.85Winter Avg(Oct.–May)0.166.07NREL 31
Monthly Electric Utility CostsNREL 32
Monthly Average Fuel Price Electricity prices vary seasonally; CNG prices are consistent throughout the data period, but CNG pricesincreased in August 2018 and December 2018 due to temporary disruptions in regional CNG supplyCNG cost includes price of fuel, transmission, and operations and maintenance cost for stationOn average, electricity cost is approximately six times the cost of CNG.NREL 33
Monthly Average Fuel Cost Per Mile Fuel cost per mile for the BEBs tracks with the ambient temperature when summer electric rates are higherand efficiency is lower due to air‐conditioning useBaseline CNG bus cost per mile spikes when the CNG cost is higherFleet mileage for April 2020 and June 2020 was insufficient to display fuel cost/mi.NREL 34
Fuel Cost Per MileDuring the first half of 2020, Foothill Transit paid an average of 1.07/gge ( 1.22/dge) for CNG.The average cost of electricity during the first half of 2020 was 0.173/kWh ( 6.53/dge). Thetable provides the cost per mile for the BEBs and CNG buses as operated by the fleet, for both thecurrent data period and since the start of service. Overall, the average CNG fuel cost was 0.27/mi and average fuel cost for the BEBs was 0.45/mi.The operating duty cycle of a bus has a significant effect on fuel economy and therefore cost. TheBEB and CNG fleets are currently operated on different routes with different average speeds,which should be considered when comparing fuel costs.BEB 35FCBEB 40FCCNGAverageService 4.30Total from4/2014Fuel /mi0.450.450.272020 DataPeriodFuel /mi0.440.440.31NREL 35
Road Call AnalysisA road call, or revenue vehicle system failure, is defined as a failure of an in‐service bus thatcauses the bus to be replaced on route or causes a significant delay in schedule. If the problemwith the bus can be repaired during a layover and the schedule is kept, it is not considered a roadcall. The analysis described here includes only road calls that were caused by “chargeable”failures. Chargeable road calls include systems that can physically disable the bus from operatingon route, such as interlocks (doors, air system), engine, or things that are deemed to be safetyissues if operation of the bus continues. They do not include road calls for things such asproblems with radios, fareboxes, or destination signs.The transit industry measures reliability as mean distance between failures, also documented asMBRC. NREL tracks MBRC by total bus road calls, propulsion‐related road calls, and ESS‐relatedroad calls (for electric buses). Total bus road calls include all chargeable road calls. Propulsion‐related road calls are a subset of total road calls and include all road calls due to propulsion‐related systems including the battery system (or engine for a conventional bus), electric drive,fuel, exhaust, air intake, cooling, non‐lighting electrical, and transmission systems. The ESS‐related road calls—a subset of the propulsion‐related road calls—and MBRC are included for theBEBs.NREL 36
Cumulative MBRC The upper chart shows cumulative MBRC for all chargeable road callsThe lower chart shows MBRC for propulsion‐related road callsThe ESS‐related MBRC for the BEB 35FC fleet is 194,142The ESS‐related MBRC for the BEB 40FC fleet is 150,713.NREL 37
Maintenance AnalysisNREL collects all work orders for the evaluation buses to calculate maintenance cost per mile. Costs foraccident‐related repairs, which are extremely variable from bus to bus, were eliminated from theanalysis. Warranty costs are not included in the cost‐per‐mile calculations because those costs arecovered in the capital cost of the buses. For consistency, NREL uses a constant labor rate of 50 perhour. This does not reflect an average rate for Foothill Transit. Cost per mile is calculated as follows:Cost per mile [(labor hours 50) parts cost] / mileageNREL calculates total cost per mile, scheduled maintenance cost per mile, and unscheduledmaintenance cost per mile. NREL also categorizes maintenance cost by system to provide insight intowhat systems have the most costs for each technology. The work orders are coded using VehicleMaintenance Reporting Standards (VMRS) developed by the American Trucking Association to aid theindustry in tracking equipment and maintenance using a common standard.The propulsion system costs are of particular interest. Propulsion‐related vehicle systems include theexhaust, fuel, engine, battery modules, electric propulsion, air intake, cooling, non‐lighting electrical,and transmission systems. These systems have been separated to highlight maintenance costs mostdirectly affected by the different advanced propulsion systems for the buses.NREL 38
Maintenance Analysis Results: Jan.–June 2020Bus IDScheduled Unscheduled TotalCostCostCost( /mi)( /mi)( /mi)Bus removed from service Jan. 2020782.7255.570.060.670.731,789.89 86.470.072.332.391,440.85 43.020.020.620.642,234.62 156.130.061.962.01702.78 100.580.040.961.003,351.16 84.240.041.361.41857.1628.530.151.141.291,606.10 34.790.001.941.941,852.64 102.720.083.623.713,733.34 80.940.101.121.2234.42101.990.051.121.17Mileage Parts ( 120144,4032015BEB 35FC45,286 18,385.68 875.0Fleet2,658 1,506.56 122.26201610,851 1,901.1035.22017BEB 40FC13,510 3,407.66 40.800.84Bus ID MileageParts ( 0222032204220522062207CNGFleetScheduled Unscheduled TotalCostCostCost( /mi)( /mi)( 0.110.390.51BEB issues included: Low‐voltage battery replacement High‐voltage batteries Traction motor replaced Transmission Wiper motor Air systemNREL 39
Monthly Scheduled and Unscheduled Maintenance Cost:BEB 35FC Fleet The warranty period has ended, and transit staff are handling all the maintenance workIssues with the low‐voltage batteries continue to result in increasing costsCost per mile for April, May, and June 2020 are artificially high due to low mileage accumulation during reduced service.These costs are not representative of the overall costs and have been removed from the chart. The data are included inNRELthe analysis totals. 40
Monthly Scheduled and Unscheduled Maintenance Cost:BEB 40FC Fleet Issues with the low‐voltage batteries resulted in costs that were higher than expectedBecause the fleet cons
Foothill Transit's administrative office is located in West Covina, California. Foothill Transit is governed by a joint powers authority of 22 member cities and the County of Los Angeles. Foothill Transit operates 36 local and express routes, including commuter runs to downtown Los Angeles.


![Smarter Battery Crack [2022-Latest]](/img/13/eliamari.jpg)