Transcription
Foothill Transit AgencyBattery Electric Bus Progress ReportData Period Focus: Jul. 2018 through Dec. 2018Leslie Eudy and Matthew JeffersMay 2019NREL/PR-5400-72209
Table of ContentsIntroduction . 3Results Summary . 4Fleet Profile . 10Evaluation Buses Specification . 11Infrastructure Description . 13Data Summary . .14Route Assignments . .16Fleet Mileage Accumulation . 17Availability Analysis . 20Fuel Economy and Cost Analysis . 27Reliability—Miles Between Roadcall . 33Maintenance Cost Analysis 35Contacts . 51Acronyms and Abbreviations. 52Appendix: Fleet Summary Statistics . . 54NREL 2
IntroductionThis report summarizes results of a battery electric bus (BEB) evaluation at Foothill Transit,located in the San Gabriel Valley area of Los Angeles. Foothill Transit is collaborating with theCalifornia Air Resources Board and the U.S. Department of Energy’s National Renewable EnergyLaboratory (NREL) to evaluate the buses in revenue service. The focus of this evaluation is tocompare the performance and the operating costs of the BEBs to that of conventional technologybuses and to track progress over time. Previous reports documented results from April 2014through June 2018.1,2,3,4 This report extends the data analysis through the end of 2018. The dataperiod focus of this report is July 2018–December 2018. NREL plans to publish progress reportson the Foothill Transit fleet every 6 months through 2020.Foothill Transit Battery Electric Bus Demonstration Results, NREL/TP-5400-65274, ll Transit Battery Electric Bus Demonstration Results: Second Report, NREL/TP-5400-67698, https://www.nrel.gov/docs/fy17osti/67698.pdf3 Foothill Transit Agency Battery Electric Bus Progress Report: Data Period Focus: Jan. 2017 through Dec. 2017, sti/71292.pdf4 Foothill Transit Agency Battery Electric Bus Progress Report: Data Period Focus: Jan. 2018 through Jun. 2018, y19osti/72207.pdf12 3
Results SummaryBus fleets: This evaluation includes 12 Proterra 35-ft fast charge buses (BEB 35FC), two Proterra40-ft Catalyst fast charge buses (BEB 40FC), and eight NABI 42-ft compressed natural gas (CNG)buses.Bus use: The BEBs are operated on a 16-mile route (Line 291) that circles through the PomonaTransit Center (PTC) for charging. The average speed for this route is 10.6 mph. The CNG busesare randomly dispatched on all routes out of the operations facility, including higher speedcommuter routes. The average speed for the CNG buses is 17.6 mph. This difference in duty cyclehas an effect on the comparison of mileage, fuel economy, and costs per mile between fleets.Availability: Availability in the second half of 2018 was 75.7% for the BEB 35FC buses, 75.0% forthe BEB 40FC buses, and 90.1% for the CNG buses. The majority of unavailable time for the BEBswas due to general bus-related problems. Issues with the low-voltage batteries affected BEBavailability. Other downtime resulted from issues with components such as transmission, aircompressor, DC-DC converter, air conditioning, and the energy storage system (ESS).NREL 4
Results Summary (continued)Fuel economy: From the beginning of the evaluation, NREL has collected miles and energy usefrom the Proterra data system on each bus. Over the last year, Proterra has been transitioning itsdata system to a new system to increase capability. During this transition, some data have beenunavailable. In early 2018, Foothill Transit installed individual data loggers on each of its BEBs.NREL is using this data for calculating the fuel economy for the 35-ft buses. The data logger datais not yet available for the BEB 40-ft buses.BEB efficiency in the second half of 2018 was 2.18 kWh/mi (17.29 mpdge) for the BEB 35FC fleetand 3.63 mpgge (4.16 mpdge) for the CNG bus fleet. Because of the unavailable data for the BEB40FC buses, no fuel economy can be calculated for the most recent 6-month data period. The BEBfuel economy is approximately 4 times higher than that of the CNG buses as they are currentlyoperated by Foothill Transit. NREL collected data on CNG buses operating on Line 291 thatshowed an average fuel economy of 2.09 mpdge (see previous report for details5). The BEB fuelefficiency is 8 times higher than that of the CNG buses in the same service.5Foothill Transit Battery Electric Bus Demonstration Results: Second Report, NREL/TP-5400-67698, https://www.nrel.gov/docs/fy17osti/67698.pdfNREL 5
Results Summary (continued)Fuel cost: Based on energy purchased in the second half of 2018, the BEB fleet had a fuel cost of 0.46/mi (at 0.20/kWh) and the CNG fleet had a fuel cost of 0.28/mi (at 1.24/gge). The costper unit of energy/fuel is the average for the data period of July 2018–December 2018. Becausethis 6-month data period includes more summer months when the electric rates are higher, theaverage cost per kWh is higher than the 6-month average from the previous report. For 2 out ofthe 6 months, the CNG cost increased due to disruptions in regional CNG supply, resulting in ahigher average cost per gge than previously reported. To compare cost between buses in thesame service, NREL estimated the cost per mile for the CNG buses if operated only on Line 291.An earlier analysis using data loggers to characterize the CNG bus operation on Line 291 resultedin a lower fuel economy of 2.09 mpdge.6 This lower fuel economy would increase the cost of theCNG buses to an overall average of 0.66/mi, which is slightly higher than the cost of the BEBfleet.6Foothill Transit Battery Electric Bus Demonstration Results: Second Report, NREL/TP-5400-67698, https://www.nrel.gov/docs/fy17osti/67698.pdfNREL 6
Results Summary (continued)Maintenance cost: Cost to maintain the buses in the second half of 2018 was 0.78/mi for the BEB35FC buses, 0.74/mi for the BEB 40FC buses, and 0.46/mi for the CNG buses. The BEB 35FC buscost has increased over what was reported previously. Several factors contributed to the high costfor the BEBs: The BEB 35FC buses are now past the warranty period for the majority of components,resulting in higher parts costs, such as a DC-DC converter at 12,000 and a bus air compressorat 8,000. All maintenance has been transitioned to on-site contractor staff, resulting in increased laborhours for training and troubleshooting as the staff become more familiar with systems andcomponents. Total unscheduled labor on the BEBs has increased from 2017 to 2018.Unscheduled labor for the BEB 35FC buses increased from 72 hours per bus in 2017 to 130hours per bus in 2018—a 45% increase. Unscheduled labor for the BEB 40FC buses increasedby 60%, from 51 hours per bus in 2017 to 128 hours per bus in 2018. By comparison, the CNGbuses’ unscheduled labor increased by only 30%—79 hours per bus in 2017 to 113 hours perbus in 2018.NREL 7
Results Summary (continued) Foothill Transit continues to have issues with the low-voltage batteries. NREL analyzed thedata for low-voltage batteries for all three bus fleets. The BEBs averaged 7.8 changeouts perbus at approximately 12,000 miles between changeout. The CNG buses averaged 1.13changeouts per bus at more than 214,000 miles between changeout. One issue is that theaccessories (farebox, cameras, etc.) continually draw power from these batteries. The CNGbuses are equipped with an auto shutoff for the accessories; the BEBs are not. Proterrareports that it is working on an auto-shutoff feature for its new designs. The manufacturerwill provide a retrofit for BEBs currently in service. Because this issue is not related to theBEB technology, NREL has provided the costs with and without the low-voltage batteryreplacement costs. Total maintenance cost without low-voltage battery costs was 0.70/mi for the BEB 35FCbuses, 0.63/mi for the BEB 40FC buses, and 0.44/mi for the CNG buses.NREL 8
Results Summary (continued)Future analysis: NREL will continue to collect data on the two existing BEB fleets in comparison tothe CNG baseline fleet, and will add data from a fleet of 40-ft Proterra Catalyst E2 extended rangebuses. The new buses will be operated out of another depot and will be charged primarilythrough overnight depot charging. NREL will select another baseline fleet from this depot forcomparison.NREL 9
Fleet ProfileFoothill Transit serves a 327square-mile area covering theSan Gabriel and Pomona Valleyregion of Los Angeles County.Foothill Transit’s administrativeoffice is located in West Covina,California. Foothill Transit isgoverned by a Joint PowersAuthority of 22 member-citiesand the County of Los Angeles.Foothill Transit operates 36 local and express routes including commuter runs to downtown LosAngeles. The current bus fleet consists of 343 CNG buses and 16 BEBs.NREL 10
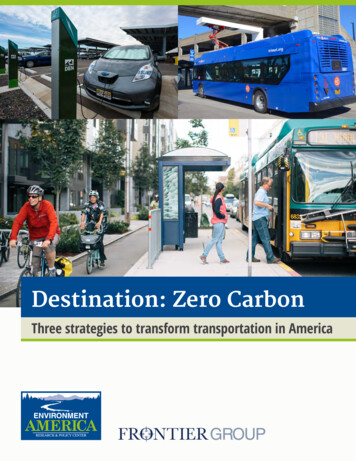
Evaluation Buses: SpecificationsVehicle SystemNumber of busesBus manufacturer/modelModel yearBus purchase costaLength/width/heightGVWR/curb weightWheelbasePassenger capacityMotor or engineRated powerEnergy storage (BEB)Fuel capacity (CNG)AccessoriesEmissions equipmentTransmission/retarderaBEB 35FC12Proterra/BE352014 904,49035 ft/102 in./129 in.37,320 lb/27,680 lbBEB 40FC2Proterra/Catalyst Fast Charge2016 879,84542.5 ft/102 in./134 in.39,050 lb/27,000 lbCNG8NABI/BRT-07.032014 575,00042 ft/102 in./137 in.42,540 lb/33,880 lb237 in.296 in.308 in.35 seats, 2 wheelchairpositions, 18 standeesPermanent magnet, UQM,PP22040 seats, 2 wheelchairpositions, 18 standeesPermanent magnet, UQM,PP22038 seats, 2 wheelchairpositions, 10 standees220 kW peak (295 hp)220 kW peak (295 hp)Lithium-titanate batteries,Altairnano, TerraVolt 368volts, 88 kWh total energyElectricN/ARegenerative brakingLithium-titanate batteries,Toshiba, TerraVolt 331 volts,106 kWh total energyElectricN/ARegenerative brakingCNG engine, Cummins, 8.9 ISL GIncludes amenities such as painting of bus and livery, surveillance system, PA system, radio, safety vision monitor.280 hp @ 2,200 rpm7 Type IV cylinders,22,204 scf at 3,600 psiMechanical3-way catalystN/ANREL 11
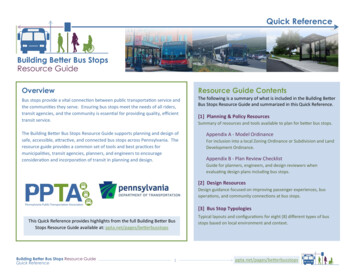
Evaluation BusesBEB 40FCBEB 35FCPhoto by Leslie Eudy, NRELCNGPhoto courtesy of Foothill TransitPhoto by Leslie Eudy, NRELNREL 12
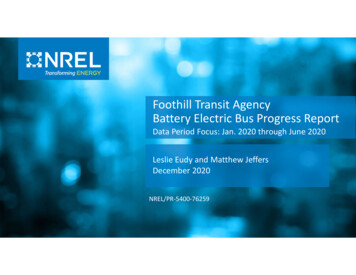
Infrastructure DescriptionFoothill worked with the City of Pomona to establish an on-route fast charging station at the PTC. The stationfeatures two Eaton chargers in a climate controlled building with charge heads (right photo) positioned on eitherside (left photo). The two chargers operate as separate units with a dedicated control system for each. Acommon communication network serves both units with sensors to detect which charge head a bus isapproaching to enable proper bus-to-charger communication for docking. The system is designed to fully chargea bus in under 10 minutes. For Foothill’s Line 291, typical charge times are around 7 minutes including dockingtime. Foothill built a layover time into the schedule to allow enough time for charging. Software controls preventcharging from surpassing the kWh limit that results in high demand charges.Photos by Leslie Eudy, NRELNREL 13
Data Summary: Total from Start of ServiceData ItemNumber of busesData periodNumber of monthsTotal mileage in data periodAverage odometerAverage monthly mileage per busAvailability (85% is target)Fuel economy (kWh/mile or mpggea)Fuel economy (mpdgeb)Average speed, including stops (mph)Miles between roadcalls (MBRCc)—busMBRCc—propulsion system onlyMBRCc—ESSd onlyTotal maintenance cost ( /mile)eTotal maintenance cost without low-voltage battery costs ( /mile)fMaintenance cost—propulsion system only ( /mile)BEB 3210.605,70615,418241,5530.390.340.11BEB 260.260.100.060.070.09Propulsion system maintenance cost without low-voltage battery costs ( /mile) fMiles per gasoline gallon equivalentMiles per diesel gallon equivalentc MBRC data cumulative from the clean point of April 2014 through end of current data periodabd Energystorage systemorder maintenance costf See issue with the low-voltage batteries explained on slide 50e WorkNREL 14
Data Summary: Jul.–Dec. 2018Data ItemNumber of busesData periodNumber of monthsTotal mileage in data periodAverage odometerAverage monthly mileage per busAvailability (85% is target)Fuel economy (kWh/mile or mpggea)Fuel economy (mpdgeb)Average speed, including stops (mph)Miles between roadcalls (MBRCc)—busMBRCc—propulsion system onlyMBRCc—ESSd onlyTotal maintenance cost ( /mile)eTotal maintenance cost without low-voltage battery costs ( /mile)fMaintenance cost—propulsion system only ( /mile)BEB 0.605,70615,418241,5530.780.700.32BEB 250.240.300.23Propulsion system maintenance cost without low-voltage battery costs ( /mile) fMiles per gasoline gallon equivalentMiles per diesel gallon equivalentc MBRC data cumulative from the clean point of April 2014 through end of current data periodabd Energystorage systemorder maintenance costf See issue with the low-voltage batteries explained on slide 50e WorkNREL 15
Route AssignmentsFoothill Transit uses the BEB 35FC buses to fully electrify Line 291, whichrequires seven buses during peak hours. Line 291 is a 16.1-mile routebetween La Verne and Pomona that loops through the PTC in bothdirections. The average speed for the route is 10.6 mph. The agencyadjusted the schedule to accommodate time for charging the buses. Theadditional buses are used as spares to allow for maintenance downtimeand also as fill-in buses for other appropriate routes that go through thePTC, such as Line 855. The two 40-ft buses (BEB 40FC) are also used onthese routes. In October 2017, Line 855 was eliminated. From thatperiod on, the buses were operated only on Line 291.The CNG buses are randomly dispatched on all routes out of PomonaOperations including commuter routes. Average speed for PomonaOperations as a whole is 17.6 mph.Image courtesy of Foothill TransitNREL 16
BEB Fleet Total Miles Combined totals for 12 BEB 35FC buses and two BEB 40FC busesNREL 17
Fleet Average Monthly Miles by Bus: Jul.–Dec. 2018Bus ge 009201020112012201320142015BEB 35FC 1,9172,3341,8831,4242,2662,0832,0181,4361,909BEB 40FC Total20,067121,672Bus IDMilesMonthsAverage MonthlyMileage22002201220222032204220522062207CNG 5,2264,9054,729The average monthly operating mileage per busfor the BEBs is less than half that of the CNGbuses. This is a result of the planned operation ofthe buses, in which the CNG buses accumulatemiles faster than the BEBs do, and does notindicate a specific limitation of the technology.NREL 18
Fleet Average Monthly MilesNREL 19
Availability AnalysisAvailability, which is a measure of reliability, is presented as the percentage of days the buses areactually available out of days that the buses are planned for passenger service. Buses available forservice may have been used in passenger service, training, or special events, or they may havebeen available but just not used. Buses unavailable for service may have had issues with thepropulsion system (energy storage system, electric drive system), general bus maintenance, orissues with the charging system. Accidents are removed from the data—the bus is considered“not planned” during the repair time.The data presented are based on availability for morning pull-out and don’t necessarily reflect allday availability. Transit agencies typically have a target of 85% availability for their fleets to allowfor time to handle scheduled and unscheduled maintenance. For the Foothill Transit fleet, thebuses are planned to operate every day, including weekends. For Foothill Transit, the source foravailability data is garage activity sheets for the Pomona Operations, which list each bus that isnot available for morning pull-out and provide a general reason for unavailability. These activitysheets are for the facility as a whole and include the BEBs as well as the CNG buses. The garageactivity sheets are typically available for weekdays.NREL presents availability as a monthly average trend and as overall availability. Unavailable timeis separated into several categories to show the primary reason for downtime.NREL 20
Availability Summary: Jul.–Dec. 2018CategoryPlanned work days BEB 35FC(# Days)BEB 35FC(%)1,286BEB 40FC(# Days)BEB 40FC(%)216CNG(# Days)CNG(%)861Days 25.0859.9ESS181.410.5——CNG engine————657.5Electric drive362.8209.3——Charging issues50.400.0——Preventive maintenance60.510.560.7General bus 10.1The per-bus availability for the BEBs ranged from a low of 57% to a high of 91%.The majority of unavailable time for the BEBs was attributed to general bus maintenance.Issues with the low-voltage batteries lowered availability for the BEBs (29% of general bus maintenance days forthe 35FC BEBs and 47% of general bus maintenance days for the 40FC BEBs).The majority of unavailable time for the CNG buses was attributed to engine issues.General bus maintenance includes everything that doesn’t fall into one of the other categories.NREL 21
Monthly Availability: BEB 35FC Fleet The green line tracks the average monthly availability for the BEB 35FC fleet.The stacked bars provide the number of unavailable days by bus each month separated by six categories.Low-voltage batteries fall into the general Bus Maintenance category (green bars) and make up 29% of generalbus maintenance unavailable days.NREL 22
Monthly Availability: BEB 40FC Fleet The blue line tracks the average monthly availability for the BEB 40FC fleet.The stacked bars provide the number of unavailable days by bus each month separated by six categories.Issues with the low-voltage battery during August 2017 lowered the availability (47% of general busmaintenance unavailable days). December availability issues were due to a traction motor inverter failure. NREL 23
Monthly Availability: CNG Fleet The blue line tracks the average monthly availability for the CNG fleet.The stacked bars provide the number of unavailable days by bus each month separated by four categories.NREL 24
Overall Fleet Availability: Full Data PeriodNREL 25
Overall Fleet Availability: Jul.–Dec. 2018NREL 26
Fuel Economy AnalysisProterra records and stores data—including total electrical energy used (kWh), number of charges,and miles driven—on each of the buses. These data were provided to NREL for calculatingefficiency of the buses in kWh per mile. Foothill Transit’s CNG buses are typically fueled once eachday. Foothill Transit provided individual fueling records for the CNG buses. CNG is typically trackedin units of gasoline gallon equivalent (gge).To compare the BEBs to the baseline buses, NREL converted the electrical energy from kWh todiesel gallon equivalent (dge) and converted the CNG fuel energy from gge to dge using thefollowing conversion factors.Energy content of fuel (DOE Alternative Fuels Data Center: https://afdc.energy.gov/fuels/properties) Electricity: 3,414 Btu/kWh CNG: 112,114 Btu/gge (LHV) Diesel: 128,488 Btu/dge (LHV)Conversion factors Electrical energy to dge: 37.64 kWh/dge CNG fuel energy to dge: 1.146 gge/dgeBtu: British thermal units; LHV: lower heating valueNREL 27
Fuel Economy by Bus: Jul.–Dec. 2018aBus 12012201320142015BEB 35FCTotal20162017BEB 1617.5916.07Bus ID22002201220222032204220522062207CNG TotalMilesCNG(gge)24,701 7,048.020,665 6,169.925,510 6,674.220,145 5,332.422,887 6,256.725,585 7,018.025,645 6,967.522,640 6,307.3187,778 ieselFuelGallon economyEquiv. 6.14.16 The BEB fuel economy is 4 times higher than thatof the CNG buses, as operated on current routes. Previous testing showed the CNG buses had a fueleconomy around 2.09 mpdge on Line 291, whichis 8 times lower than that of the BEBs. Insufficient energy data was received for the BEB40FC fleet to calculate 2018 fuel economy.Total energy consumed by the bus, does not include losses during chargingNREL 28
Fleet Average Monthly Fuel EconomyJan-Feb energy data unavailable2018 energy data unavailableFleetBEB 35FCBEB 40FCCNGOverallkWh/mi, mpggempdge2.1717.322.2216.983.844.40Jul.–Dec. 2018kWh/mi, mpggempdge2.1817.29——3.634.16NREL 29
Monthly Electric Utility Costs Data are based on utility billing periods, not calendar monthsSeasonal rates apply: average summer rate (Jun–Sep): 0.21/kWh; average winter rate (Oct–May): 0.16/kWhAverage rate under TOU-GS-1-A rate structure: 0.17/kWh; average rate under TOU-EV-4 rate structure: 0.18/kWhAverage rate for 2018 full calendar year: 0.19/kWhNREL 30
Monthly Average Fuel Price Electricity prices vary seasonally; CNG prices are consistent throughout the data period, but CNG pricesincreased in August 2018 and December 2018 due to temporary disruptions in regional CNG supply.CNG cost includes price of fuel, transmission, and operations and maintenance cost for station.On average, electricity cost is more than 6 times the cost of CNG.NREL 31
Fuel Cost Per MileThe operating duty cycle of a bus has a significant effect on fuel economy and therefore cost.Earlier in the evaluation, NREL collected drive cycle data on a selection of CNG buses that wereoperated on a variety of Foothill Transit routes including Line 291. On Line 291, the average fueleconomy for the CNG buses was 2.09 mpdge.During the second half of 2018, Foothill Transit paid an average of 1.24/gge ( 1.42/dge) for CNG.The average cost of electricity during the second half of 2018 was 0.20/kWh ( 7.35/dge). Thetable provides the cost per mile for the BEBs and CNG buses as used by the fleet and estimatesthe cost per mile of the CNG buses if they were only operated on Line 291. The lower fueleconomy would increase the CNG fuel cost to an average of 0.52/mi, which is slightly higherthan that of the BEBs.BEB 35FCBEB 40FCCNGCNG on Line 291AverageService 6.984.402.09Overall /miData Period /mi0.450.450.230.520.460.460.280.66NREL 32
Roadcall AnalysisA roadcall, or revenue vehicle system failure, is defined as a failure of an in-service bus thatcauses the bus to be replaced on route or causes a significant delay in schedule. If the problemwith the bus can be repaired during a layover and the schedule is kept, it is not considered aroadcall. The analysis described here includes only roadcalls that were caused by “chargeable”failures. Chargeable roadcalls include systems that can physically disable the bus from operatingon route, such as interlocks (doors, air system), engine, or things that are deemed to be safetyissues if operation of the bus continues. They do not include roadcalls for things such as problemswith radios, fareboxes, or destination signs.The transit industry measures reliability as mean distance between failures, also documented asMBRC. NREL tracks MBRC by total bus roadcalls, propulsion-related roadcalls, and ESS-relatedroadcalls (for electric buses). Total bus roadcalls include all chargeable roadcalls. Propulsionrelated roadcalls is a subset of total roadcalls and includes all roadcalls due to propulsion-relatedsystems including the battery system (or engine for a conventional bus), electric drive, fuel,exhaust, air intake, cooling, non-lighting electrical, and transmission systems. The ESS-relatedroadcalls—a subset of the propulsion-related roadcalls—and MBRC are included for the BEBs.NREL 33
Cumulative MBRC The upper chart shows cumulative MBRC for all chargeable roadcalls.The lower chart shows MBRC for propulsion-related roadcalls.The ESS-related MBRC for the BEB 35FC fleet is 241,553.No ESS-related roadcalls have been recorded for the BEB 40FC fleet.NREL 34
Maintenance AnalysisNREL collects all work orders for the evaluation buses to calculate a maintenance cost per mile. Costsfor accident-related repair, which are extremely variable from bus to bus, were eliminated from theanalysis. Warranty costs are not included in the cost-per-mile calculations because those costs arecovered in the capital cost of the buses. For consistency, NREL uses a constant 50 per hour labor rate.This does not reflect an average rate for Foothill Transit. Cost per mile is calculated as follows:Cost per mile [(labor hours * 50) parts cost)] / mileageNREL calculates total cost per mile, scheduled maintenance cost per mile, and unscheduledmaintenance cost per mile. NREL also categorizes maintenance cost by system to provide insight intowhat systems have the most costs for each technology. The work orders are coded using vehiclemaintenance reporting standards (VMRS) developed by the American Trucking Association to aid theindustry in tracking equipment and maintenance using a common standard.The propulsion system costs are of particular interest. Propulsion-related vehicle systems include theexhaust, fuel, engine, battery modules, electric propulsion, air intake, cooling, non-lighting electrical,and transmission systems. These systems have been separated to highlight maintenance costs mostdirectly affected by the different advanced propulsion systems for the buses.NREL 35
Maintenance Analysis Results: Jul.–Dec. 2018Bus BEB 35FCFleet20162017BEB 40FCFleetMileageParts ( )LaborHours13,962 2,440.28 108.49,853 897.4350.410,715 3,522.45 158.511,889 2,894.4889.414,021 3,174.0990.513,395 3,713.20 145.911,505 2,930.0486.614,006 3,555.9867.811,299 15,847.70 87.68,542 2,573.9876.313,595 1,967.9690.812,498 11,764.02 113.3Scheduled Unscheduled TotalCostCostCost( /mi)( /mi)( /mi) 0.12 0.44 0.56 0.09 0.26 0.35 0.07 1.00 1.07 0.08 0.54 0.62 0.11 0.44 0.55 0.09 0.73 0.82 0.09 0.55 0.63 0.11 0.39 0.50 0.10 1.69 1.79 0.08 0.67 0.75 0.08 0.40 0.48 0.11 1.28 1.39145,281 55,281.61 1,165.7 0.09 0.69 0.788,61611,451 1,157.84 164.05 2,423.66 61.68 0.11 0.09 0.98 0.39 1.09 0.4820,067 3,581.50 0.10 0.64 0.74225.7OEM: original equipment manufacturerBus ID Mileage Parts ( 38931,07125,45728,93231,61431,35329,432 6,737.04 9,497.79 4,523.21 13,945.13 6,477.17 4,143.41 5,420.07 2120.5226,981 57,491.65 933.4Scheduled Unscheduled TotalCostCostCost( /mi)( /mi)( /mi) 0.15 0.34 0.49 0.11 0.55 0.66 0.12 0.18 0.29 0.08 0.82 0.90 0.12 0.29 0.41 0.13 0.11 0.25 0.12 0.25 0.37 0.12 0.31 0.43 0.12 0.34 0.46Reasons for cost increase over previous report(BEB 35FC: 0.71/mi, BEB 40FC: 0.29/mi): Continued issues with the low-voltage batteries Issues with the bus air compressor Replacement of one DC-DC converter Maintenance being transferred from OEM tocontractor, which results in more labor hours Warranty ended for some systems.NREL 36
Monthly Scheduled and Unscheduled MaintenanceCost: BEB 35FC Fleet The warranty period has ended and transit staff are handling most of the maintenance work.Issues with the low-voltage batteries continue to result in increasing costs.DC-DC converter replacement (part cost 12,000) increased November 2018 costs.Air compressor replacement (part cost 8,000) increased December 2018 costs.NREL 37
Monthly Scheduled and Unscheduled MaintenanceCost: BEB 40FC Fleet Issues with the low-voltage batteries resulted in costs that were higher than expected.Because the fleet consists of only two buses, the cost per mile is more sensitive to cost increases.The average odometer trend for the BEB 40FC fleet is not included at this time.NREL 38
Monthly Scheduled and Unscheduled MaintenanceCost: CNG Fleet Higher scheduled costs during July 2015, April 2016, and November 2017 are caused by multiple busesreaching the mileage target for a major preventive maintenance (PM).Unscheduled costs in the last 8 months have risen primarily due to engine issues.NREL 39
Maintenance Cost per Mile by System: Jul.–Dec. 2018SystemCab, body, and accessoriesPropulsion-relatedPMIBrakesFrame, steering, and suspension BEB 35FCPercentCost perof TotalMile ( )(%)0.317410.121160.092120.01010.0344BEB 40FCPercentCost perof TotalMile ( t perof TotalMile ( 910.0082LightingAxles, wheels, and drive shaftAir, generalTiresTowing chargesTotalTotal w/o low voltage battery 00.0040.0480.0000.4590.44021100100Color coding:Highest costS
Foothill Transit's administrative office is located in West Covina, California. Foothill Transit is governed by a Joint Powers Authority of 22 member-cities and the County of Los Angeles. Foothill Transit operates 36 local and express routes including commuter runs to downtown Los Angeles. The current bus fleet consists of 343 CNG buses and .


![Smarter Battery Crack [2022-Latest]](/img/13/eliamari.jpg)