Transcription
Destination: Zero CarbonThree strategies to transform transportation in America 1
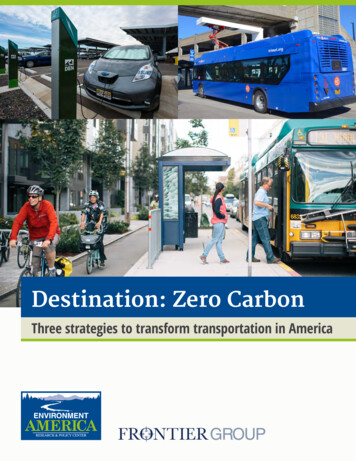
Destination:Zero CarbonThree strategies to transformtransportation in AmericaWritten by:Gideon Weissman, Frontier GroupMorgan Folger, Environment America Research & Policy CenterFebruary 2020
AcknowledgmentsEnvironment America Research & Policy Center sincerely thanks Levi Tillemann of Valence Stategic, JimmyO’Dea of the Union of Concerned Scientists, Andrew Salzberg, Loeb Fellow at the Harvard University GraduateSchool of Design, Wendy Landman of WalkBoston, and Matthew Casale of U.S. PIRG Education Fund for theirreview of drafts of this document, as well as their insights and suggestions. Thanks also to Susan Rakov, TonyDutzik, James Horrox and Elizabeth Ridlington of Frontier Group for their editorial support.Environment America Research & Policy Center thanks the William M. Backer Foundation for making this reportpossible. The authors bear responsibility for any factual errors. The recommendations are those of EnvironmentAmerica Research & Policy Center. The views expressed in this report are those of the authors and do not necessarily reflect the views of our funders or those who provided review. 2020 Environment America Research & Policy Center. Some Rights Reserved. This work is licensed under aCreative Commons Attribution Non-Commercial No Derivatives 3.0 Unported License. To view the terms of thislicense, visit ent America Research & Policy Center is a 501(c)(3) organization. We are dedicated to protecting our air,water and open spaces. We investigate problems, craft solutions, educate the public and decision-makers, and helpthe public make their voices heard in local, state and national debates over the quality of our environment and ourlives. For more information about Environment America Research & Policy Center or for additional copies of thisreport, please visit www.environmentamericacenter.org.Frontier Group provides information and ideas to help citizens build a cleaner, healthier, fairer and more democraticAmerica. We address issues that will define our nation’s course in the 21st century – from fracking to solar energy,global warming to transportation, clean water to clean elections. Our experts and writers deliver timely research andanalysis that is accessible to the public, applying insights gleaned from a variety of disciplines to arrive at new ideasfor solving pressing problems. For more information about Frontier Group, please visit www.frontiergroup.org.Layout: Alec Meltzer/meltzerdesign.netCover photo credit: (Clockwise from top left) Dennis Schroeder, National Renewable Energy Laboratory; Wikimediauser Steve Morgan (CC BY-SA 4.0); Adam Coppola Photography via flickr
Table of contentsExecutive summary. . . . . . . . . . . . . . . . . . . . . . . . . . . . . . . . . . . . . . . . . . . . . . . . . . . . . . . . . . . . . . . . . 4Introduction. . . . . . . . . . . . . . . . . . . . . . . . . . . . . . . . . . . . . . . . . . . . . . . . . . . . . . . . . . . . . . . . . . . . . . 6Transportation is climate enemy number one . . . . . . . . . . . . . . . . . . . . . . . . . . . . . . . . . . . . . . . . . . . . . 7Transportation emissions vary by state. . . . . . . . . . . . . . . . . . . . . . . . . . . . . . . . . . . . . . . . . . . . . . . . . . . . . . . . . . . . . . . . . . . . . 8Polluting vehicles, subsidized driving, and trillions of miles traveled:Why U.S. transportation emissions are so high . . . . . . . . . . . . . . . . . . . . . . . . . . . . . . . . . . . . . . . . . . . . 9Vehicles are inefficient and run on dirty fuels. . . . . . . . . . . . . . . . . . . . . . . . . . . . . . . . . . . . . . . . . . . . . . . . . . . . . . . . . . . . . . . . 9The design of our communities breeds car dependence . . . . . . . . . . . . . . . . . . . . . . . . . . . . . . . . . . . . . . . . . . . . . . . . . . . . . . 10Transit is often of poor quality or expensive where it exists at all . . . . . . . . . . . . . . . . . . . . . . . . . . . . . . . . . . . . . . . . . . . . . 10Walking and biking are often difficult or unsafe. . . . . . . . . . . . . . . . . . . . . . . . . . . . . . . . . . . . . . . . . . . . . . . . . . . . . . . . . . . . . . 11Driving is heavily subsidized . . . . . . . . . . . . . . . . . . . . . . . . . . . . . . . . . . . . . . . . . . . . . . . . . . . . . . . . . . . . . . . . . . . . . . . . . . . . 12The path to zero-carbon transportation . . . . . . . . . . . . . . . . . . . . . . . . . . . . . . . . . . . . . . . . . . . . . . . . 14Phase out fossil fuel vehicles. . . . . . . . . . . . . . . . . . . . . . . . . . . . . . . . . . . . . . . . . . . . . . . . . . . . . . . . . . . . . . . . . . . . . . . . . . . . 14Electrify public transportation. . . . . . . . . . . . . . . . . . . . . . . . . . . . . . . . . . . . . . . . . . . . . . . . . . . . . . . . . . . . . . . . . . . . . . . . . . . 17Get more people traveling by foot, bike and transit. . . . . . . . . . . . . . . . . . . . . . . . . . . . . . . . . . . . . . . . . . . . . . . . . . . . . . . . . . 20Conclusion . . . . . . . . . . . . . . . . . . . . . . . . . . . . . . . . . . . . . . . . . . . . . . . . . . . . . . . . . . . . . . . . . . . . . . 25Appendix . . . . . . . . . . . . . . . . . . . . . . . . . . . . . . . . . . . . . . . . . . . . . . . . . . . . . . . . . . . . . . . . . . . . . . . 26Notes . . . . . . . . . . . . . . . . . . . . . . . . . . . . . . . . . . . . . . . . . . . . . . . . . . . . . . . . . . . . . . . . . . . . . . . . . . 28
Executive summaryTransportation is the leading source of carbon pollution in the U.S., and light-duty vehicles – includingcars, pickups and SUVs – are the biggest contributorsto the problem. In 2017, light-duty vehicles accountedfor one-sixth of America’s greenhouse gas emissions,and nearly three-fifths of emissions from the transportation system.2 That is equivalent to: Nearly all the carbon pollution from all the remaining U.S. coal-fired power plants.3 More than the entire emissions of any country inthe world except China, India, Russia and Japan.4(China: 11,887 MMTCO 2e)6,0005,000Economy-wide emissions4,000Other transportation emissions3,000Light-duty vehicle emissions2,000inaU.S.IndiaRussiaJapanBInd razilonGe esiarmanySo Irauth nKoreCa anadM aSa exiud coiAraAu biasSo traliuth aAfrica1,000ChThere is no solution to global warming that doesn’tinvolve a sea change in how Americans get around andin how we power our cars and trucks. The good news:A clean, efficient, and sustainable low-carbon transportation system is possible. By phasing out fossil fuelvehicles, electrifying and improving our transit system,and getting more people walking and biking, the U.S.can take on today’s greatest environmental challenge,while creating communities that are healthier, saferand more livable.7,000Greenhouse gas emissions (MMTCO2e)In the U.S., transportation is climate enemy number one. America’s transportation system producesmore greenhouse gas emissions than any other sector of our economy and, on its own, is responsible for 4percent of the world’s greenhouse gas emissions – morethan the entire economies of France and the UnitedKingdom combined.1Figure ES-1. U.S. light-duty vehicles emit more greenhouse gas emissionsthan most entire countries5High transportation emissions result in large part fromAmericans driving more than 3.2 trillion miles eachyear in inefficient, polluting vehicles.6 Factors drivinghigh emissions from light-duty vehicles include: Oversized, inefficient vehicles that run on dirtyfuels. Typical U.S. vehicles are bigger, heavier andmore powerful than those in most other countries,contributing to relatively high fuel use and carbondioxide emissions per mile of travel.7 Subsidized driving. Driving in the U.S. benefitsfrom direct and indirect subsidies that lead toincreased vehicle travel.8 Lack of transit access. 45 percent of Americans lackaccess to public transit. And even in areas ostensibly4Destination: Zero Carbon
served by transit, many Americans live in placeswhere transit is inaccessible, unreliable, infrequentor low quality.9 Dangerous walking and biking. In 2018, nearly6,300 pedestrians and more than 800 bicyclists werekilled in traffic, increases of 3.4 percent and 6.3 percent, respectively, from 2017.10 These deaths reflectinfrastructure that is unsafe, and that can dissuadepeople from choosing to get around without a car. Car-dependent land use patterns. Many communities in the U.S. have attributes that make it hard toget around without a car, including low density andsingle-use zoning that separates homes and workplaces.11 Research shows that Americans who live inlow-density areas travel more often by driving, drivemore miles, and tend to own more vehicles.12To prevent the worst impacts of global warming, theU.S. must begin to rapidly decarbonize its transportationsystem. Three goals, which are achievable with provenpolicies and existing technology, can help eliminate emissions from cars and light trucks and contribute to America’s transition to a zero-carbon transportation future:hh PHASING OUT FOSSIL FUEL VEHICLES canenable the U.S. vehicle fleet to operate with zerogreenhouse gas emissions from driving or charging,if such a shift is accompanied by a transition to agrid powered by clean, renewable energy. Electricvehicles also benefit public health, as they do notemit tailpipe emissions like particulate matter andnitrogen oxides that cause cancer, asthma and otherhealth problems.13All new light-duty cars and trucks sold after 2035should be electric vehicles. To achieve this goal,policymakers should: Set requirements to phase out fossil fuel-powered vehicles and adopt EV mandates. Make EVs cheaper to buy and own through taxcredits and other incentives. Expand and improve EV charging infrastructure.hh ELECTRIFYING AND IMPROVING TRANSITcan create clean transit fleets for cities and schools,particularly if those fleets are powered by clean energy.Electric buses emit no tailpipe emissions and wouldimprove the health of children who take school busesand the high-density populations often served by buses.14U.S. transit agencies and school districts should replaceall transit and school buses with clean electric busesby 2030. To achieve this goal, policymakers should: Adopt electric bus commitments at all levels of government, and at transit agencies and school districts. Provide transit agencies with financial and technical assistance to help them make the switch to electric buses while maintaining or increasing service.hh GETTING MORE PEOPLE MOVING BYFOOT, BIKE AND TRANSIT can immediatelyreduce emissions. Walking and biking infrastructure has been shown to benefit communities in avariety of ways, including increased safety, economicbenefits for local businesses, improved health andhappiness, and more freedom for older adults andpeople with mobility challenges.The U.S. should at least double the number ofpeople who travel by foot, bike or transit by 2030.To achieve this goal, policymakers should: Ensure that walking, biking and transit are safe,affordable, accessible and enjoyable. End subsidies that make driving artificiallycheap to help make low-carbon transportationthe easiest, cheapest, most convenient option.These three goals – phasing out fossil fuel vehicles,electrifying transit, and getting more people travelingby foot, bike and transit – can help the U.S. create azero-carbon transportation future in which vehicles arepowered by clean, renewable energy, and in which morepeople get around without a car. By adopting goals todecarbonize transportation, policymakers can immediatelybegin reducing transportation emissions, while ensuringhealthier, happier and safer communities for everyone.Executive summary5
IntroductionAmerica’s transportation system is so pollutingand inefficient that it can be difficult to imagine what a clean, carbon-free transportationsystem in America might look like. Across the country,our highways are clogged each day with millions of vehicles producing carbon dioxide and other pollution. Inmany communities, getting to work or the grocery storewithout a car is close to impossible.But a closer look reveals what could be the seeds of adifferent future.Increasing numbers of Americans are ditching gasoline-powered vehicles for electric ones, with more than360,000 electric vehicles sold in 2018.15 Just a decadeago, electric cars were luxury curiosities for tech-savvyearly adopters. Today, more than a dozen differentmodels of EVs are on the market, ranging from low-costsedans to ultra-high-performance sports cars and everything in between.16At the same time, communities from Seattle to SanAntonio are investing in transit systems that havehelped increase ridership and reduce driving. And communities such as Seneca, South Carolina, are rolling outemission-free electric bus systems, bringing clean publictransportation options to city streets.17In many places across America, it’s becoming easier andsafer to travel without a car at all. Communities of allsizes have realized that citizens are happier, healthier,and safer when streets work better for people travelingby foot and bike. As of the end of 2018, nearly 1,5006Destination: Zero Carboncommunities across the country – primarily towns andsmall suburbs – had adopted “complete streets” policiesto make streets safer and more accessible to peopleusing a variety of travel modes.18Yet, despite this notable progress, transportationremains the number one source of carbon pollutionin the United States – and, with more people drivinglarger vehicles and fuel economy improvements stagnating, emissions are rising, not falling.Achieving a zero-carbon transportation future will notbe easy, but it can be done with the technology andknow-how we have today. Plus, the same changes thatenable a zero-carbon transportation system can alsohelp create happier, healthier communities. Electricvehicles eliminate the street-level pollution that causescancer, asthma and smog. Electric buses are whisper-quiet, providing riders and other city dwellers withrelief from rumbling diesel engines. And by making ourstreets safer and more accessible for people who travelon foot or by bike, we can not only reduce the numberof car trips and congestion, but also save lives.The following pages present concrete steps that statesand communities can take – right now – to get on apath to a zero-carbon transportation future. These arepolicies that have already been adopted successfullyby communities around the country and the world.Taking these steps will help protect current and futuregenerations from the potentially catastrophic impactsof climate change, while clearing our air and improvingour quality of life.
Transportation is climate enemynumber oneIn the United States, transportation is climate enemynumber one, responsible for more greenhouse gasemissions than any other sector of the economy. In2017, the transportation sector emitted 1,866 millionmetric tons of greenhouse gases (MMTCO2e), accountingfor 29 percent of total greenhouse gas emissions.19 In fact,U.S. transportation emissions now account for approximately 4 percent of total global greenhouse gas emissions.20In 2017, light-duty vehicles emitted 1,098 million metrictons of greenhouse gases, equivalent to:Greenhouse gas emissions (MMTCO2e)3,000 17 percent of total U.S. greenhouse gas emissions.2,5002,0001,5001,000500Cars and light trucks are the leading source of U.S.transportation emissions. In 2017, light-duty vehiclesaccounted for one-sixth of America’s total greenhousegas emissions, and nearly three fifths of transportationemissions.22 Other major sources of transportationemissions include medium- and heavy-duty trucks (suchas large pickups, semi-trailer trucks, and garbage trucks),air travel, trains and l and 2004200620082010201220142016-Figure 1. Transportation is now the leading source of greenhouse gasemissions in the U.S.21 91 percent of emissions from all U.S. coal-firedpower plants.24 An amount greater than the entire emissions of anycountry in the world except China, India, Russia andJapan.25 For context, the economy-wide emissions ofBrazil, the country with the world’s sixth highest greenhouse gas emissions, were 1,050 MMTCO2e in 2016. An amount greater than emissions produced by theentire countries of France and the United Kingdomcombined.26In recent years, emissions from light-duty vehicles haveincreased. From 2013 to 2017, the annual distanceAmericans drove in light-duty vehicles increased by 200billion miles, and annual greenhouse gas emissionsfrom light-duty vehicles rose by 36 million metric tons.27Transportation is climate enemy number one7
(China: 11,887 MMTCO 2e)6,0005,000Economy-wide emissions4,000Other transportation emissionsLight-duty vehicle emissions3,0002,000U.S.IndiaRussiaJapanBInd razilonGe esiarmanySo Irauth nKoreCa anadMe aSa xiud coiAraAu biaSo straliuth aAfrica1,000ChinaGreenhouse gas emissions (MMTCO2e)7,000Figure 2. U.S. light-duty vehicle greenhouse gas emissions are higher than most entire countries28Transportation emissions vary by stateTotal and per-capita transportation emissions vary bystate. States with large urban areas, especially those withgood transit, tend to have lower per-capita transportation emissions, while rural states and states dominatedby suburban development or extractive industries tendto have higher per-capita emissions.Total emissions by stateThree U.S. states have total transportation emissions ofmore than 100 million metric tons of carbon dioxide:Texas, California and Florida.298Destination: Zero CarbonTransportation emissions(MMT CO2)0 - 2525 - 5050 - 100100 Figure 3. Transportation emissions by state31
Texas, with the country’s second-highest populationalong with high per-capita transportation emissions,is the leading emitter of CO2 from transportation inthe U.S. In 2016, Texas’ transportation sector emitted226 million metric tons of CO2, more than the economy-wide emissions of countries such as Vietnam, Argentina and the Netherlands.30Per capita emissions by stateIn five U.S. states in 2016, per capita transportationemissions were more than 10 metric tons: Alaska,Wyoming, North Dakota, Louisiana and Mississippi. InAlaska, per capita transportation emissions in were 16.2metric tons of CO2.32 The states with the lowest 2016transportation emissions per capita were Rhode Island,New York, Connecticut, Maryland and Massachusetts.In Rhode Island, per capita transportation emissionswere 3.7 metric tons of CO2.Transportation emissions percapita (metric tons CO2)1.0 - 5.05.0 - 7.57.5 - 10.010.0 Figure 4. Per capita transportation emissions by state33Transportation is climate enemy number one9
Polluting vehicles, subsidized driving,and trillions of miles traveled: Why U.S.transportation emissions are so highEvery year, Americans drive more than 3.2 trillionmiles in all vehicles, or nearly 10,000 miles perperson.34 Americans drive more miles per capitathan people almost anywhere else in the world. Amongthe 22 European countries for which the UnitedNations Economic Commission for Europe had recentdata, no country had even 70 percent as much drivingper person as the U.S.3510,0008,0006,0004,0002,000UnitedStatSlo esveniaIrelandAustriaFinlandFrancNo erwaSw yedenEsSw toniitUn zer aite landK dingdomCze Croch atiaRepublicSpaHu inngaryVehicle miles traveled per capitaThis high level of driving, much of it done in heavy,inefficient vehicles powered by oil, contributes to America’s high carbon emissions from light-duty vehicles.Figure 5. Americans drive many more miles per person than residents ofEuropean countries3610Destination: Zero CarbonVehicles are inefficient and run on dirtyfuelsThe typical American vehicle is heavy, inefficient andpowered by dirty fossil fuels, meaning that each miledriven imposes a heavy burden on the climate. Ananalysis comparing the U.S. with seven countries plus theEuropean Union found that the average U.S. passengervehicle emits more CO2 and consumes more fuel per milethan the average vehicle in all but three countries, andis bigger, heavier, and has a more powerful engine thanthe average vehicle in any other country.37 For example,the average U.S. passenger vehicle has 200 horsepower,compared to 125 horsepower for vehicles in the E.U., andweighs 1.8 tons, compared to 1.5 tons in the E.U.38The inefficiency of vehicles is in part the result of theauto industry’s focus, particularly throughout the 1990s,on increasing vehicle size and power rather that increasing fuel economy.39 Per mile, the average vehicle soldtoday burns more than 80 percent as much gas per mileas the average vehicle sold in 1990 – despite tremendousimprovements in engine and vehicle technology – whilethe average weight of vehicles has increased by almost20 percent.40Vehicle trends since 1975 demonstrate the relationshipbetween power, weight and emissions, and the importance of efficiency standards. Vehicle per-mile CO2 emissions dropped sharply after the nation’s first Corporate
CO2 emissions (g/vehicle mile)Engine power (hp)Footprint (sq. ft.)U.S.JapanEU-28MexicoChinSaud aiAraSo biauthKoreaIn diainaChU.S.JapanMeSo xicouthKoreaBSa raziludiArabiaiaIn dEU-28Brazil250200150100500300250200150100500Curb weight (tons).SaudU.S-28iArSo azilJapanMexicoEU-28CSa hinaudiArSo abiauthKorea21.510.50ia50403020100Figure 6. U.S. passenger cars tend to be bigger, heavier and worse for the climate than those in other countries42Average Fuel Economy (CAFE) standards were passedin 1975.41 When those standards were weakened, emissions rose while vehicles became heavier and more powerful. In recent years, strengthened standards have onceagain helped reduce vehicle per-mile CO2 emissions.The design of our communities breeds cardependenceMany American communities are physically laid out inways that require car trips for basic, everyday travel. Inparticular, many communities are low density – andif destinations are far apart, it’s more difficult to getaround without a car. While rural areas have alwaysbeen spread out, since World War II, America has beenintentionally designing suburban communities in waysthat virtually require the use of a car to conduct nearlyevery daily task, a decision that has helped fuel the risein the number of miles Americans drive.The Intergovernmental Panel on Climate Change, theforemost scientific authority on global warming, writes,“[i]n low-density developments with extensive roadinfrastructure, [light-duty vehicles] will likely dominatemodal choice for most types of trips.”43 This is bothbecause it is difficult or unpleasant to walk or bike insprawling neighborhoods, and because low-density areasare harder to serve with transit.For the roughly two-thirds of Americans who live inlow-density areas, it is not only harder to get aroundwithout a car, car trips also tend to be longer.44 According to a study by the State Smart Transportation Initiative, a decrease in density of 10 people per squaremile corresponds with an increase in vehicle travel perperson of almost 400 miles.45Transit is often of poor quality orexpensive where it exists at allMany Americans lack options to get around without acar. Nearly half (45 percent) of Americans lack access toany public transit.46Even in areas ostensibly served by transit, transit can beinfrequent, hard to access or low quality. According to asurvey by the TransitCenter, frequency of service is thetop concern of bus riders (and the study notes that the topconcern of train riders, crowding, can be ameliorated byPolluting vehicles, subsidized driving, and trillions of miles traveled: Why U.S. transportation emissions are so high11
frequency improvements).47 Distance from transit stopsalso reduces ridership. A 2001 study found that bus transituse sharply declines for households more than more than0.15 miles from bus stops.48 Another study found that inSan Jose, “each additional five minutes in perceived walking time to transit decreases transit ridership frequency by5 percent for nondrivers and by 25 percent for drivers.”49When transit service is unavailable or low quality, the resultis more driving. The previously cited TransitCenter surveyfound that users who are dissatisfied with transit quality useit less, and that “[o]verwhelmingly, survey respondents whoabandon or substantially scale back their transit use replacethose trips with increased private car use.”50Overpriced transit can also deter riders. The VictoriaTransport Policy Institute conducted a research reviewconcluding that, for every 1 percent increase in transitfares, transit ridership decreases by between 0.2 and 0.5percent in the short run (less than a year), and by 0.6 to0.9 percent over the long run (more than five years).51 A2018 Congressional Research Service report found thataverage fares have risen faster than inflation in recentyears.52 From 2004 to 2014, the average inflation-adjustedU.S. price of bus fare increased 15 percent; commuter rail22 percent; subway 1 percent; and light rail and streetcar26 percent.53 (By contrast, the federal gasoline tax has notbeen increased since 1993, resulting in a more than 40percent reduction in the amount of federal taxes driverspay per gallon, when adjusted for inflation.)54 7.00Average price per unlinked trip(inflation-adjusted 2014 dollars) 6.00 5.002004 4.002014 3.00 2.00 1.00 -BusCommuter railSubwayLight rail andstreetcarFigure 7. All transit modes saw trip prices increase from 2004 to 20145512Destination: Zero CarbonWalking and biking are often difficult orunsafeIn much of America, walking and biking can be dangerous. In 2018, nearly 6,300 pedestrians and morethan 800 bicyclists were killed in traffic, increases of3.4 percent and 6.3 percent, respectively, from 2017.56Per mile, the U.S. fatality rate for bicyclists is five timeshigher than in cycling-heavy countries the Netherlandsand Denmark.57Walking and biking deaths are often the result of infrastructure that is unsafe. Unsurprisingly, when peopleperceive that an activity – like walking or biking – islikely to put their safety at risk, they will be less likely todo it. According to a research review by Active LivingResearch, “[s]afety concerns, both real and perceived,are a major deterrent to active travel.”58High fatality and injury rates for pedestrians andbicyclists are in part the result of road and communitydesign that prioritizes vehicle throughput and speed.For example, nearly all states use a design metric called“level of service,” which uses vehicle delay as the measure of a road’s performance.59 Use of this measurecan lead to fast, wide streets that put vehicles first, andincrease danger for pedestrians. The risk of death fora pedestrian hit by a car more than doubles, from 10percent to 25 percent, if the speed of the car increasesfrom just 23 mph to 32 mph.60 For a pedestrian hit by acar moving at 42 mph, the risk of death is 50 percent.61Many roads also lack basic infrastructure that improvessafety for walking and biking, like sidewalks and bikelanes.62 A study of pedestrian crashes from the early1990s found that, for the 2,885 incidents where suchdata was available, more than 80 percent took place onroads with no sidewalk.63 Another study found that therisk of biking on roads with physically separated bikelanes (cycle tracks) was about one ninth that of ridingon roads with no bike lanes.64
Driving is heavily subsidizedMany Americans perceive that they pay the full costof driving through the taxes on gasoline, vehicle registration fees and other fees on driving. In reality, thesetaxes and fees do not even cover the cost of buildingand maintaining roads.Roads without infrastructure for walking and biking make it less safe andmore difficult to get around without a car. This area of Shady Cove, Oregon, was later the focus of an improvement project to add sidewalks andbike lanes. Credit: Oregon Department of TransportationLocal streets and roads have always been largely paid forby local taxpayers, often through property taxes. Andsince 2008, outlays by the Highway Trust Fund (HTF)have exceeded revenue from federal fuel taxes and othersources, while the HTF received nearly 115 billion ingeneral fund transfers from 2008 to 2018.65 This is duein part to low fuel taxes: In a comparison of 61 countries, Bloomberg found that a gallon of gas is cheaper inthe U.S. than in all but 12 other countries, largely dueto differences in taxation and subsidies. 66New road capacity increases transportation emissionsIn 2014, the latest year for which data is available,federal, state and local governments spent 26 billion to expand the nat
U.S. transit agencies and school districts should replace all transit and school buses with clean electric buses by 2030. To achieve this goal, policymakers should: Adopt electric bus commitments at all levels of gov - ernment, and at transit agencies and school districts. Provide transit agencies with financial and techni -
