Transcription
Atmos. Meas. Tech., 12, 1767–1783, 2019https://doi.org/10.5194/amt-12-1767-2019 Author(s) 2019. This work is distributed underthe Creative Commons Attribution 4.0 License.Adaptation and performance assessment of a quantum andinterband cascade laser spectrometer for simultaneous airborne insitu observation of CH4, C2H6, CO2, CO and N2OJulian Kostinek1 , Anke Roiger1 , Kenneth J. Davis3 , Colm Sweeney6 , Joshua P. DiGangi5 , Yonghoon Choi5,7 ,Bianca Baier6,8 , Frank Hase4 , Jochen Groß4 , Maximilian Eckl1 , Theresa Klausner1 , and André Butz21 DeutschesZentrum für Luft- und Raumfahrt, Institut für Physik der Atmosphäre, Oberpfaffenhofen, Germanyof Environmental Physics, University of Heidelberg, Heidelberg, Germany3 Department of Meteorology and Atmospheric Science, The Pennsylvania State University, University Park, PA 16802, USA4 Institute of Meteorology and Climate Research, Karlsruhe Institute of Technology, Karlsruhe, Germany5 NASA Langley Research Center, Hampton, VA 23681-2199, USA6 NOAA ESRL Global Monitoring Division, Boulder, CO 80305-3328, USA7 Science Systems and Applications, Inc., Hampton, VA 23681, USA8 Cooperative Institute for Research in Environmental Sciences, University of Colorado Boulder, Boulder, CO 80305, USA2 InstituteCorrespondence: Julian Kostinek (julian.kostinek@dlr.de)Received: 14 September 2018 – Discussion started: 5 October 2018Revised: 23 February 2019 – Accepted: 28 February 2019 – Published: 19 March 2019Abstract. Tunable laser direct absorption spectroscopy is awidely used technique for the in situ sensing of atmosphericcomposition. Aircraft deployment poses a challenging operating environment for instruments measuring climatologically relevant gases in the Earth’s atmosphere. Here, wedemonstrate the successful adaption of a commercially available continuous wave quantum cascade laser (QCL) and interband cascade laser (ICL) based spectrometer for airbornein situ trace gas measurements with a local to regional focus. The instrument measures methane, ethane, carbon dioxide, carbon monoxide, nitrous oxide and water vapor simultaneously, with high 1 s–1σ precision (740 ppt, 205 ppt,460 ppb, 2.2 ppb, 137 ppt and 16 ppm, respectively) and highfrequency (2 Hz). We estimate a total 1 s–1σ uncertaintyof 1.85 ppb, 1.6 ppb, 1.0 ppm, 7.0 ppb and 0.8 ppb in CH4 ,C2 H6 , CO2 , CO and N2 O, respectively. The instrument enables simultaneous and continuous observations for all targeted species. Frequent calibration allows for a measurementduty cycle 90 %. Custom retrieval software has been implemented and instrument performance is reported for a firstfield deployment during NASA’s Atmospheric Carbon andTransport – America (ACT-America) campaign in fall 2017over the eastern and central USA. This includes an interinstrumental comparison with a calibrated cavity ring-downgreenhouse gas analyzer (operated by NASA Langley Research Center, Hampton, USA) and periodic flask samplesanalyzed at the National Oceanic and Atmospheric Administration (NOAA). We demonstrate good agreement of theQCL- and ICL-based instrument to these concurrent observations within the combined measurement uncertainty aftercorrecting for a constant bias. We find that precise knowledge of the δ 13 C of the working standards and the sampledair is needed to enhance CO2 compatibility when operatingon the 2227.604 cm 1 13 C16 O2 absorption line.1IntroductionWith steadily increasing greenhouse gas concentrations inthe Earth’s atmosphere, an improved understanding of theanthropogenic influence on climate is of major interest forglobal civilization. Globally averaged carbon dioxide (CO2 )mole fractions have increased by 40 % since 1750. Methane(CH4 ) mole fractions have more than doubled since thepreindustrial era, and over 60 % of this increase is estimatedto be of anthropogenic nature (Ciais et al., 2013). Nitrousoxide (N2 O) is a strong greenhouse gas and is expected toPublished by Copernicus Publications on behalf of the European Geosciences Union.
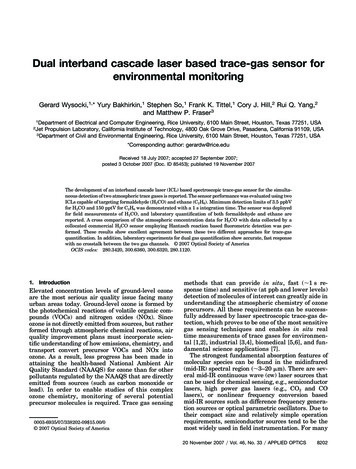
1768J. Kostinek et al.: Adaptation and performance assessment of a QCL and ICL spectrometerhave the most important ozone-depleting anthropogenic impact throughout the 21st century (Ravishankara et al., 2009).Ethane (C2 H6 ) is a powerful tracer commonly used to discriminate between different types of methane sources (Smithet al., 2015; Barkley et al., 2017; Peischl et al., 2015), andcarbon monoxide (CO) is a marker for incomplete combustion processes and relates to the formation of troposphericozone (Klemm et al., 1996).Aircraft provide a flexible platform for satisfying the fundamental need for accurate, temporally and spatially denseobservations of these climatologically relevant gases from local to regional scales. Onboard meteorological data acquisition systems allow for concurrent observations of importantatmospheric state variables like the local wind field, whichis particularly useful to estimate emissions. Spectroscopicinstruments making use of molecular ro-vibrational absorption allow for high temporal coverage through fast instrument response times (Chen et al., 2010). Some have alreadybeen used for airborne research, e.g., established IR spectrometers (O’Shea et al., 2013; Santoni et al., 2014; Cambaliza et al., 2015; Filges et al., 2015). Significant effortled to instruments operating in the mid-infrared (IR) region,e.g., liquid- nitrogen-cooled lead-salt diode laser-based spectrometers (Fried and Richter, 2007). With the commercialavailability of continuous-wave lasers emitting in the mid-IRregion near ambient temperature (Capasso, 2010; Vurgaftman et al., 2015; Kim et al., 2015; Beck et al., 2002) several new instrument designs have emerged (McManus et al.,2015; Zellweger et al., 2016). Quantum cascade laser (QCL)and interband cascade laser (ICL) based systems exploit several orders of magnitude stronger molecular absorption features in the mid-infrared compared to near-infrared-based instruments. Richter et al. (2015) reported on a custom-builtdifference frequency generation absorption spectrometer forsimultaneous in situ detection of formaldehyde (CH2 O) andC2 H6 providing high detection sensitivities of 40 and 15 ppt,respectively. The custom-built airborne QCL spectrometerdescribed by Catoire et al. (2017) allows for simultaneousobservation of CO, CH4 and nitrogen dioxide (NO2 ) with inflight precisions of 0.3, 5 and 0.3 ppb for a sampling timeof 1.6 s. McManus et al. (2011) reported on the developmentof a high-sensitivity trace gas instrument based on quantumcascade lasers and astigmatic Herriott cells with up to 240 mpath length. Unlike many established instruments measuringdifferent species sequentially (one species after the other),the described spectrometer allows for concurrent sensing ofthe selected species and faster response times. These instruments have already been operated on different research aircraft. Santoni et al. (2014) describe the successful deployment and evaluation of a similar airborne spectrometer (Harvard QCLS) for more than 500 flight hours. However, Pittet al. (2016) reported a severe cabin pressure dependency oftheir N2 O and CH4 measurements using a commercial instrument (Aerodyne QCLS). By implementing a pressuredifferentiated calibration method they were able to correctAtmos. Meas. Tech., 12, 1767–1783, 2019the corresponding dataset but had to omit roughly half of themeasured data. Recently, Gvakharia et al. (2018) reported ona similar cabin pressure dependency for their N2 O, CO2 andCO measurements (based on an Aerodyne QCLS). They suggested a fast calibration procedure to overcome these dependencies while maintaining a 90 % duty cycle.Here, we describe the setup and performance of our flightproven (over 100 flight hours) airborne QCL and ICL system developed for simultaneous airborne measurements ofCH4 , C2 H6 , CO2 , CO, N2 O and H2 O. The instrument isshown to provide multi-species airborne observations for assessing greenhouse gas fluxes with a local (e.g., single facilities) to regional focus (e.g., urban agglomerations). Simultaneous observations of CH4 and C2 H6 facilitate to pinpoint sources of CH4 enhancements (Smith et al., 2015).At the same time, the instrument provides measurements ofN2 O, the third most important greenhouse gas. This makesthe instrument an ideal tool for airborne quantification andsource attribution of greenhouse gas emissions using, e.g.,the aircraft-based mass balance approach. Section 2 summarizes the refinements over the commercial system for use onaircraft. We show that frequent two-point calibration can mitigate cabin pressure dependencies. Section 3 describes ourcustom-built retrieval software developed for tuning the retrieval process. Sections 4 and 5 report on instrument performance in the laboratory and in the field during NASA’s ACTAmerica fall 2017 campaign, including an inter-instrumentalcomparison with a calibrated cavity ring-down instrumentand periodically taken flask samples. Section 6 summarizesour findings and concludes the study.2The airborne DLR QCL and ICL spectrometerThe spectrometer system used here builds upon the DualLaser Trace Gas Monitor, a commercial tunable IR laser direct absorption spectrometer (TILDAS) available from Aerodyne Research Inc. (Billerica, USA), acquired by the German Aerospace Center (Deutsches Zentrum für Luft- undRaumfahrt, DLR) in late 2016. The basic instrument has already been extensively described in McManus et al. (2011).We will therefore only briefly introduce the basic instrumentsetup followed by a description of the refinements requiredto operate the instrument on a research aircraft.2.1Basic instrument setupThe spectrometer is split into an electronics and an optics compartment. The electronics compartment includes anembedded computing system, thermoelectric cooling (TEC)controllers and power supply, etc. The optics compartmentincludes the lasers, the sample cell and the pressure controller, etc. Figure 1 shows a top-view photograph of the optics compartment. A combination of a continuous wave QCLand ICL measures mole fractions of CH4 , C2 H6 , CO2 , CO,www.atmos-meas-tech.net/12/1767/2019/
J. Kostinek et al.: Adaptation and performance assessment of a QCL and ICL spectrometer1769Figure 1. Top-down photograph of the optics compartment (a). The sample cell made from aluminum along with the pressure controllerand pressure transducers can be identified in the lower half. The QCL and ICL are mounted inside the blue housings to the left of thecollimating Schwarzschild telescopes in the two black housings. The two detectors are mounted below the silver aluminum cases, housingthe pre-amplifiers, on the right. The first detector is used for detecting both lasers after passing through the sample cell. The second detectoris used for spectral referencing through an auxiliary optical path. Panel (b) illustrates the rack-mounted instrument. The figure includes solidmodels from Aerodyne Inc. and Solid State Cooling Systems.N2 O and H2 O simultaneously using direct absorption spectroscopy. The sample cell is an astigmatic Herriott cell withapproximate physical dimensions of 15 cm 15 cm 50 cm(W H L) made from aluminum. It provides an effective absorption path length of 204 m with a net volume of2.1 L. Two laser light sources are tuned to a specific center wavelength by adjusting the operating temperature using Peltier elements contained in the laser’s housing. Excess heat is removed through a liquid cooling–heating circuit(Solid State Cooling Systems, New York, USA). Laser no. 1is an interband cascade laser manufactured by NanoplusGmbH, Gerbrunn, Germany, with a peak output power of9.5 mW operated at 4.7 C and modulated between 2988.520and 2990.625 cm 1 using a linear current ramp of up to40 mA. Laser no. 2 is a quantum cascade laser manufacturedby Alpes Laser, St-Blaise, Switzerland, with a peak output power of 40 mW operated at 1.5 C modulated between2227.550 and 2228.000 cm 1 using a linear current ramp ofup to 300 mA. The lasers are modulated sequentially at afixed frequency of 1.5 kHz. Laser no. 1 scans over absorptionlines of CH4 , C2 H6 and H2 O, and Laser no. 2 sweeps overN2 O, CO2 and CO lines. Each laser is sampled at 450 spectral points. Acquired spectra are co-added to yield a singleoutput spectrum twice per second. Before reaching the sample cell, the laser beam travels approximately 1.6 m inside theinstrument under ambient conditions. This will be referred toas the open path of the instrument, which is heavily influenced by variations in cabin pressure, temperature and humidity during airborne operation. After passing through thesample cell, the combined output from both lasers hits a single TEC detector. A second, identical detector collects radiation from two auxiliary paths. The first auxiliary path contains a small, sealed reference cell filled with CH4 and N2 O.This allows for spectral referencing during system startup.www.atmos-meas-tech.net/12/1767/2019/The second path introduces an etalon into the beam, allowing for experimental determination of the laser tuning rate,which relates laser supply current and emitted wavelength.2.2Refinements for airborne operationThe key challenges for a successful deployment on researchaircraft are limited space and power, the occurrence of linear and angular accelerations and large pressure, temperatureand humidity fluctuations in both cabin and sampled air. Airborne instrumentation further requires a fast system responsetime, owing to the rapid movement of aircraft in the atmosphere. The response time is controlled by the time it takesto completely exchange the air in the sample cell which isdriven by the highest achievable volumetric flow rate given aspecific pump and sample cell volume.Here, a scroll pump has been chosen to enable a constant sample flow through the sample cell. The lubricantfree scroll pump runs very smoothly, reducing vibrations ofthe measurement system, yet providing good pumping performance with a nominal value of 500 SLPM at standardconditions. This translates to a net flow rate of 25 SLPM(given IUPAC standard conditions of T 273.15 K and p 1000 hPa) when operating at a cell pressure of 50 hPa. Earlierexperience showed that large electrical inrush currents havejeopardized nominal system startup (Stefan Müller, MPIMainz, private communication, 2016). Sudden power failure, due to an overcurrent triggering aircraft circuit breakers,may lead to failures in the data analysis equipment. The original motor has therefore been exchanged with a synchronousthree-phase motor (Baumueller Nuernberg GmbH, Velbert,Germany). This DC motor provides a rated power of 627 Wat 28 VDC. By using a digital motor controller, the maximumstartup current can be limited amongst various other tuningAtmos. Meas. Tech., 12, 1767–1783, 2019
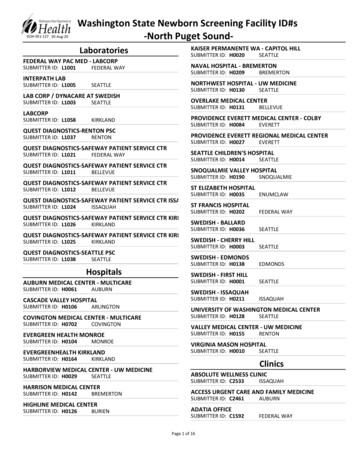
1770J. Kostinek et al.: Adaptation and performance assessment of a QCL and ICL spectrometeroptions. From previous studies the motor is known to emita considerable amount of heat; a forced airflow provided bya standard axial fan ensures motor temperatures stay in therated range.Aircraft deployment requires the entire system to operatewith a maximum of 50 A at 28 VDC. Power consumptionof the instrument is mainly dominated by the pump and thethermoelectric cooling making up more than three-quartersof the total power requirement. Both components have beenelectrically converted without the need for power invertersfrom 230 VAC to 28 VDC to increase overall efficiency. Thespectrometer and its internal computer are driven by a powerinverter.Large parts of the wiring harness have been exchangedfrom standard PVC cables to aviation-grade fire-resistantwiring. Mandatory electromagnetic compatibility and interference (EMC/EMI) tests have been carried out to comply with Federal Aviation Administration (FAA) regulations.The rack-mounted instrument sums up to a total mass of approximately 115 kg and has been tested to withstand linearaccelerations of up to 9 g on the aircraft forward axis, 8 g onthe downward axis, 6 g upwards and 2.25 g sidewards. Dueto aircraft certification issues, pure water is used as processfluid for the liquid cooling–heating circuit instead of the intended propylene glycol/water mixture.A 3/8 in. inner diameter hose made out of polytetrafluoroethylene (PTFE) has been chosen for the sample air intake as a compromise for pressure drop across the inlet andto minimize lag time between the inlet and the sample cell.Inside the instrument and upstream of the sample cell, anaerosol filter holds back particles bigger than 2 µm. The inlet is rear-facing, preventing large particle entrainment andprotecting the instrument from liquid water and ice. Owingto the small diameter, the intake flow is inside the turbulentregime at all times (Re 4000).Finally, the sample cell pressure is regulated by means of afully configurable pressure controller (Bronkhorst High-TechB.V., Ruurlo, the Netherlands). A chip-scale temperaturecompensated pressure transducer (Measurement Specialties,Ltd., Europe) and a humidity sensor (Sensirion AG, StaefaZH, Switzerland) have been built into the optics compartment to allow the open-path state variables to be monitored(see Sect. 2.1).2.3rological Organization (WMO) standards for CH4 (Cert.Nr. CB11361, WMO X2004A for CH4 – Dlugokencky et al.,2005, WMO X2007 for CO2 – Zhao and Tans, 2006). C2 H6 ,CO and N2 O are compared to NOAA flask samples takenduring the ACT-America field campaigns, which are alsotraceable to WMO standards. We use ultrapure synthetic airas “zero” gas instead of pure nitrogen (N2 ) to be in accordance with aircraft safety regulations and because the molefraction of synthetic air (79.5 % N2 and 20.5 % O2 ) is chemically closer to sampled atmospheric air. Our calibration setupallows the net flow rate from the calibration cylinders to beslightly higher than the sample flow rate, minimizing pressure variations in the sample cell during switchover fromnormal to calibration sampling. To avoid contamination withcabin air, leak tests were carried out on a regular basis during the ACT-America field campaign. Histograms of typicalcalibration measurements are provided in Sect. S4 in the Supplement.Owing to the high sensitivity of the retrieved molefractions to changes in ambient conditions during flights(Gvakharia et al., 2018), calibration cycles are carried outautomatically every 5 to 10 min. Each cycle consists of apre-programmed sequence of flushing the sample cell withzero gas for 10 s followed by another 10 s of calibration gas.These time intervals have been found to be a good compromise between calibration gas cylinder endurance and measurement duty cycle. The online mixing feature is not usedfor in-flight calibration. Hence, no dilution of the calibrationstandard with zero air is introduced during flights, and theuncertainty in the flow rate measurements can be omitted.Online mixing (relevant for linearity checks) adds the uncertainty of the controlled mass flow (0.5 % relative error) on topof the gas cylinder uncertainties. Measured mole fractions ofall detected species settle to an approximately constant valuewithin the first 2 s after switchover from calibration gas tosample air and vice versa. The only exception is water vapor, which is observed to settle after approximately 30 s because of its stickiness and because the inlet tubing is madeout of PTFE. The observed decay in H2 O is different fromthe decay in other species in that a slow, almost linear decayfollows the initial exponential decay, due to remaining watervapor in the inlet tubing and the sample cell.In-flight calibration strategy3A custom-built calibration system has been implemented asillustrated in Fig. 2. Using mass flow controllers (MFCs;Bronkhorst High-Tech B.V., Ruurlo, the Netherlands), twogases can be mixed at arbitrary ratios.The calibration gas mixture has been chosen to resemble “target” gas mole fractions close to atmosphericambient values. The cylinders have been cross-calibratedagainst NOAA standards using a cavity ring-down spectrometer (CRDS) and are thus traceable to World MeteoAtmos. Meas. Tech., 12, 1767–1783, 2019Data retrieval and post-processingThe standard approach to retrieve dry-air mole fractions fromthe Aerodyne QCLS instruments is by making use of thesoftware supplied by the manufacturer (TDLWintel). Herewe utilize a custom retrieval software (JFIT) developed todouble-check the output of the TDLWintel software and toenhance the ability of tweaking the retrieval process. Ourmain goal in developing a stand-alone algorithm here wasto learn about possible error sources and mitigation possibilwww.atmos-meas-tech.net/12/1767/2019/
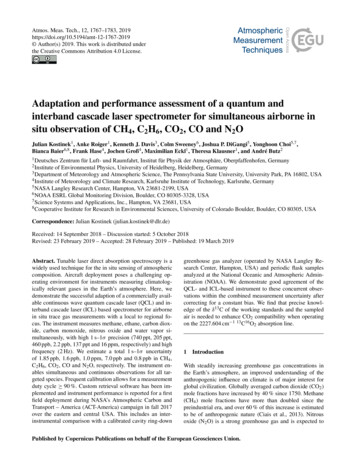
J. Kostinek et al.: Adaptation and performance assessment of a QCL and ICL spectrometer1771Figure 2. Schematic showing the main components with emphasis on the calibration system. A mass flow meter allows the sample flow rateto be measured. Two reference gases can be mixed at any arbitrary ratio by means of two calibrated mass flow controllers. A 2 µm particlefilter upstream of the sample cell avoids cell contamination.ities of instrument dependencies and to be able to extend theinstruments capabilities in the future.The code is written in plain C . It digests the samplecell pressure and temperature measurements to generate asynthetic spectrum based on line-by-line parameters fromthe HITRAN2012 and HITRAN2016 (Rothman et al., 2013;Gordon et al., 2017) database using a conventional Voigt profile approach. Ethane line-by-line data have been taken fromhigh-resolution Fourier-transform infrared spectra due to deficiencies in the HITRAN data for this particular species–wavenumber combination (Harrison et al., 2010). The computation of the Voigt profile has been adopted from Abrarovand Quine (2015). Our retrieval code differs from the TDLWintel approach in the determination of the spectral baselineand the handling of shift parameters and open-path water absorption.www.atmos-meas-tech.net/12/1767/2019/A typical raw spectral output, as saved by the instrumentin binary format, is illustrated in Fig. 3. The two consecutivelaser scans are clearly visible. On the left side, Laser no. 1sweeps between 2988.520 and 2990.625 cm 1 and, hence,over absorption features of CH4 , C2 H6 and H2 O. The rightside corresponds to the wavelength range of Laser no. 2(2227.550 to 2228.000 cm 1 ) and includes absorption features of N2 O, CO and CO2 . After the lasers have scannedtheir full range, both lasers are completely turned off to allowfor the determination of the detector zero-intensity offset.The abscissa corresponds to the individual sampling points,which can be converted to spectral units using the knownlaser tuning rate. The flat sections of the spectrum with nomolecular absorption are considered to represent the spectralbaseline. The shape of this baseline is mainly controlled bylaser characteristics, the detector response function and opti-Atmos. Meas. Tech., 12, 1767–1783, 2019
1772J. Kostinek et al.: Adaptation and performance assessment of a QCL and ICL spectrometerFigure 3. A typical raw spectrum as recorded in binary format by the instrument. Arrows have been added to ease identification of theobserved chemical species. Channel numbers on the abscissa can be converted to spectral units using the laser tuning rate. The intensityoffset can be corrected by shifting the entire spectrum to yield zero intensity when lasers are turned off.Figure 4. Schematic depicting the handling of spectral shift parameters and baseline modeling. The spectral baseline is fitted as a polynomialtogether with absorption features over the entire fit window. Shift parameters have been implemented in a species-independent way. Openpath water is also included in the model.Atmos. Meas. Tech., 12, 1767–1783, 2019www.atmos-meas-tech.net/12/1767/2019/
J. Kostinek et al.: Adaptation and performance assessment of a QCL and ICL spectrometercal properties of the installed mirrors and windows inside theinstrument.The spectrum is broken down into three fit windows forthe retrieval process (see Fig. 5). These were chosen basedon the best overall performance found in retrieval tests andnamed after the chemical species included. A synthetic spectrum, including a polynomial representing the spectral baseline, is generated and fitted using an unbounded Levenberg–Marquardt least-squares algorithm (Marquardt, 1963). Thedegree of the background-fitting polynomial has been adjusted empirically for each different fit window. Speciesindependent shift parameters have been included, allowingindividual absorption features to freely move on the spectral axis. Special care has been taken to group weak andstrong absorption features together in a single shift parameter to provide sufficient certainty on their spectral positions.In other words, not every absorption line has its own shiftparameter, but they are grouped as schematically shown inFig. 4. As a result, only five shift parameters are included,although the synthetic spectrum in Fig. 4 is composed ofmore than 20 individual lines. When the absorptivity doesnot yield enough certainty to ensure proper determinationof the shift parameters for a single spectrum, the shift variables are held constant at their means over the last 10 values. If another species in the relevant fit window allows for aproper determination of the spectral position, remaining shiftparameters are coupled to those with enough certainty. Thisallows absorption line center frequency changes to be properly modeled and provides a means for observing spectralstability. Typical shift parameters for ground-based operationare given in Fig. 8 for the CH4 –H2 O and CO2 –CO–N2 O fitwindows. Pressure, humidity and temperature data obtainedfrom within the optics compartment are used to model H2 Oabsorption at cabin pressure in the open-path region.The CH4 –H2 O fit window covers almost the entire setof spectral features covered with Laser no. 1 except for theC2 H6 absorption features. The spectral baseline is modeledas a third-order polynomial over the full range of the fit window. A typical spectrum including fit is depicted in Fig. 5along with typical spectra for the other two fit windows.The C2 H6 fit window includes absorption features of CH4and C2 H6 . The main challenge of retrieving precise C2 H6mole fractions arises from its very low background concentration in the atmosphere (approximately 1.05 ppb in theNorthern Hemisphere; Simpson et al., 2012). A single adjacent CH4 line, located at 2989.981 cm 1 , has been includedin order to obtain C2 H6 data, even under these challengingconditions. In this case, the weak CH4 absorption is not modeled as a free parameter and is hence not used for retrievingthe CH4 mole fraction but for localizing the spectral position/shift parameter of the C2 H6 absorption feature in the absence of a clear C2 H6 signal. The CH4 mole fractions arefixed to the values determined from the previous fit window.Using this approach, we found a clear improvement in theC2 H6 data quality including a higher precision and the abwww.atmos-meas-tech.net/12/1767/2019/1773sence of discontinuities. The associated spectral baseline ismodeled as a second-order polynomial.The CO2 –CO–N2 O fit window covers the entire secondlaser and is the most complex spectral scene. It includes several overlapping absorption features, making the retrieval ofmole fractions of the targeted species challenging. As illustrated in Fig. 5, a single CO2 absorption line is surroundedby two N2 O lines. The CO line is directly adjacent to oneof the N2 O lines. This results in comparatively large signalnoise and increased uncertainty in the retrieved mole fractions due to crosstalk between the N2 O, CO and CO2 absorption lines. However, the spectral range includes anotherN2 O line at 2227.843 cm 1 , which is slightly stronger thanthe other two (see Fig. 5). Our approach is to fix the molefractions of the first two N2 O lines to the stronger third one,in order to reduce the uncertainty in retrieved N2 O and hencethe noise on the CO2 and CO retrieval. The spectral baselinehas been split into two parts, the first covering the first twoN2 O, CO2 and CO lines and the second covering the individual N2 O line only. Both are modeled as second-order polynomials.3.1Water vapor correctionIn the current instrument setup, water vapor is not removedfrom sampled air before entering the sample cell. Therefore,the influence of water vapor on the retrieved mole fractionshas to be corrected in order to report dry-air mole fractions.Here, we correct for both dilution and water broadening effects. The first describes the fact that concentrations appearsmaller when analyzing moist air, although the dry-air molefraction might be constant. This effect can be remedied ifthe absolute water concentration is known for each individual sample using Eq. (1):cd cx ,1 cH2 O(1)where cd is the dry-air mole fraction, cx is the raw concentration of a particular species of interest diluted in moist airand cH2 O is the water vapor concentration (Harazono et al.,2015). Spectroscopic water broadening effects are approximately an order of magnitude smaller than dilution effects;yet they do have to be corrected for to obtain precise measurements. HITRAN’s air broadening parameters are listedfor a particular chemical composition of air excluding watervapor. H2 O, however, can be a more potent broadening agentthan nitrogen or oxygen (Kooijmans et al., 2016).These coefficients have been determined using the setupdepicted in Fig. 6 and are summarized in Table 1. Therefore, the pressure broadening has to be modified to includethis effect. Under dry-air conditions it is common to split thepressure broadening into two parts: self-broadening and airbroadening. The self-broadening coefficient allows computation of the broadening induced by mutual collisions of aparticular species of interest. The air-broadening c
gested a fast calibration procedure to overcome these depen-dencies while maintaining a 90% duty cycle. Here, we describe the setup and performance of our flight-proven (over 100 flight hours) airborne QCL and ICL sys-tem developed for simultaneous airborne measurements of CH4, C2H6, CO2, CO, N2O and H2O. The instrument is