Transcription
Dual interband cascade laser based trace-gas sensor forenvironmental monitoringGerard Wysocki,1,* Yury Bakhirkin,1 Stephen So,1 Frank K. Tittel,1 Cory J. Hill,2 Rui Q. Yang,2and Matthew P. Fraser321Department of Electrical and Computer Engineering, Rice University, 6100 Main Street, Houston, Texas 77251, USAJet Propulsion Laboratory, California Institute of Technology, 4800 Oak Grove Drive, Pasadena, California 91109, USA3Department of Civil and Environmental Engineering, Rice University, 6100 Main Street, Houston, Texas 77251, USA*Corresponding author: gerardw@rice.eduReceived 18 July 2007; accepted 27 September 2007;posted 3 October 2007 (Doc. ID 85453); published 19 November 2007The development of an interband cascade laser (ICL) based spectroscopic trace-gas sensor for the simultaneous detection of two atmospheric trace gases is reported. The sensor performance was evaluated using twoICLs capable of targeting formaldehyde 共H2CO兲 and ethane 共C2H6兲. Minimum detection limits of 3.5 ppbVfor H2CO and 150 pptV for C2H6 was demonstrated with a 1 s integration time. The sensor was deployedfor field measurements of H2CO, and laboratory quantification of both formaldehyde and ethane arereported. A cross comparison of the atmospheric concentration data for H2CO with data collected by acollocated commercial H2CO sensor employing Hantzsch reaction based fluorometric detection was performed. These results show excellent agreement between these two different approaches for trace-gasquantification. In addition, laboratory experiments for dual gas quantification show accurate, fast responsewith no crosstalk between the two gas channels. 2007 Optical Society of AmericaOCIS codes: 280.3420, 300.6360, 300.6320, 280.1120.1. IntroductionElevated concentration levels of ground-level ozoneare the most serious air quality issue facing manyurban areas today. Ground-level ozone is formed bythe photochemical reactions of volatile organic compounds (VOCs) and nitrogen oxides (NOx). Sinceozone is not directly emitted from sources, but ratherformed through atmospheric chemical reactions, airquality improvement plans must incorporate scientific understanding of how emissions, chemistry, andtransport convert precursor VOCs and NOx intoozone. As a result, less progress has been made inattaining the health-based National Ambient AirQuality Standard (NAAQS) for ozone than for otherpollutants regulated by the NAAQS that are directlyemitted from sources (such as carbon monoxide orlead). In order to enable studies of this complexozone chemistry, monitoring of several potentialprecursor molecules is required. Trace gas sensing0003-6935/07/338202-09 15.00/0 2007 Optical Society of Americamethods that can provide in situ, fast ( 1 s response time) and sensitive (at ppb and lower levels)detection of molecules of interest can greatly aide inunderstanding the atmospheric chemistry of ozoneprecursors. All these requirements can be successfully addressed by laser spectroscopic trace-gas detection, which proves to be one of the most sensitivegas sensing techniques and enables in situ realtime measurements of trace gases for environmental [1,2], industrial [3,4], biomedical [5,6], and fundamental science applications [7].The strongest fundamental absorption features ofmolecular species can be found in the midinfrared(mid-IR) spectral region 共 3–20 m兲. There are several mid-IR continuous wave (cw) laser sources thatcan be used for chemical sensing, e.g., semiconductorlasers, high power gas lasers (e.g., CO2 and COlasers), or nonlinear frequency conversion basedmid-IR sources such as difference frequency generation sources or optical parametric oscillators. Due totheir compact size and relatively simple operationrequirements, semiconductor sources tend to be themost widely used in field instrumentation. For many20 November 2007 兾 Vol. 46, No. 33 兾 APPLIED OPTICS8202
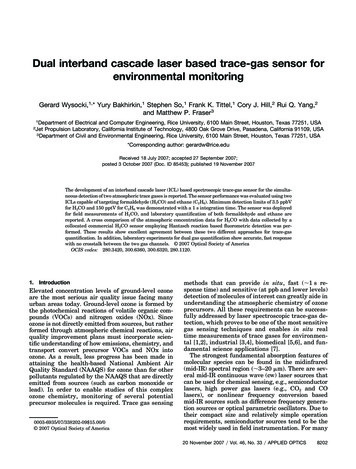
years, semiconductor diode lasers based on lead alloysemiconductors (e.g., PbSnTe) have been used asspectroscopic mid-IR light sources [1,8]. However,low output powers 共 0.1–1 mW兲 and laser frequencyinstability caused by the thermal cycling stronglylimit their reliability and range of applications. In therecent decade, rapidly developing new mid-IR semiconductor laser technologies such as interband cascade lasers (ICLs) and quantum cascade lasers(QCLs) have provided more reliable and viable lasersources for expanded applications of mid-IR laserspectroscopy. QCLs offer high power (up to 500 mWcw), room temperature operation, broad spectral coverage 共3–170 m兲, small size, and commercial availability. However, material systems that can providereliable operation of QCLs at wavelengths shorterthan 4 m are still under development. This spectralregion, which contains absorption bands associatedwith a fundamental vibrational mode of the C—Hmolecular group stretch in a number of molecules(especially hydrocarbons), is accessible using ICLtechnology. Availability of ICLs operating in cw nearroom temperatures ( 260 K accessible with singlestage thermoelectric coolers) is still limited, buthas been demonstrated in the Fabry–Perot version[9,10,11] and in the distributed feedback (DFB) version with stable single-mode operation [12]. At lowtemperatures (e.g., 80 K), ICLs exhibited high cwpowers 共 100 mW兲 and extremely low threshold current density (e.g., 5 A兾cm2 [11]) with low powerconsumption. The progress in this technology hasbeen rapid, and room temperature cw operation isexpected to be widely available with further development in the near future. In the meantime, however,systems based on ICL technology require cryogeniccooling of these laser sources.Due to limited wavelength coverage of an individual laser source, laser spectroscopic trace-gas sensorsare very often limited to a single molecular speciesthat can be targeted with a particular laser. The capability for a single sensor to quantify multiple gasspecies is of great importance to atmospheric chemistry [1,13,14]. In order to address this issue, in thiswork we report on the development of a dual semiconductor laser based spectroscopic trace-gas sensor,which is capable of employing any type of mid-IRsemiconductor laser that requires an operating temperature anywhere between LN2 temperature 共77 K兲and room temperature (RT). The sensor platform wasevaluated using two ICLs operating at cryogenic temperatures and targeting molecular absorption lines offormaldehyde 共H2CO兲 and ethane 共C2H6兲, at 3.56 mand 3.33 m, respectively. Field tests of the sensorwere performed in August and September 2006 during the Texas Air Quality Study II measurementcampaign (TexAQS II).LN2 dewar (Cryo Industries; custom LN2 dewar). Thedewar is equipped with two separately temperaturecontrolled cold fingers, which allows the use of twolasers with different operating temperatures. Thetwo laser beams are collimated using two ZnSe aspheric lenses (diameter d 25 mm and focal lengthof f 12.5 mm). For beam tracing purposes a dichroicmirror (ISP Optics, model BSP-DI-25-3) was used tocoalign a He–Ne laser beam 共 630 nm兲 with one ofthe mid-IR lasers. The collimated mid-IR beams,which are 20 mm in diameter, are overlapped usinga pellicle beam splitter (Thorlabs, model BP145B4,splitting ratio 45兾55%). The beam splitter providestwo dual-color laser beams in two separated opticalchannels that are used as a sample and referencebeam for further concentration measurements. Thethickness of the pellicle membrane is negligible, allowing suppression of beam ghosts, formation ofsmall free spectral range (FSR) etalon fringes (onlylong FSR etalons can occur, which are much broaderthen the laser scan range), and minimal beam displacement (particularly important for a two laser system where both beams in the two channels must bewell overlapped). The size of the sample beam is reduced to 2.5 mm using an optical telescope consisting of two ZnSe lenses: (1) d 25 mm, f 25 mm,and (2) d 6 mm, f 3 mm. The sample beam wassubsequently coupled to a 100 m astigmatic Herriottmultipass cell using an additional BaF2 lens (d 25 mm, f 500 mm). The beam exiting the multipass cell is focused onto a thermoelectrically cooledmercury-cadmium-telluride (MCT) photodetectorusing an off-axis parabolic mirror (d 25 mm,f 75 mm). The reference beam is used for laserwavelength monitoring and is directed through tworeference gas cells containing high concentrationsamples of target gases. The intensity of the referencebeam is monitored using a second thermoelectricallycooled MCT detector. The output signal from eachdetector (sample and reference) is amplified by a dedicated transimpedance preamplifier and measured bytwo lock-in amplifiers (see next section for furtherdetails). The in-phase components of the measuredsignals are acquired and then analyzed by a laptopcomputer equipped with a data acquisition card (National Instruments, model NI-DAQ 6062E). The system is equipped with an automatic LN2 refillingsystem, which enables 72 hours of autonomous sensor operation. The overall system is controlled byself-developed LabView based software, which provides real time data acquisition and analysis, systemcontrol (including gas handling systems and LN2monitoring) and periodic self-calibration. When anInternet connection is available at the measurementsite, the sensor can be operated remotely.2. Experimental DetailsWavelength modulation spectroscopy (WMS) is usedas a primary trace-gas detection method. This allowsdual laser trace-gas measurements to be performedsimultaneously at two different wavelength modulation (WM) frequencies [15]. More than two channelsA.Sensor ArchitectureThe sensor architecture is schematically shown inFig. 1. Two semiconductor lasers are mounted in a8203APPLIED OPTICS 兾 Vol. 46, No. 33 兾 20 November 2007B.Trace-Gas Concentration Measurements
Fig. 1. (Color online) Schematic configuration of a dual ICL based trace gas sensor: ICL, interband cascade laser chip; DCM, dichroicmirror; BS, pellicle beam splitter; MCT, mercury-cadmium-telluride photodetector; CL, collimating lens; PM, off-axis parabolic mirror; OT,optical telescope, NI-DAQ, National Instruments data acquisition card.can be introduced on one sensor platform without theneed of increasing the number of photodetectors(costly in the mid-IR spectral region), and without theneed for individual laser beam paths for each channel[1,13,14]. The software also allows configuration ofthe sensor for direct absorption measurements (withno sinusoidal WM), but in this mode only one laser ata time can be operated (dual laser operation can onlybe performed by alternating the laser duty cycles).Each laser is supplied with a slow 共10 Hz兲 sawtooth current waveform to perform a wavelength scanthat covers the spectral region of interest (typically0.5–1 cm 1). In addition to a slow current ramp, theWM is performed using a high frequency sinusoidalcurrent waveform at frequencies f1 19 kHz andf2 24 kHz added to the current waveforms of eachrespective laser. By using separate phase sensitivedetection of the second harmonic at both modulationfrequencies, the in-phase components of the 2f absorption signals originating from each laser can bemeasured using a single detector [15]. For the appliedmodulation parameters the data acquisition electronics allowed the collection of 5000 spectral pointswithin each wavelength scan. The acquired spectralscans were averaged and then processed to calculatethe concentration.2f WMS measures the second derivative of themeasured absorption line shape, thus increasing20 November 2007 兾 Vol. 46, No. 33 兾 APPLIED OPTICS8204
the immunity to slow baseline drifts and 1兾f noise.This significantly improves instrument sensitivityin comparison to direct absorption spectroscopicmeasurements (typically by one order of magnitude). However, for concentration measurements,analytical or numerical simulation of 2f referencespectra requires a significantly more complex dataanalysis that takes into account such parameters asabsorption line shape, optical power, laser wavelength modulation depth, calibration of the wavelength scan, residual modulation of the laser power,and detector response. Although precise modelingof the 2f spectra is theoretically feasible, in practicethe 2f WMS based trace-gas sensors are usuallycalibrated using reference calibration gas mixtures[2,3]. In this work, the concentration is calculatedby the correlation of a measured 2f spectrum with areference spectrum, which is acquired for a knowncalibrated gas standard and stored in computermemory [2]. An important advantage of this technique is its capability to perform high precision gasconcentration measurements (accuracy of the absolute instrument calibration is primarily related tothe precision of the applied certified gas standard)without the need to determine any of the previouslymentioned parameters, which are required for 2fspectra simulation. The fitting procedure uses aleast-squares linear fit that employs a singularvalue decomposition (SVD) algorithm and is performed in real time (time between the consecutiveconcentration data points is determined by thenumber of spectral scans averaged).Even small instabilities of the laser temperaturecan cause a spectral shift of the wavelength scan,which can lead to significant errors in the averageddata [16]. The temperature controller (LakeShore,model 340) and silicon diode temperature sensorsprovide a control stability of 25 mK. Thermal fluctuations are usually slow and can be corrected usingadditional control loops employing fast laser wavelength tuning by means of the laser driving current.This technique can be used in a line-locked systemthat performs measurements at a single wavelength[3] as well as in a system performing laser frequencyscanning of a spectroscopic feature of interest [5]. Ina spectroscopic sensor that uses wavelength scanning, spectral channel shifting can be performed insoftware [16]. Such a method was applied in our system to eliminate laser frequency drifts caused bytemperature fluctuations and other instabilities. Thewavelength shift is determined using the 2f spectrumacquired in the reference channel and then applied tothe data collected in the sample channel. In our system, two reference cells containing pure H2CO andC2H6, respectively, were used. However, any moleculethat has absorption features within the laser scancan be used for such a wavelength correction.C. Laboratory Based Performance TestsA laboratory evaluation test of the sensor was performed using two ICL lasers operating at 3.56 mand 3.33 m, respectively. Both lasers employed an8205APPLIED OPTICS 兾 Vol. 46, No. 33 兾 20 November 2007Fig. 2. (Color online) Simulated absorption spectrum of 10 ppbVH2CO near 3.56 m showing interferences including H2O (1000ppm), CH4 (2 ppm) and N2O (300 ppbV) at 75 Torr and with a100 m effective optical path length.embedded distributed feedback grating for singlemode operation and could be operated in a cw modeup to temperatures of 150 K.The frequency of the 3.56 m ICL tunes between2805.7 and 2808.3 cm 1 by changing the temperatureof the chip from 120 K to 90 K. This laser experienceda tendency for multimode generation, especially whenoperated at low temperatures and high driving currents. Single mode operation was obtained by carefulselection of the cold finger temperature and the lasercurrent. Within the overall laser tuning range, severalstrong absorption features of formaldehyde 共H2CO兲,one of the important molecules in ozone chemistrystudies, can be used for sensitive concentration measurements (see Fig. 2). As depicted in the simulation spectrum of H2CO absorption together with theabsorption spectra of other molecules, which can causethe strongest spectral interference in this frequencyrange, the absorption line at 2806.87 cm 1 is the mostsuitable for sensitive formaldehyde detection. Thestrongest interference is caused by water 共H2O兲. Unlike the other interfering species [methane 共CH4兲, 2 ppm in the atmosphere and nitrous oxide 共N2O兲 300 ppbV in the atmosphere], H2O at normal atmospheric concentration levels ( 1.6% calculated for50% relative humidity at 25 C) will significantly affect the measurements. The maximum acceptableH2O concentration level, which provides minimaleffects on the H2CO measurements, is 0.1% ( 3%relative humidity). There are several other H2CO absorption lines in the 3.5 m region, which are moreoptimal for sensitive measurements of H2CO traces(e.g., 2734.2 cm 1, 2749.2 cm 1, 2754.9 cm 1, 2759cm 1, 2831.64 cm 1 [8], and 2869.85 cm 1); however,these spectral features cannot be targeted with thepresently available ICL.The frequency of the 3.33 m ICL can be tunedthermally between 2991 and 2999.5 cm 1 by changingthe temperature of the chip from 140 K to 90 K. Thislaser had a layer of antireflection coating 共 5%兲 onits front facet and exhibited excellent single modeoperation with a side mode suppression ratio of
Fig. 3. (Color online) Simulated absorption spectrum of 1 ppbVC2H6 near 3.33 m showing interferences including H2O (3%), andCH4 (2 ppm) at 75 Torr and with a 100 m effective optical pathlength.SMSR 20 dB. Sensitive concentration measurements of ethane 共C2H6兲, which is an important molecule for environmental (C2H6 is tropospheric ozoneprecursor and tracer for anthropogenic emissions)[17,18] and medical (C2H6 is a biomarker for oxidativestress) [6] applications, can be performed in this spectral region. The optimum absorption line with minimal interference from other molecular species can betargeted at 2996.88 cm 1. A simulation of the C2H6absorption together with the absorption spectra ofpossible atmospheric spectral interferences (3% ofH2O and 2 ppm of CH4) is shown in Fig. 3.The sensitivity of the sensor was evaluated by measuring low concentration gas mixtures of C2H6 andH2CO. The gas mixtures and zero gas (ultrahigh purity N2) were alternated by the gas handling systeminto a multipass cell.The C2H6 channel was tested using a certifiedmixture of 100 ppbV 共 2%兲 of C2H6 in N2 (MathesonTri-Gas). All measurements were performed at apressure of 75 Torr, which was optimized for thebest selectivity and sensitivity. The scattering ofthe concentration measurements for both C2H6 mixture and the zero gas yielded a standard deviationof 150 ppt for 1 s integration time (see Fig. 4).Fig. 4. Continuous monitoring of C2H6 performed over period of 20 min with a zero gas and 10 min with 100 ppbV mixture ofC2H6 in N2 flowing through the sensor system.Stable concentration readings during a 20 minperiod indicate good sensor stability. A bandwidthnormalized minimum absorption detection limit of 3.6 10 5 Hz 1兾2 (1 ) was calculated for the C2H6detection channel.A similar test was performed for the H2CO channelusing a certified permeation based gas standard generator (Kin-Tek, model 491M). A standard deviationof the data points of 3.5 ppbV was observed for1 s integration time, which yields a bandwidth normalized 1 minimum absorption detection limit of 2.1 10 4 Hz 1兾2. The factor of 6 lower performanceof the H2CO channel is mainly related to the lowerspectral purity and instabilities of the 3.56 m ICLavailable for this work.The dual laser operation performance test was carried out using a custom mixture of 79 ppbV of C2H6and 330 ppbV H2CO in N2 as a buffer gas. Thelinearity and the response time of the sensor wereevaluated by diluting the custom gas mixture withpure N2. The time series of the concentration measurements showing a five step dilution of the gasmixture (the steps correspond to a fraction of theinitial concentration level of x 1.0, 0.8, 0.6, 0.4, 0.2,and 0.0), and the subsequent reinjection of the initialmixture to the sample gas cell is presented in Fig.5(a). The sensor response versus the dilution ratioFig. 5. (Color online) (a) Optical sensor response for two-channeloperation targeting ethane 共3.33 m兲 and formaldehyde 共3.56 m兲.The initial gas mixture of 330 ppbV H2CO and 79 ppbV C2H6 isgradually diluted by pure N2. (b) Concentration measurements ofethane and formaldehyde normalized to their initial concentrationlevel versus the dilution ratio (the error bars correspond to theprecision of the dilution process).20 November 2007 兾 Vol. 46, No. 33 兾 APPLIED OPTICS8206
shows a linear trend, which is depicted in Fig. 5(b)(the horizontal error bars represent the precision ofthe dilution). The measurements were performed using a gas flow of 0.6 standard liter per minute. Theoverall volume of the sensor gas cell and the gashandling system recalculated for standard atmospheric pressure is 0.5 liter. This corresponds to atime of 50 s required for a complete gas exchangewithin the sensor volume. As shown in Fig. 5(a) a gasexchange time of 80 s was observed using the sensorresponse to step changes in the C2H6 concentration(time required to reach 90% of the signal level), whichreasonably agrees with the expected system evacuation time. The time lag measured using the H2COtime series corresponds to 99 s. This slower gas exchange is primarily determined by the chemical properties of H2CO, which is a reactive species, soluble inwater and known to adsorb easily to the walls ofsensor system. To minimize the uncertainties in theH2CO concentration measurements the system wasoperated with a constant gas flow.The system was also tested for optical channelcrosstalk in order to verify the quality of the measurement employing a single detector approach forphase-sensitive detection of two WMS signals at different modulation frequencies. In this test the samecustom mixture ( 79 ppbV of C2H6 and 330 ppbVH2CO in N2) was diluted with a certified mixture of100 ppbV of C2H6 in N2. This allowed a decrease of theH2CO concentration proportional to the dilution rate,while simultaneously increasing the initial C2H6 concentration based on the blend proportions. The timeseries of the concentration measurements showing afive step dilution process is depicted in Fig. 6. Similardilution ratios to the previous test were used (x 1.0, 0.8, 0.6, 0.4, 0.2, and 0.0). The dotted linesindicating the concentration values Cx for each levelof ethane concentration are calculated using the initial value of 79.4 ppbV and the dilution factor x usingCx 79.4x 100共1 x兲. Excellent agreement of theexpected value and the actual sensor reading can beclearly observed, which confirms the sensor linearityand demonstrates no crosstalk between the channels.Fig. 6. (Color online) Two-channel optical sensor response toethane and formaldehyde concentration in case of dilution of theinitial gas mixture (same as in Fig. 5) with a mixture of 100ppbV C2H6 in N2.8207APPLIED OPTICS 兾 Vol. 46, No. 33 兾 20 November 2007D. Interband Cascade Laser Based Trace-Gas SensorField TestIn the Greater Houston area, where emissionsfrom high concentration of petrochemical industrialsources combine with emissions from more traditional urban sources, the NAAQS for ozone is violatedon roughly 45 days every year. Recently, emissions ofvolatile organic compounds (VOCs) from industrialsources have become the focus of air quality improvement plans in Houston, which are designed to reduceambient ozone levels. Using aircraft sampling platforms and collecting whole air samples in evacuatedstainless steel canisters that were then returned to alaboratory for analysis by gas chromatography, quantification of VOCs from industrial sources indicatedsignificantly higher concentrations than expected[19,20]. Using this type of data and models of atmospheric dispersion, it has been estimated that theemissions for VOCs from industrial sources in Houston exceed previously estimated emissions by a factorof 5–10 [19,20]. As a result, the uncertainty in theemission inventory for VOCs is a major concern forair quality improvement plans in Houston.Hence two of the most important trace gases tomonitor for their ozone formation potential in Houston are ethylene 共C2H4兲 and formaldehyde 共H2CO兲.Ethylene rapidly undergoes chemical oxidation, leading to the formation of both ground-level ozone andalso formaldehyde. Rapid quantification of these twogases (formaldehyde and ethylene) simultaneouslyleads to an improved understanding of the chemistryof ozone formation. As demonstrated in the laboratory tests, the developed sensor in its present configuration is able to monitor H2CO at ppb level, which issuitable for the atmospheric studies. Our initial goalwas to configure the developed sensor to target bothmolecules (H2CO and C2H4) simultaneously; however, at the time of our scheduled field test a suitableICL targeting the ethylene was not available. TheICL based sensor described in this paper wasdeployed at the sampling site at the University ofHouston main campus, which was one of the intensive monitoring sites in Houston during the TexAQSII campaign in August–September 2006. At this sitea commercial formaldehyde sensor using Hantzschreaction-based fluorometric detection was deployedby a research group from University of Houston leadby B. Rappenglueck, which provided an excellent opportunity for data intercomparison between an optical sensor and the traditional chemical technique.As discussed in the previous section, the H2COmeasurements can be performed reliably when thehumidity of the sample gas is kept at 3% or lowerrelative humidity level. During the summer months,the relative humidity in Houston is 90%, and themeasurements could only be performed by using anair dryer at the system inlet. A very reliable andconvenient gas dryer can be constructed using Nafionmembrane tubing. It has been suggested [21] andverified in our experiments that concentration ofH2CO is affected when drawn through the Nafion
Fig. 7. (Color online) Continuous measurements of H2CO collected during 5.5 day period with atmospheric data acquired at thesampling site.dryer. Alternatively, efficient drying can also be performed using cooling traps. Under normal conditions,the freezing point of formaldehyde is at 155 K (a LN2cooling trap cannot be applied). A dry ice (solid CO2)cooling trap with temperature of 194.6 K was therefore chosen for our H2O trap in the system. The vaporpressure of H2CO at this temperature is 20 Torr,which corresponds to a concentration of 2.6% atatmospheric pressure and is much higher than theexpected atmospheric levels of H2CO. Thus the measured H2CO level should not be affected. This wasconfirmed during our experimental testing of thecooling trap in which the detected H2CO levels andthe sensor response time were identical with andwithout the cooling trap present at the sampling port.Similar behavior is also expected for C2H4, which isless reactive and water soluble than H2CO, with saturated vapor pressure of 3000 Torr at dry ice temperatures. During the field test, a 10 m samplingtube was used to deliver the atmospheric air to thesensor before the cooling trap. The tube was equippedwith a resistive heater and kept at 40 C to avoidwater condensation on the tube walls.The laser dewar required periodic LN2 refilling,which determined the actual measurement cycle. After each LN2 refilling, a 20 min cool-down period wasrequired to let the system stabilize thermally. Thecalibration and measurement sequence was initiatedafter the cool-down period. The pattern consisted ofthe following: (1) full calibration (including zero gasmeasurement followed by a reference gas measurement) performed after each LN2 refilling; (2) samplemeasurement (10 min); and (3) zero gas calibration(occurred periodically after each 10 min sampling period until the next LN2 refilling). The time betweenLN2 refillings was primarily determined by the totalpower dissipation within the dewar, which includesthe dissipation of the ICLs and the dissipation in theresistive heaters used for temperature control of thecold fingers. In the present configuration the refillingprocess occurred every 6 hours. To assure uninterrupted operation of the system, a 50 liter LN2 reservoir had to be refilled every 72 hours. An exampleseries of data collected continuously during a 5.5 dayFig. 8. (Color online) Mean level and maximum level of H2CO concentration (ppbV) versus wind direction calculated using data from Fig.7 (data averaged within 15 angles). The map on the right shows the sampling site (marked with “夡”) and major VOC sources in theGreater Houston area, Harris County [22].20 November 2007 兾 Vol. 46, No. 33 兾 APPLIED OPTICS8208
Fig. 9. (Color online) Measurements of H2CO collected during 2week period with ICL-based trace gas sensor and with Hantzschreaction based fluorometric detector. The inset shows a correlation ofR 0.7734 between data collected by the two different sensorslocated at the same sampling site.period is shown in Fig. 7. As shown in the samefigure, other atmospheric data such as wind directionand speed, temperature, and precipitation were alsocollected at the sampling site, which by appropriatecorrelation allows for more accurate atmosphericchemistry studies. The H2CO measurements over theperiod 7–11 September 2006 were correlated with thewind direction, and the results are plotted in Fig. 8.Both the mean level and the maximum level of H2COconcentration versus wind direction binned within15 angle sections show clearly the industrial originof H2CO from the major VOC sources in Houston,Harris County (see the map in Fig. 8 for Ref. [22]).During a 2 week period between September 14thand 30th in 2006, the formaldehyde data collected bythe ICL-based sensor could be correlated with thedata collected by the Hantzsch reaction based fluorometric H2CO sensor. Both sensors were deployed atthe same sampling site; however, two different sampling ports were used to deliver the ambient air toeach separate sensor. The results of this comparisonare presented in the Fig. 9. The overall trend of bothmeasurements is in very good agreement, and a correlation coefficient of R
length modulation depth, calibration of the wave-length scan, residual modulation of the laser power, and detector response. Although precise modeling of the 2f spectra is theoretically feasible, in practice the 2f WMS based trace-gas sensors are usually calibrated using reference calibration gas mixtures [2,3]. In this work, the concentration .