Transcription
No. 599 / June 2018Counterparty credit risk and theeffectiveness of banking regulationSînziana Kroon and Iman van Lelyveld
Counterparty credit risk and the effectiveness of bankingregulationSinziana Kroon and Iman van Lelyveld ** Views expressed are those of the authors and do not necessarily reflect official positionsof De Nederlandsche Bank.Working Paper No. 599June 2018De Nederlandsche Bank NVP.O. Box 981000 AB AMSTERDAMThe Netherlands
Counterparty credit risk and the effectiveness ofbanking regulation*Sînziana Kroona and Iman van Lelyvelda,babDe Nederlandsche BankVU University AmsterdamJune 2018AbstractWe investigate how counterparty credit risk influences the prices of over-the-counter CDScontracts using confidential transaction level data for practically all Dutch trades. Weconfirm our prior of a significant negative relationship between the credit worthiness ofthe CDS seller and the price of the CDS contract. We find that an increase of 100 basispoints in the credit spread of the seller, decreases the price of the CDS contract by 7.2basis points. Also, the larger the size of the CDS contract the lower the price of the CDScontract. Finally, we find that regulatory exemptions have a statistically significant buteconomically negligible impact on CDS pricing: Transactions exempted from bankingcapital requirements for Credit Valuation Adjustment risk – mostly banks transacting withnon-financial institutions, sovereigns and pension funds – trade 0.14 basis points lower,all else equal.Keywords: OTC market, counterparty credit risk, credit default swap.JEL classifications: G10, G12, G14, G20, G23.*We thank Damiaan Chen, Michiel Marck, Hiroko Matsumoto and colleagues at De Nederlandsche Bank fortheir input. All remaining errors are ours. The opinions expressed in this paper are the authors’ personalopinions and do not necessarily represent those of De Nederlandsche Bank. Corresponding author:s.kroon@dnb.nl
1.IntroductionCounterparty credit risk emerged to be a key contributor and driver of a significantportion of the losses during the global financial crisis. This type of risk is characteristic to over-the-counter derivative markets, which at that time were opaque anddifficult to monitor, encouraging the build up of concentrated positions.When Lehman Brothers defaulted in 2008, the direct effect of counterpartycredit risk (CCR) on its counterparties became visible. Concerns about systemicdefaults increased the credit spread of large dealer banks up to extreme values, evenas high as 500 basis points. Since the default of a dealer bank became a conceivablepossibility, the value of credit protection sold by these banks dropped significantlycausing losses to buyers. These losses are the materialization of Credit ValuationAdjustment (CVA) risk, and have caused a quarter of the trading book losses ofBritish banks (EBA (2015)).The financial crisis gave rise to many discussions about the large impact ofOTC derivatives markets on financial stability and systemic risk and therefore several regulatory initiatives followed. In 2009, the G20 Leaders agreed to reformsthat increase transparency and market discipline. The Dodd-Frank Act and theEuropean Market Infrastructure Regulation framework (EMIR) followed in the USand Europe, respectively. These reforms introduced requirements for mandatoryclearing of standardized OTC contracts and mandatory reporting of all OTC transactions to trade repositories. As a result of these reforms, all OTC transactions inEurope started to be reported to trade repositories (TRs) in February 2014.1As for the capitalisation of CCR by banks, the Basel Committee on BankingSupervision (BCBS) strengthened the banking capital requirements for the defaultof a counterparty (also known as the CCR charge) and introduced a new capitalcharge for the Credit Value Adjustment to ensure higher capital requirements fornon-centrally cleared derivatives. These banking risks have become two of thehighest profile risks faced by banks active in the over-the-counter financial markets.The European implementation of the Basel CVA rules diverges from the Basel1 Currently six TRs are in operation, namely CME Trade Repository Ltd., DTCC DerivativesRepository Ltd., ICE Trade Vault Europe Ltd., Krajowy Depozyt Papierów Wartościowych S.A.,Regis-TR S.A., and UnaVista Limited.2
rules in terms of coverage. From the various types of counterparties that are trading OTC derivatives, corporates, sovereigns and pension funds have been exempted(CRR (2013)). At the time of drafting the regulation, one of the reasons to allow forexemptions was to avoid an increase in the price paid by these entities for the derivatives they bought. The EU implementation of the Basel CVA standard is however“not compliant” because its scope deviates significantly from the scope coveredin the Basel Accord. The BCBS Regulatory Consistency Assessment Programme(RCAP) findings conclude as much (BCBS (2013)).The exemptions are, however, not expected to last forever. The European Banking Authority, for instance, notes: "Overall, the EBA is of the opinion that EU exemptions on the application of CVA charges should be reconsidered or removed,since they leave potential risks uncaptured" (EBA (2015)). Our analysis studiesthe impact of the regulatory exemptions in the CDS market and this analysis canbe useful in the policy debate on the impact of the removal of the exemptions.Research on how counterparty credit risk is priced is scarce, and none of it usesEuropean data. This is due to a lack of granular data available at transaction level.The newly available derivatives data set gathered by trade repositories allows usto study CCR. Our paper aims to understand whether and how markets price CCRwhen selling CDS contracts bilaterally. In addition, we also take a close look atthe impact of regulation on pricing for transactions with counterparties that areexempted by the EU regulation.We use a data panel set containing banks active in the European market in 2016to understand whether prices of single name CDS contracts sold are influenced bythe credit risk of their seller. This would be proof that the markets price in theCCR risk. Our empirical approach is to estimate the transaction spread of the samesingle-name CDS contracts, traded on the same day, bought by the same buyer, butsold by different sellers which differ in term of credit worthiness.In line with previous US studies, we find that CCR is priced in the value ofcredit derivatives. In our study, however, CCR has a larger impact than in theprevious studies. Furthermore, the size of the contract influences pricing; the CDScontract trades 2.65 basis points lower if the notional increases by e1 million.What is truly novel, is that regulatory exemptions have a significant impact on theprice of CDS contracts which trade 0.14 basis points lower than those contracts3
with counterparties that are not exempted.Our paper is structured as follows. In Section 2 we explain how our researchrelates to the existing literature followed by an overview of the post-crisis developments in the CDS market in Section 3. In Section 4 we present the data andhypothesis we use. In Section 5 we present the methodology, followed by the results in Section 6, robustness tests in Section 7 and, finally, conclusions in Section 8.2.The CDS market and counterparty credit risk2.1.Existing literatureThere is limited but growing literature studying the effects of counterparty creditrisk on derivative markets. An early study by Segoviano and Singh (2008) onCCR in the over-the-counter derivatives market emphasises the importance of CCRlosses and is the first to discuss policy changes that should follow the global financial crisis. Specifically for the CDS market we are aware of three publications.Arora et al. (2012) were the first to analyse CDS transaction data obtained froman US asset manager. They find that counterparty credit risk is priced although themagnitude of the effect is extremely small, almost negligible in size. The authorspoint out that an increase of 100 basis points in the credit spread of dealer translatesto a 0.15 basis points decrease in the price of the credit protection. Our analysis ona much more recent, European data set, reveal a 64 times larger larger effect: anincrease of 100 basis points in the seller’s credit spread would already translate to7.2 basis point decrease in the price of the CDS.Du et al. (2015) analyse a granular CDS data set with US transactions andalso find that counterparty risk has an effect on the pricing of CDS contracts: 100basis points increase in the sellers credit worthiness results in a decrease of 0.6basis points in the CDS price. The authors also study the effect of CCR on thechoice of counterparties. Du et al. (2015) conclude that counterparty credit riskis managed mostly by choosing the right counterparty. Their evidence shows thatdealers search for counterparties with high credit worthiness and low correlationto the underlying of the CDS contract. In other words, buyers of protection try toavoid wrong-way risk. They also find that transaction spreads of centrally clearedtrades are significantly lower compared to the spreads of uncleared transactions.4
Moreover, when controlling for past trading relations and the identity of the buyerand seller, they find that relations do not have an effect on transaction spreads.A recent contribution using OTC CDS data as well is Iercosan and Jiron (2017).The authors show that the execution cost of a CDS transaction can partially beexplained by the trading relationships, counterparties’ trading activity level andtrading networks. Their paper uses CDS data from DTCC as well and focuseson analyzing the effect of counterparties’ matching and negotiation abilities onthe terms of trade of CDS contracts, under incomplete information about marketliquidity and quotes.Hau et al. (2017) investigate the OTC FX market and find out that less sophisticated clients pay higher spreads on FX contracts. The authors make a case formoving FX OTC trading to multi-dealer request-for-quote platforms because theyeliminate discriminatory pricing and thus introduce competitive spreads regardlessof the sophistication of the clients.2.2.Assumptions and background on how CCR worksCounterparty credit risk is the risk that a counterparty in a financial derivative contract will default prior to the expiration of the contract and/or will fail to makefuture payments. Counterparty risk concerns both parties in an over-the-counter(OTC) derivatives contract for all asset classes. Financial institutions, whilst making use of risk mitigation factors such as collateralisation and netting, will still beexposed to a significant amount of counterparty risk which needs to be managedand priced appropriately. Since the financial crisis, financial institutions have builtup their capabilities for handling counterparty risk and active hedging has alsobecome more common, largely in the form of buying credit default swap (CDS)protection. Nowadays, most banks have a dedicated counterparty risk managementunit which will charge a premium to each business line to bear the counterparty riskof a new trade, taking advantage of portfolio level risk mitigation factors such asnetting and collateralisation (Gregory (2013)). Such risk management has severalimportant features detailed below.First, we do not observe the contractual terms of the CDS contracts and – similarto other studies – we cannot study the effect of (cross asset class) netting setsand collateralisation. We therefore maintain the assumption that collateralisation5
cannot mitigate counterparty credit risk completely. This is especially true in timesof stress when netting and collateral is not enough to cover potential losses fromcounterparty credit risk that arise from sudden increases in derivatives negativeexposures.Second, during the time period of our data sample, central clearing of CDS contracts was not mandatory and thus not yet a feasible option to mitigate counterpartycredit risk in Europe. In our sample, only a limited number of transactions are centrally cleared – i.e. only 1% of the 20,000 transactions in our sample. In Europe,mandatory clearing of index CDS contracts is enforced only since February 2017and only for certain types of counterparties that are already clearing members.2Third, Acharya et al. (2016) show that financial institutions tend to purchasemore protection on a dealer as reference entity when exposed to that dealer throughcounterparty risk. Buying a CDS contract referencing the counterparty to which aninstitution has a large derivative exposure to, is the most straightforward manner tohedge CCR. These hedges are not perfect because they introduce risk by increasing the sensitivity of the profit and loss account to other risk factors (i.e. marketrisk factors) and they are generally costly to put in place. This is why in practiceCCR hedging is executed mostly by large dealers banks. Our working assumptions regarding hedging is that most counterparties do not pursue hedging CCR ona large scale. This assumption is in line with the findings of Oehmke and Zawadowski (2017) who investigated the motivations for trading in CDS markets and theeconomic function these markets perform. They find that speculative trading concentrates in the CDS market, and hedging is motivated mostly by high volumes inbonds and CDS markets.Fourth, another method to reduce CCR is to actively choose counterparties thathave a low correlation with the underlying of the CDS contract. For example,an institution could actively avoid buying a CDS contract on a Dutch underlyingfrom a Dutch counterparty. In this way, decreasing the correlation between thecounterparty and the underlying entity increases the odds that the insurance paysoff in case the underlying actually defaults.Fifth, counterparty credit risk can be reflected in the price of the derivative via2 See /otc-derivatives-and-clearing-obligation6
the credit risk adjustment. The CVA is the difference in the intrinsic value of thederivative that is CCR free and the derivative value when counterparty credit riskis present. This is why the CVA is also known as the price for bearing the CCR– it does not address CCR. In that sense, it can be seen as a premium. Only additional capital held by the institution against CVA can absorb potential losses arisingfrom value changes caused by changes in the credit worthiness of the counterparty.Logically it follows that CVA losses are smaller than CCR losses.Sixth, to diversify counterparty credit risk and limit building up large concentrated positions to one counterparty, it is common market practice to split large tickets into smaller trades and execute them with several counterparties. This meansthat a counterparty will purchase a CDS contract with the same features and underlying from several counterparties at the same time or trading day. Besides avoidingconcentration risk, this type of trading behavior is also encouraged by the EuropeanMarket Infrastructure Regulation (EMIR) that requires non-financial counterpartiesto maintain their positions beneath a threshold of e15 million in order to avoidclearing and daily margining.And finally, a method to reduce exposure to CCR is the newly available tool ofportfolio compression. In a nutshell, portfolio compression is a post-trade operation that reduces market gross notional without affecting participants’ net marketrisk positions. It accomplishes this by netting out opposing trades and replacingthem with a new contract. Multilateral compression can impact counterparty creditrisk since more than two counterparts are involved and the net exposure amongthem can change (D’Errico and Roukny (2017)).3.3.1.Post crisis developments in the CDS MarketStandardisation of CDS contractsWith the aim to standardise the market and increase liquidity, the InternationalSwaps and Derivatives Association (ISDA) adjusted the standardised documentation for single name CDS contracts in its Big Bang of April 2009. Both the regularcoupon payments made by single-name CDS and the default-contingent paymentsbecame standardised, making CDS contracts easy to compare, price, and trade.7
The standardisation of coupon payments was achieved by the introduction of alimited set of standard coupon rates. In combination with standard contract sizes,these fixed the size of coupon payments, which were already paid on standard dates(the 20th of March, June, September and December). Counterparties now settle thedifferences between the appropriate premium and the chosen standard coupon ratethrough an upfront payment. The final goal of having standard coupon rates andstandard contract sizes is to equalise cash flow payments.The Big Bang also standardised default-contingent payments, harmonising thetriggers of credit events and their consequences for all CDS contracts and reducingthe scope to disagree about whether credit events have occurred. This also helpedharmonise payments for different contracts on the same reference entity, which arenow established via an auction system. Overall the Big Bang protocol ensures thatall protection sellers transfer the same amounts to the protection buyers and that alloutstanding contracts are affected by the same credit events. For a comprehensiveoverview of credit default swaps, including their regulatory development we referto a survey by Augustin et al. (2014).3.2.Market trendsThe notional amount of outstanding credit default swaps grew rapidly to a peak ofalmost 60 trillion at the end of 2007, but then declined sharply to just over 31trillion in the middle of 2010. Vause (2010) argues that the decline did not occurbecause the CDS market lost its appeal in light of continuing market unrest becausetrading volumes have continued to rise. Instead, he argues that the sharp drop inthe volume of outstanding CDS reported in the BIS statistics is due to post tradecompression of CDS transactions. This results in the reduction of the notional andtherefore the reduction of banks’ exposure to counterparty credit risk (cf. Aldasoroand Koch (2017)).Since 2009, CCPs also contribute to the reduction of CDS gross nationals andtherefore the reduction in CCR exposure. The table below provides an overview ofthe decreasing trend of outstanding OTC CDS exposures since the financial crisisin terms of notional and market value from 2010 onwards, as reported by the BIS.At the end of June 2016, the level of single-name CDS notional was close to 6.7trillion.8
Table 1: The global OTC CDS marketSource: BIS (2016)3.3.Regulatory DevelopmentsThe significant losses caused by derivative portfolios led the G20 and the BaselCommittee to propose several regulatory reforms. These reforms aimed to strengthenthe resilience of the banking system and to enhance the transparency of the OTCmarkets.Banking capital reformsThe Basel Committee has strengthened the capital framework for banking institutions to increase banks’ resilience. The financial crisis has revealed new risksthat banks were not capitalising for and the need to increase capital for some ofthe risks that were already addressed by the Basel framework but for which theexistent capital levels were insufficient to cover trading losses in times of financialturmoil. The Basel Committee has therefore amended the Market Risk and Counterparty Credit Risk frameworks to better capture tail risks and asset correlationsin turbulent times. For example, the Market Risk capital charge for trading assetshas been increased three fold.33 To be precise, it has increased by 223% according to the Analysis of the trading book quantitativeimpact study conducted by the Basel Committee (See BCBS (2009)).9
The Basel Committee has also introduced a new risk category to be addressedby banks with additional capital buffers: the Credit Valuation Adjustment (CVA)capital charge. This capital charge is meant to absorb losses from a bank’s derivative book that is traded bilaterally and the market value of these books is sensitiveto the volatility of the credit spread of the bank’s counterparties. This is the marketprice of counterparty credit risk. In practice, if the credit spread of the counterpartyin a derivative transaction increases then the value of the derivative decreases andthe bank needs to take the equivalent loss through their P&L account. These lossesare deducted from the bank’s shareholders equity and therefore, if the loss is largerthan the bank’s equity position, the bank would be insolvent.Losses from CVA risk can be partially mitigated if a bank receives collateralfrom its counterparties, preferably margining their trades daily. When this is thecase, then the CVA capital charge becomes very small depending on the amount ofcollateral available. Derivatives that are traded via an exchange or are cleared donot pose CVA risk because the counterparty (i.e. the clearing counterparty) doesnot pose default risk for the bank and therefore it does not have a volatile creditspread that could impact the valuation of the derivative position. Such exposuresdo no attract capital requirements for banks.The European legislation implementing the CVA capital charges for banks alsoincludes additional exemptions from CVA capital requirements. Derivatives transactions between banks and specified types of counterparties are exempted fromCVA banking capital charges, and these are: Transactions with non-financial counterparties where the notional amount ofthe transactions does not exceed the e1 billion clearing threshold for creditderivatives under the European Market Infrastructure Regulation (EMIR); Intra-group transactions; Transactions with central or regional governments and public entities ownedby sovereign entities; Transactions with Pension Plans. Transitional exemptions from CVA chargesare in place until 16 August 2018 and an extension is currently under discussion.10
OTC derivatives reformsIn addition to increasing the capital charges for banks, the G20 has recommended to increase the transparency of the OTC derivative markets to prevent marketabuse and decrease systemic risk by imposing mandatory clearing and reportingstandards. There is a mandatory reporting requirement to trade repositories for allcounterparties involved in the OTC market for all OTC transactions as they occurstarting 1 July 2013.In Europe, a clearing obligation for most categories of OTC derivatives is alsoin place via the European Markets Infrastructure Regulation (EMIR (2012)). However, there is no mandatory clearing obligation for OTC single-name CDS contractswhich are in the scope of this paper. For this reason most of the single-name OTCCDS contracts are not centrally cleared as described in the next section.Were all the problems with the OTC derivatives markets that surfaced duringthe financial crisis tackled by the post crisis reforms? Roe (2011) argues that abroader rethink of the OTC markets is still required. He identifies an issue thatweakens market discipline of parties involved in derivatives trading because theyare not subject to the normal sequencing in bankruptcy proceedings. This enablesbanks to jump to the head of the bankruptcy repayment cue in ways that securedcreditors cannot. Derivative counterparties are less concerned with credit risk because they can quickly recover their losses by liquidating collateral while all othercreditors need to wait in line in bankruptcy courts. Roe (2011) considers this ade facto subsidy in the form of bankruptcy benefits for parties involved in derivative transactions and pleads for its repeal in order to improve market discipline andfinancial stability.4.DataWe use data on OTC CDS transaction from DTCC, one of the six active traderepositories. The time range runs from 1 December 2015 until 31 December 2016.The transactions provided to us by DTCC fulfill either of two criteria: first, at leastone of the counterparts is regulated by the Dutch Central Bank or, second, theunderlying of the derivative contract is based in the Netherlands. For cleaning thedata we follow Levels et al. (2018) who build on Abad et al. (2016).11
4.1.Data sampleAfter the initial cleaning, we start with approximately 20,000 CDS transactions.4Further filtering of the data – detailed below – gets us down to a baseline datasample of 5959 transactions. Following Arora et al. (2012), we keep only the 5year CDS contracts because these are the most liquid contracts; this filtering stepremoves 70% of transactions. We also eliminate centrally cleared contracts, whichare only 1% of the sample, as they inherently do not have CCR and CVA risk. Wealso eliminate six transactions with negative spreads because they are difficult toexplain from an economic perspective and spreads above 1000 basis points becausethese companies are obviously in distress (cf. Du et al. (2015)). In addition, wealso drop transactions with missing upfront payment, currency type and recoveryrate fields because these parameters are indispensable for correctly pricing a CDS.4.2.CDS pricing modelTo obtain our dependent variable, CDS price, we compute the CDS par spreadsusing the ISDA Standard Model. This is a pricing model that allows us to computethe par spread of the CDS contract post-trade (implemented the R package creditr(Kane et al. (2014))). From the creditr package we used the upfront to spread transformation, taking into account the standard coupon payment, the upfront payment,the transaction date, the maturity, the recovery rate and the currency as parameters.The outcome of the pricing model – the CDS par spread noted as the CDS price – isused as dependent variable in our empirical model.Without computing the CDS par spreads it is not possible to fully understandand analyse CDS pricing from the raw data. The coupon reported by institutionsto the trade repositories does not reflect the actual spread of the CDS contractanymore. After the financial crisis the market has pursued standardising the CDScontracts in the so called "Big Bang" protocol and the coupons have been fixed atcertain levels.To settle the net present value of the coupon payments, market parties havestarted to exchange an upfront payment. If the spread of the CDS contract wouldbe the same as the coupon chosen by the seller, then an upfront payment would4 Thecleaning steps are detailed in Levels et al. (2018).12
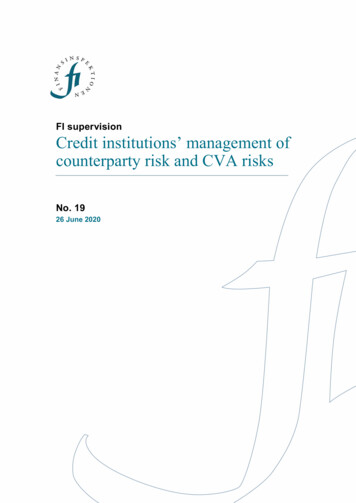
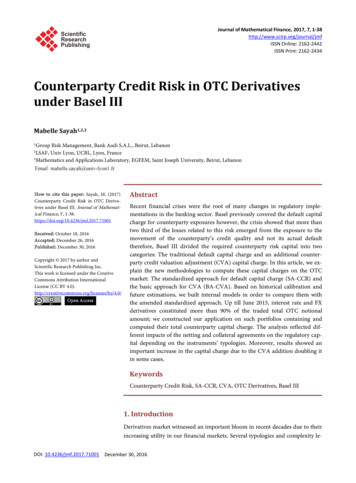
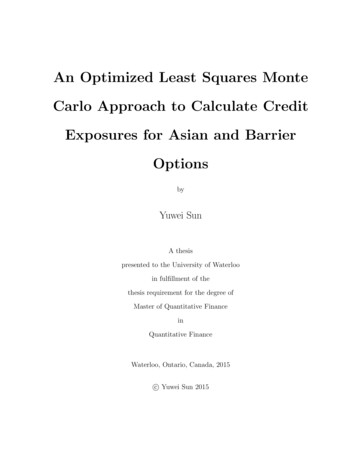
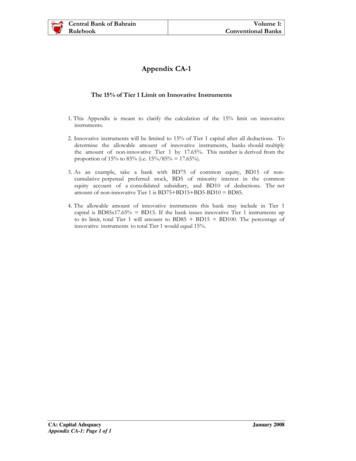
not be necessary. However if the coupon level is smaller than the spread of thecontract agreed by the parties than the buyer of the CDS contract would make anupfront payment to the seller of the CDS contract. In this case the upfront paymentis reported as a positive number. If the upfront payment is reported as negative thenit means that the buyer of CDS protection receives from the seller of protection anupfront payment.4.3.VariablesThe dependent variable is the CDS price and it is the par spread equivalent of thetransacted CDS contract. Figure 1 plots the distribution of this variable whichshows some clustering around 25bp, 100bp, and 500bp. Note that the distributionof the riskiness of the seller displays similar multi-modality (cf. Figure 2). Thiscan be the outcome of the standardisation of the coupon payments around thesevalues after the financial crisis which caused market segmentation.0.002Density.004.006.008Figure 1: Distribution of the CDS Price (in basis points)0200400600CDS Price8001000We follow Arora et al. (2012) and use two main independent variables. First, we retrieve the CDS spread at the end of day before the transaction date from Bloomberg.This is our measure of the Seller Riskiness which represents the counterparty creditrisk of the seller of the CDS contract. The distribution of Seller Riskiness is plottedin Figure 2 below. The second independent variable is the notional of the contract,13
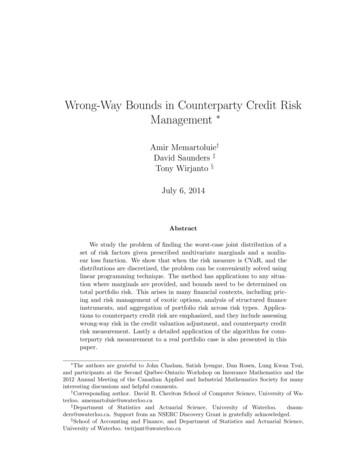
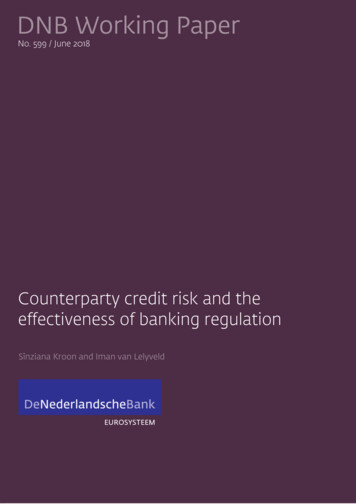
retrieved from our data set, to test whether the size of the contract also impacts theprice of the CDS. These two independent variables are not correlated.0.002.004Density.006.008.01Figure 2: Distribution of the CDS Spread of the Seller or Seller Riskiness (in basis points)0200Seller Riskiness400600.Figure 3 below shows, first, the concentration in trading and, second, the volatilityin pricing. The bar charts at the bottom show the number of trades per week. Here apattern of increased trading volumes towards the end of each quarter is visible. Thispattern is caused by the standardization of the CDS starting dates on four specificdates each year: 20th of March, June, September and December corresponding withweeks 8, 12, 24 and 51 of the year. The distribution of prices is shown by the rangeplot with varying shades of blue. The white dotted line in the middle shows themedian while the increasingly lighter shades show the different percentiles. Giventhe limited number of transactions (around 6000), the number of observations is inmany of the weeks insufficient to guarantee a smooth plot. Although there is somevariation, there is no clear trend or bunching.Finally, we include a dummy variable Exempted to study the impact of regulatoryexemptions on CDS pricing. Banks are exempted from holding capital for CVA fortransactions with corporates, sovereigns and pension funds. In our sample 26% ofbanks’ total number of transactions involve such exempted counterparts. In termsof notional, 31% of transactions are exempted.14
00200400600100 200 300Number of transactions per week8001000Figure 3: Evolution of the CDS prices and number of transactions per week2016w12016w142016w272016w402017w1The distribution of CDS prices is shown with increasingly darker shades of blue starting at the 10th and 90thpercentile. The dashed line shows the median value.Table 2: Summary statisticsVariablesObsMeanMedianMinMaxCDS priceSeller riskinessNotionalU p f 19190
Counterparty credit risk is the risk that a counterparty in a financial derivative con-tract will default prior to the expiration of the contract and/or will fail to make future payments. Counterparty risk concerns both parties in an over-the-counter (OTC) derivatives contract for all asset classes. Financial institutions, whilst mak-