Transcription
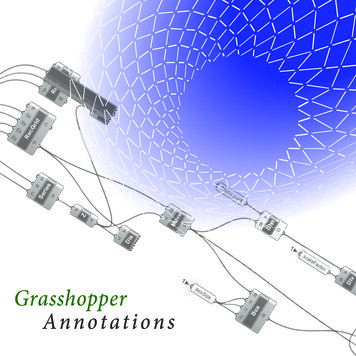
FOR RHINOCEROS 4.0 SR4GRASSHOPPERPRIMER
IntroductionWelcome to the wonderful new world of Grasshopper. This is the first printing of thisprimer and it was originally put together as a handout for a workshop I was teaching atthe California College of the Arts. In compiling this manual, I found that there was a lotof information and online tutorials out there based on the Grasshopper plugin, but therewasn’t ONE definitive guide where someone who was just beginning their trek into theunknown could get a good understanding on how to navigate this fantastic new tool.I have to be honest. Some of the information and many of the tutorials were created byother great designers, and I cite my sources as needed. Often, there are links at the endof a tutorial to an online video that should be used as a complement to this manual. Thefirst 20 pages or so came straight from the RhinoWiki page, which is a wonderfulresource and should be consulted early and often in your search for more informationabout the plugin. Another great source of information is the Grasshopper Forum. Here,you’ll find a growing online community dedicated to furthering this tool by sharing theirquestions, concerns, solutions, and definitions to help others out there just like you. Iwould encourage each person who reads this primer to join the group and post yourquestions online, as there is almost always someone willing to share a solution to yourproblem. To learn more, visit http://www.grashopper.rhino3d.comOne of the greatest things about this software is that it is always evolving. Thedevelopers often make changes and add new features, which may or may not conflictwith older definitions. It can make it frustrating and even difficult to keep up with thespeed at which things are moving. This primer was written to work with Grasshopperversion 0.5.0099, which was released in December 2008, and I have no doubt that ineven just a few short weeks it will be outdated. However, I will continue to try to keepthis primer as up to date as possible and add more tutorials as time allows.It is my hope that this manual will help beginners get a better understanding of thesoftware, but I by no means expect it to become the Grasshopper Bible. There may verywell be some small errors, here or there, within the primer and I would ask that you bringthose to my attention should you see any inconsistencies in the material. It will only helpthe manual become more robust and in turn help others out there as well. That’s aboutit. I believe it’s time to jump into the material.Thanks, and good luck!Andy PayneLIFT architectswww.liftarchitects.comCopyright 2009 All Rights Reserved
Table of ContentsIntroductionTable of Contents1Getting Started2The Interface3Grasshopper Objects4Persistent Data Management5Volatile Data Inheritance6Data Stream Matching7Scalar Component Types7.1 Operators7.2 Range vs. Series vs. Interval7.3 Functions & Booleans7.4 Functions & Numeric Data7.5 Trigonometric Curves8Lists & Data Management8.1 Shifting Data8.2 Exporting Data to Excel9Vector Basics9.1 Point/Vector Manipulation9.2 Using Vector/Scalar Mathematics with Point Attractors (Scaling Circles)9.3 Using Vector/Scalar Mathematics with Point Attractors (Scaling Boxes)10 Curve Types10.1 Curve Analytics11 Surface Types11.1 Surface Connect11.2 Paneling Tools11.3 Surface 6771
1 Getting StartedInstalling GrasshopperTo download the Grasshopper plug-in, visit http://grasshopper.rhino3d.com/. Click onthe Download link in the upper left hand corner of the page, and when prompted on thenext screen, enter your email address. Now, right click on the download link, andchoose Save Target As from the menu. Select a location on your hard drive (note: thefile cannot be loaded over a network connection, so the file must be saved locally to yourcomputer’s hard drive) and save the executable file to that address.Select Run from the download dialogue box follow the installer instructions. (note: youmust have Rhino 4.0 with the SR4b patch already installed on your computer for theplug-in to install properly)For plugin version 0.5.00991
2 The Interface*The Main DialogOnce you have loaded the plug-in, type "Grasshopper" in the Rhino command prompt todisplay the main Grasshopper window:This interface contains a number of different elements, most of which will be very familiarto Rhino users:A. The Main Menu BarThe menu is similar to typical Windows menus, except for the file-browser control on theright B. You can quickly switch between different loaded files by selecting them throughthis drop-down box. Be careful when using shortcuts since they are handled by theactive window. This could either be Rhino, the Grasshopper plug-in or any other windowinside Rhino. Since there is no undo available yet you should be cautious with the Ctrl-X,Ctrl-S and Del shortcuts.B. File Browser ControlAs discussed in the previous section, this drop down menu can be used to switchbetween different loaded files.C. Component PanelsThis area exposes all component categories. All components belong to a certaincategory (such as "Params" for all primitive data types or "Curves" for all curve related* Source: For plugin version 0.5.0099
tools) and all categories are available as unique toolbar panels. The height and width ofthe toolbars can be adjusted, allowing for more or fewer on-screen buttons per category.The toolbar panels themselves contain all the components that belong to that category.Since there are a potentially large number of these, it only shows the N most recentlyused items. In order to see the entire collection, you have to click on the bar at thebottom of the Panel:This will pop up the category panel, whichprovides access to all objects. You caneither click on the objects in the popup list,or you can drag directly from the list ontothe canvas. Clicking on items in thecategory panel will place them on thetoolbar for easy future reference. Clickingon buttons will not add them to theCanvas! You must drag them onto theCanvas in order to add them:You can also find components by name, by double-clicking anywhere on the canvas;launching a pop-up search box. Type in the name of the component you are looking forand you will see a list of parameters or components that match your request.The Window Title Bar: DThe Editor Window title bar behaves different from most other dialogs in MicrosoftWindows. If the window is not minimized or maximized, double clicking the title bar willfold or unfold the dialog. This is a great way to switch between the plug-in and Rhinobecause it minimizes the Editor without moving it to the bottom of the screen or behindother windows. Note that if you close the Editor, the Grasshopper geometry previews inthe viewports will disappear, but the files won't actually be closed. The next time you runFor plugin version 0.5.00993
the Grasshopper command, the window will come back in the same state with thesame files loaded.The Canvas Toolbar: EThe canvas toolbar provides quick access to a number of frequently used features. Allthe tools are available through the menu as well, and you can hide the toolbar if you like.(It can be re-enabled from the View menu).The canvas toolbar exposes the following tools (from left to right):1. Definition properties editor2. Sketch tool:The sketch tool works like most pencil-type tools of Photoshop or Window'sPaint. Default controls of the sketch tools allow changes of line weight, line type,and color. However, it can be quite difficult to draw straight lines or pre-definedshapes. In order to solve this problem, draw out any sketch line onto the canvas.Right click on the line, and select "Load from Rhino", and select any pre-definedshape in your Rhino scene (This can be any 2d shape like a rectangle, circle,star.etc). Once you have selected your referenced shape, hit Enter, and yourpreviously drawn sketch line will be reconfigured to your Rhino reference shape.3. Zoom defaults4. Zoom Extents (will adjust the zoom-factor if the definition is too large to fit on thescreen)5. Focus corners (these 4 buttons will focus on the 4 corners of the definition)6. Named views (exposes a menu to store and recall named views)7. Rebuild solution (forces a complete rebuild of the history definition)8. Rebuild events (by default, Grasshopper responds to changes in Rhino and onthe Canvas. You can disable these responses though this menu)9. Cluster compactor (turn all selected objects into a Cluster object) Clusterobjects are not finished yet.10. Cluster exploder (turn all selected clusters into loose objects) Cluster objectsare not finished yet.11. Bake tool (turns all selected Explicit History geometry into actual Rhino objects)12. Preview settings (Grasshopper geometry is previewed by default. You candisable the preview on a per object basis, but you can also override the previewfor all objects. Switching off Shaded preview will vastly speed up some scenesthat have curved or trimmed surfaces13. Hide button. This button hides the canvas toolbar, you can switch it back onthrough the View menu4For plugin version 0.5.0099
F: The CanvasThis is the actual editor where you define and edit the history network. The Canvashosts both the objects that make up the definition and some UI widgets G.Objects on the canvas are usually color coded to provide feedback about their state:A) Parameter. A parameter which contains warnings is displayed as an orange box.Most parameters are orange when you drop them onto the canvas since the lack of datais considered to be a warning.B) Parameter. A parameter which contains neither warnings nor errors.C) Component. A component is always a more involved object, since it contains inputand output parameters. This particular component has at least 1 warning associated withit. You can find warning and errors through the context menu of objects.D) Component. A component which contains neither warnings nor errors.E) Component. A component which contains at least 1 error. The error can come eitherfrom the component itself or from one of its input/output parameters. We will learn moreabout Component Structures in the following chapters.All selected objects are drawn with a green overlay (not shown).G: UI WidgetsCurrently, the only UI widget available is the Compass, shown in the bottom right cornerof the Canvas. The Compass widget gives a graphic navigation device to show whereyour current viewport is in relation to the extents of the entire definition. The Widgetscan be enabled/disabled through the View menu.H: The Status BarThe status bar provides feedback on the selection set (not yet implemented) and themajor events that have occurred in the plug-in. You can see a list of all recent events byright clicking on the ellipsis symbol in the status bar.The square orange icon on the bottom left of the Status Bar is a recent addition to theinterface. By clicking on this icon, a list of the most recent threads, linked to theGrasshopper user group website, will be displayed. Selecting any one of the threads,For plugin version 0.5.00995
will take you directly to the discussion posted by one of the user group members. Youcan visit the Grasshopper user group website at: http://grasshopper.rhino3d.com/The Remote Control Panel:Since the Explicit History window is quite large, you may not want it on the screen all thetime. Of course you can minimize or collapse it, but then you can't tweak the valuesanymore. If you want a minimal interface to the values inside the currently activedefinition, you can enable the Remote Panel. This is a docking dialog that keeps track ofall sliders and boolean switches (and possibly other values as well in future releases):The Remote panel also provides basic preview, event and file-switching controls. Youcan enable the panel through the View menu of the Main window, or through theGrasshopperPanel command.Viewport Preview Feedback:6For plugin version 0.5.0099
A) Blue feedback geometry means you are currently picking it with the mouse.B) Green geometry in the viewport belongs to a component which is currently selected.C) Red geometry in the viewport belongs to a component which is currently unselected.D) Point geometry is drawn as a cross rather than a rectangle to distinguish it fromRhino point objects.For plugin version 0.5.00997
3 Grasshopper Objects*Grasshopper Definition ObjectsA Grasshopper definition can consist of many different kinds of objects, but in order toget started you only need to familiarize yourself with two of them: ParametersComponentsParameters contain data, meaning that they store stuff. Components contain actions,meaning that they do stuff. The following image shows some of the possible objects youare likely to encounter in a Grasshopper definition:A) A parameter which contains data. Since there is no wire coming out the left side ofthe object, it does not inherit its data from elsewhere. Parameters which do not containerrors or warnings are thin, black blocks with horizontal text.B) A parameter which contains no data. Any object which fails to collect data isconsidered suspect in an Explicit History Definition since it appears to be wastingeveryone's time and money. Therefore, all parameters (when freshly added) are orange,to indicate they do not contain any data and have thus no functional effect on theoutcome of the History Solution. Once a parameter inherits or defines data, it willbecome black.C) A selected component. All selected objects have a green sheen to them.D) A regular component.E) A component containing warnings. Since a component is likely to contain a number ofinput and output parameters, it is never clear which particular object generated thewarning by just looking at the component. There may even be multiple sources ofwarnings. You'll have to use the context menu (see below) in order to track down theproblems. Note that warnings do not necessarily have to be fixed. They may becompletely legit.* Source: r plugin version 0.5.0099
F) A component containing errors. Similar to warnings, it is not possible to see where theerror was generated in a component. You'll need to use the context menu (see below).Note that a component which contains both warnings and errors will appear red, theerror color takes precedence over the warning color.G) A connection. Connections always appear between an output and an inputparameter. There is no limit to how many connections any particular parameter maycontain, but it is not allowed to create a setup with cyclical/recursive connections. Such arecursion is detected and the entire Solution is short-circuited when it occurs, resulting inan error message in the first component or parameter that was detected to be recursive.For more information on connections, see chapter about Data Inheritance.Component PartsA component usually requires data in order to perform its actions, and it usually comesup with a result. That is why most components have a set of nested parameters, referredto as Input and Output parameters respectively. Input parameters are positioned alongthe left side, output parameters along the right side:A) The three input parameters of the Division component. By default, parameter namesare always extremely short. You can rename each parameter as you please.B) The Division component area (usually contains the name of the component)C) The three output parameters of the Division component.When you hover your mouse over the individual parts of a Component object, you'll seedifferent tooltips that indicate the particular type of the (sub)object currently under themouse. Tooltips are quite informative since they tell you both the type and the data ofindividual parameters:For plugin version 0.5.00999
Using Context Popup MenusAll objects on the Canvas have their own context menus that expose most of thefeatures for that particular component. Components are a bit trickier, since they alsoexpose (in a cascading style) all the menus of the sub-objects they contain. Forexample, if a component turns orange it means that it, or some parameter affiliated withthe component, generated a warning. If you want to find out what went wrong, you needto use the component context menu:Here you see the main component menu, with the cascading menu for the "R" inputparameter. The menu usually starts with an editable text field that lists the name of theobject in question. You can change the name to something more descriptive, but bydefault all names are extremely short to minimize screen-real-estate usage. The seconditem in the menu (Preview flag) indicates whether or not the geometry produced/definedby this object will be visible in the Rhino viewports. Switching off preview for componentsthat do not contain vital information will speed up both the Rhino viewport framerate andthe time taken for a History Solution (in case meshing is involved). If the preview for aparameter or a component is disabled, it will be drawn with a faint white hatch. Not allparameters/components can be drawn in viewports (numbers for example) and in thesecases the Preview item is usually missing.The context menu for the "R" input parameter contains the orange warning icon, which inturn contains a list (just 1 warning in this case) of all the warnings that were generatedby this parameter.10For plugin version 0.5.0099
4 Persistent Data Management*Types of DataParameters are only used to store information, but most parameters can store twodifferent kinds; Volatile and Persistent data. Volatile data is inherited from one or moresource parameters and is destroyed (i.e. recollected) whenever a new solution starts.Persistent data is data which has been specifically set by the user. Whenever aparameter is hooked up to a source object the persistent data is ignored, but notdestroyed.(The exception here are output parameters which can neither store permanent recordsnor define a set of sources. Output parameters are fully under the control of thecomponent that owns them.)Persistent data is accessed through the menu, and depending on the kind of parameterhas a different manager. Vector parameters for example allow you to set both single andmultiple vectors through the menu.But, let's back up a few steps and see how a default Vector parameter behaves. Onceyou drag drop it from the Params Panel onto the canvas, you will see the following:The parameter is orange, indicating it generated a warning. It's nothing serious, thewarning is simply there to inform you that the parameter is empty (it contains nopersistent records and it failed to collect volatile data) and thus has no effect on theoutcome of a history solution. The context menu of the Parameter offers 2 ways ofsetting persistent data: single and multiple:* Source: .htmlFor plugin version 0.5.009911
Once you click on either of these menu items, the Explicit History window will disappearand you will be asked to pick a vector in one of the Rhino viewports:Once you have defined all the vectors you want, you can press Enter and they willbecome part of the Parameters Persistent Data Record. This means the Parameter isnow no longer empty and it turns from orange to black:At this point you can use this parameter to 'seed' as many objects as you like withidentical vectors.12For plugin version 0.5.0099
5 Volatile Data Inheritance*Data InheritanceData is stored in parameters (either in Volatile or Persistent form) and used incomponents. When data is not stored in the permanent record set of a parameter, itmust be inherited from elsewhere. Every parameter (except output parameters) defineswhere it gets its data from and most parameters are not very particular. You can plug adouble parameter into an integer source and it will take care of the conversion. The plugin defines many conversion schemes but if there is no translation procedure defined, theparameter on the receiving end will generate a conversion error. For example, if yousupply a Surface when a Point is needed, the Point parameter will generate an errormessage (accessible through the menu of the parameter in question) and turn red. If theparameter belongs to a component, this state of red-ness will propagate up the hierarchyand the component will become red too, even though it may not contain errors of itself.Connection managementSince Parameters are in charge of their own data sources, you can get access to thesesettings through the parameter in question. Let's assume we have a small definitioncontaining three components and two parameters:At this stage, all the objects are unconnected and we need to start hooking them up. Itdoesn't matter in what order we do this, but lets go from left to right. If you start draggingnear the little circle of a parameter (what us hip people call a "grip") a connecting wirewill be attached to the mouse:Once the mouse (with the Left Button still firmly pressed) hovers over a potential targetParameter, the wire will attach and become solid. This is not a permanent connectionuntil you release the mouse button:* Source: r plugin version 0.5.009913
We can do the same for the "Y" parameter of the PtGrid component and the "A" and "B"parameters of the Line component: Click Drag Release.14For plugin version 0.5.0099
Note that we can make connections both ways. But be careful, by default a newconnection will erase existing connections. Since we assumed that you will most oftenonly use single connections, you have to do something special in order to define multiplesources. If you press Shift while dragging connection wires, the mouse pointer willchange to indicate addition behavior:If the "ADD" cursor is active when you release the mouse button over a sourceparameter, that parameter will be added to the source list. If you specify a sourceparameter which is already defined as a source, nothing will happen. You cannot inheritfrom the same source more than once.By the same token, if you hold down Control the "REM" cursor will become visible, andthe targeted source will be removed from the source list. If the target isn't referenced,nothing will happen.For plugin version 0.5.009915
You can also disconnect (but not connect) sources through the parameter menu:16For plugin version 0.5.0099
6 Data Stream Matching*Data matchingData matching is a problem without a clean solution. It occurs when a component hasaccess to differently sized inputs. Imagine a component which creates line segmentsbetween points. It will have two input parameters which both supply point coordinates(Stream A and Stream B). It is irrelevant where these parameters collect their data from,a component cannot "see" beyond its in- and output parameters:As you can see there are different ways in which we can draw lines between these setsof points. The Grasshopper plug-in currently supports three matching algorithms, butmany more are possible. The simplest way is to connect the inputs one-on-one until oneof the streams runs dry. This is called the "Shortest List" algorithm:The "Longest List" algorithm keeps connecting inputs until all streams run dry. This isthe default behavior for components:Finally, the "Cross Reference" method makes all possible connections:This is potentially dangerous since the amount of output can be humongous. Theproblem becomes more intricate as more input parameters are involved and when thevolatile data inheritance starts to multiply data, but the logic remains the same.* Source: tmlFor plugin version 0.5.009917
Imagine we have a point component which inherits its x, y and z values from remoteparameters which contain the following data:X coordinate: {0.0, 1.0, 2.0, 3.0, 4.0, 5.0, 6.0, 7.0, 8.0, 9.0}Y coordinate: {0.0, 1.0, 2.0, 3.0, 4.0}Z coordinate: {0.0, 1.0}If we combine this data in the "Shortest List" fashion, we get only two points since the "Zcoordinate" contains only two values. Since this is the shortest list it defines the extent ofthe solution:The "Longest List" algorithm will create ten points, recycling the highest possible valuesof the Y and Z streams:18For plugin version 0.5.0099
"Cross Reference" will connect all values in X with all values in Y and Z, thus resulting in10!5!2 a hundred points:Every component can be set to obey one of these rules (the setting is available in themenu by right clicking the component icon).Note the one big exception to this behavior. Some components EXPECT to get a list ofdata in one or more of their input fields. The polyline component, for example, creates apolyline curve through an array of input points. More points in the input parameter willresult in a longer polyline, not in more polylines. Input parameters which are expected toyield more than one value are called List Parameters and they are ignored during datamatching.For plugin version 0.5.009919
7 Scalar Component TypesScalar Component Types are typically used for various mathematical operations andconsist of:A) Constants. Returns a constant value such as Pi, Golden Ratio, etc.B) Expressions. Used to create single or multiple variable functions (algorithms).C) Intervals. Used to divide two numeric extremes into interval parts.D) Operators. Used in mathematical operations such as Add, Subtract, Multiply, etc E) Polynomials. Used to raise a numeric value by some power.F) Trigonometry. Returns typical trigonometric values such as Sine, Cosine, andTangent, etc G) Utility (Analysis). Used to evaluate of two or more numerical values.7.1 OperatorsAs was previously mentioned, Operators are a set of components that use algebraicfunctions with two numeric input values, which result in one output value. To furtherunderstand Operators, we will create a simple math definition to explore the differentOperator Component Types.Note: To see the finished version of this definition, Open the file Scalar operators.ghxfound in the Source Files folder that accompanies this document. Below is a screenshot of the completed definition.To create the definition from scratch: Params/Special/Numeric Slider – Drag and drop a numeric slider componentto the canvas Right click the slider to set:oLower limit: 0.0oUpper limit: 100.0oValue: 50.0 (note: this value is arbitrary and can be modified to any valuewithin the upper and lower limits)20For plugin version 0.5.0099
Select the slider and type Cntrl C (copy) and Cntrl V (paste) to create aduplicate sliderParams/Primitive/Integer – Drag and drop two Integer components onto thecanvasConnect slider 1 to the first Integer componentConnect slider 2 to the second Integer componentThe slider’s default value type is set to Floating Point (which results in adecimal numeric value). By connecting the slider to the Integercomponent, we can convert the floating point value to an Integer, or anywhole number. When we connect a Post-It panel (Params/Special/Panel)to the output value of each Integer component, we can see theconversion in real-time. Move the slider to the left and right and noticethe floating point value be converted to a whole number.Scalar/Operators/Add – Drag and drop an Add component to the canvasConnect the first Integer component to the Add-A inputConnect the second Integer component to the Add-B inputParams/Special/Panel – Drag and drop a Post-it panel to the canvasConnect the Add-R output to the Post-it panel inputYou can now see the summation value of the two integers in the Post-itpanel.Drag and drop the other remaining Scalar Operators onto the soPowerConnect the first Integer component to each of the Operator’s-A input valueConnect the second Integer component to each of the Operator’s-B inputvalueDrag and drop a five more Post-it panels onto the canvas and connect onepanel to each Operator’s output valueThe definition is complete, and now when you change each of the slider’svalues, you will see the result of each Operator’s action in the Post-itpanel area.For plugin version 0.5.009921
7.2 Range vs. Series vs. IntervalThe Range, Series, and Interval components all create a set of values between twonumeric extremes; however the components operate in different ways.Note: To see the finished version of the following examples, Open the fileScalar intervals.ghx found in the Source Files folder that accompanies this document.The Range component creates a list of evenly spaced numbers between a low and ahigh value called the domain of numeric range. In the example above, two numericsliders are connected to the input values of the Range component. The first sliderdefines the numeric domain for the range of values. In this example, the domain hasbeen defined from zero to one, since the slider is set to 1. The second slider defines thenumber of steps to divide the domain, which in this case has been set to 10. Thus, theoutput is a list of 11 numbers evenly divided between 0 and 1. (note: The second slider,set to 10, is defining the number of divisions between 0 and 1, which ultimately creates11 numbers, not 10)The Series component creates a set of discreet numbers based on a start value, stepsize, and the number of values in the Series. The series example shows three numericsliders connected to the Series component. The first slider, when connected to theSeries-S input defines the starting point for the series of numbers. The second slider,set to 10, defines the step value for the series. Since, the start value has
This primer was written to work with Grasshopper version 0.5.0099, which was released in December 2008, and I have no doubt that in even just a few short weeks it will be outdated. However, I will continue to try to keep this primer as up to date as possible and add more tutorials as time allows.