Transcription
A M E RI C AN ASSO C IAT IO N O F NEUROMUS CULA R & ELEC TRODIAGNOSTIC M E D I C I NEInstrumentationPrinciples of NCSs and Needle EMGPhoto by Michael D. Stubblefield, MD
Instrumentation and NeurophysiologySanjeev D. Nandedkar, PhDDaniel Dumitru, MD, PhDBrett L. Netherton, MS, CNIMAANEM 58th Annual MeetingSan Francisco, CaliforniaCopyright September 2011American Association of Neuromuscular& Electrodiagnostic Medicine2621 Superior Drive NWRochester, MN 55901Printed by Johnson’s Printing Company, Inc.1
Please be aware that some of the medical devices or pharmaceuticals discussed in this handout may not be cleared by the FDA or cleared by the FDA forthe specific use described by the authors and are “off-label” (i.e., a use not described on the product’s label). “Off-label” devices or pharmaceuticals maybe used if, in the judgment of the treating physician, such use is medically indicated to treat a patient’s condition. Information regarding the FDA clearancestatus of a particular device or pharmaceutical may be obtained by reading the product’s package labeling, by contacting a sales representative or legalcounsel of the manufacturer of the device or pharmaceutical, or by contacting the FDA at 1-800-638-2041.2
Instrumentation and NeurophysiologyTable of ContentsCourse Objectives & Course Committee4Faculty5Motor and Sensory Nerve Conduction: Technique, Measurements, and Anatomic CorrelationSanjeev D. Nandedkar, PhD7Anatomy, Physiology, and Pathology of the Neuromuscular SystemDaniel Dumitru, MD, PhD15Electrodiagnostic Medicine Instrumentation Pitfalls: Interelectrode Separation and FiltersDaniel Dumitru, MD, PhD21Electrodiagnostic Instrumentation: Understand and Manage ItBrett L. Netherton, MS, CNIM27Glossary of Terms35CME Questions37No one involved in the planning of this CME activity had nay relevant financial relationships to disclose.Authors/faculty have nothing to discloseChair: Sanjeev D. Nandedkar, PhDThe ideas and opinions expressed in this publication are solely those of the specific authorsand do not necessarily represent those of the AANEM.3
ObjectivesObjectives - This course is suitable for technologists and physicians interested in performing basic NCSs and understanding instrumentation for NCSs.Participants will acquire skills to (1) discuss the basic anatomy and physiology of the NM system, (2) apply the motor and sensory NCSs techniques totheir practice, and (3) identify and avoid technical pitfalls.Target Audience: Neurologists, physical medicine and rehabilitation and other physicians interested in neuromuscular and electrodiagnostic medicine Health care professionals involved in the management of patients with neuromuscular diseases Researchers who are actively involved in the neuromuscular and/or electrodiagnostic researchAccreditation Statement - The AANEM is accredited by the Accreditation Council for Continuing Medical Education to provide continuing medicaleducation (CME) for physicians.CME Credit - The AANEM designates this live activity for a maximum of 5.5 AMA PRA Category 1 CreditsTM. If purchased, the AANEM designatesthis enduring material for a maximum of 4.75 AMA PRA Category 1 CreditsTM. This educational event is approved as an Accredited Group LearningActivity under Section 1 of the Framework of Continuing Professional Development (CPD) options for the Maintenance of Certification Program ofthe Royal College of Physicians and Surgeons of Canada. Physicians should claim only the credit commensurate with the extent of their participationin the activity. CME for this course is available 09/2011 - 09/2014.CEUs Credit - The AANEM has designated this live activity for a maximum of 3.25 AANEM CEUs. If purchased, the AANEM designates thisenduring material for a maximum of 4.75 CEUs.2010-2011 Course CommitteeShawn J. Bird, MD, ChairPhiladelphia, PATaylor B. Harrison, MDAtlanta, GAA. Arturo Leis, MDJackson, MSGary L. Branch, DOOwosso, MILaurence J. Kinsella, MDSaint Louis, MOMarcy C. Schlinger, DOOkemos, MILawrence W. Frank, MDElmhurst, ILShashi B. Kumar, MDTacoma, WABenjamin S. Warfel, MDLancaster, PA2010-2011 AANEM PresidentTimothy R. Dillingham, MD, MSMilwaukee, Wisconsin4
Instrumentation and NeurophysiologyFacultyDaniel Dumitru, MD, PhDProfessorUniversity of Texas Health Science Center atSan AntonioSan Antonio, TexasDr. Dumitru currently serves as professor with tenure in theDepartment of Rehabilitation Medicine at The University of TexasHealth Science Center at San Antonio. He also serves as professorin the departments of Occupational Therapy and Physiology atThe University of Texas Health Science Center at San Antonio.Dr. Dumitru completed his MD at the University of CincinnatiCollege of Medicine in 1980 and his residency in physicalmedicine and rehabilitation at the University of Texas HealthScience Center at San Antonio in 1983. Dr. Dumitru received hisPhD from the University of Nijmegen, The Netherlands in 1999.He has held numerous administrative positions as medical directorin San Antonio and Norfolk, Virginia. He is board certified byboth the American Board of Electrodiagnostic Medicine andthe American Board of Physical Medicine and Rehabilitation(AAPM&R). Dr. Dumitru continues to be active in manyprofessional organizations including the American Associationof Neuromuscular and Electrodiagnostic Medicine (AANEM), ofwhich he was president, the Association of Academic Physiatrists(AAP), and the American Academy of Physical Medicine andRehabilitation (AAPM&R) of which he was president, as well.He served as a member of the editorial board of Muscle & Nerveand on the editorial board of the American Journal of PhysicalMedicine and Rehabilitation and Archives of Physical Medicineand Rehabilitation. He has received the AANEM’s DistinguishedResearcher Award, the University of Texas Health Science Centerat San Antonio President’s Award for Excellence in Teaching, andthe AAP’s Distinguished Academician Award. His major focus forresearch is clinical neurophysiology with an emphasis in volumeconductor theory. He has numerous publications in textbooks andsignificant peer review journals as well as his comprehensivetextbook Electrodiagnostic Medicine, 1st and 2nd Editions.Sanjeev D. Nandedkar, PhDClinical Application SpecialistCareFusionMiddleton, WisconsinSanjeev received his bachelor of engineering (electronics) degreefrom the Birla Institute of Technology and Science (BITS), India,in 1977 and his PhD degree in biomedical engineering from theUniversity of Virginia in 1983. He worked as a research engineerat the Uppsala University in Sweden in 1981-1982. He spent thenext 7 years at the Duke University EMG Laboratory to developcomputer models for electromyography (EMG) waveform analysisand new methods for quantifying needle EMG signals. Over thelast 2 decades he has worked with EMG manufacturing companiesto develop and promote new generation EMG instruments. Atpresent, he is a senior consultant for CareFusion. He has publishedover 50 scientific articles, written chapters in many text books,and performed workshops in over 20 countries. He also editsthe “EMG on DVD” series in collaboration with AANEM. Hisresearch interest is in quantitative analysis and motor unit numberestimation. He received the AANEM’s Distinguished ServiceAward in 2002.Brett L. Netherton, MS, CNIMTechnical DirectorROCWorks, LLCProsperity, South CarolinaMr. Netheron brings a diverse educational and entrepreneurialbackground to electrodiagnostics. With a bachelor’s degree inelectrical engineering and a master’s degree in physiology, hewas drawn to the study of spinal pattern generators in graduateschool, which led to a career in intraoperative neuromonitoring(IOM). He spent several years as an IOM clinician and gainedCNIM certification prior to returning to his entrepreneurial roots.In 2007, Mr. Netheron sold his majority interests in his thirdcompany, Rhythmlink International. Currently, after startinghis fourth company, Rocworks, Mr. Netheron focuses his timeon publications, education, and research and gives numerouspresentations each year, generally focusing on electrical aspects ofneuromonitoring and the technical aspects of the electrode to tissueinterface. Mr. Netheron is currently on the Board of Directors ofthe American Society of Neurophysiological Monitoring (ASNM)as well as chair of the ASNM Vendor Relations Committee.5
6
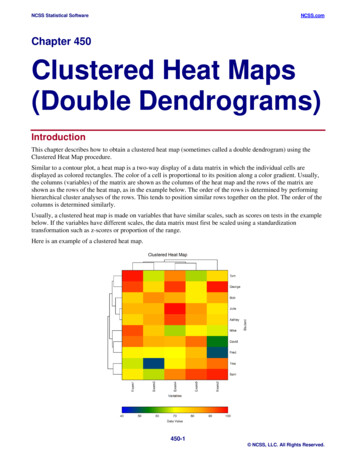
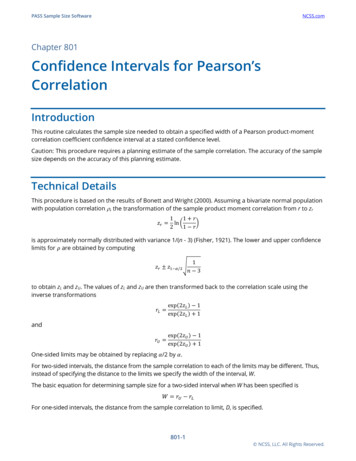
Motor and Sensory Nerve Conduction:Technique, Measurements,and Anatomic CorrelationSanjeev D. Nandedkar, PhDClinical Application SpecialistCareFusionMiddleton, WisconsinINTRODUCTIONNerve conduction studies (NCSs) are performed on almost all patients referred for electrodiagnostic (EDX) studies. These tests areuseful to study the continuity, excitability, anatomic course, and size(i.e., number of nerve fibers) of the tested nerve. The NCS is alsouseful to localize and characterize the lesion (e.g., axonal, demyelinating, focal, or diffuse), define distribution (e.g., proximal versusdistal), grade severity, and perhaps make a prognosis.2,3 The usefulness of these procedures can be realized only when the procedureis performed properly. Also, one must understand the relationshipbetween the underlying neural generators and the measurementsmade from their responses.4 This paper will focus on these twoaspects of the routinely performed NCS. Uncommon NCSs suchas conduction velocity distribution, silent period measurements,etc., will not be discussed. The operator should be able to recognizetechnical artifacts and be able to minimize them. While NCSs areperformed in many nerves, the median nerve will be used for thepurpose of illustration.MOTOR NERVE CONDUCTION STUDYAlthough the motor nerve conduction study (MNCS) is a NCS,the responses are recorded from a muscle. Therefore, it is important to understand the structure of the peripheral neuromuscularsystem. A muscle contains thousands of muscle fibers organizedin functional entities called “motor units” (MUs). A MU consistsof all muscle fibers innervated by one motor neuron (See Fig. 1A).When the motor neuron depolarizes, an action potential (AP) propagates from the neuron to the periphery along the motor axon. TheMotor neuronAxonTerminalbranchesABMuscle fiber & end-plateSpinal 2Sensation1MuscleM WaveF WaveFigure 1 The motor unit (A) and the motor unit action potential (B) areshown schematically. In C, the path of motor and sensory nerve fibers fromthe spinal cord to the periphery is shown. Note that the sensory nerve cellbody lies outside the spinal cord while the motor neuron is inside the spinalcord. The sensory fibers make up the dorsal root and motor fibers makeup the ventral root. Two stimulation sites and four separate locations oflesion are indicated. Their corresponding patterns on nerve conduction areshown in Table 3. Copyright Nandedkar Productions LLC, 2010.AP propagates through the terminal axon branches and is transmittedto all innervated muscle fibers by release of acetylcholine. The musclefiber AP propagates from the endplate to the tendon and activatesthe contractile element in the fiber. Every time the motor neurondischarges, all fibers in the MU respond by producing an AP anda twitch contraction. The summated electrical activity of all muscle7
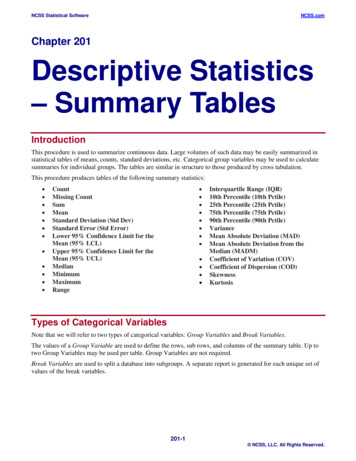
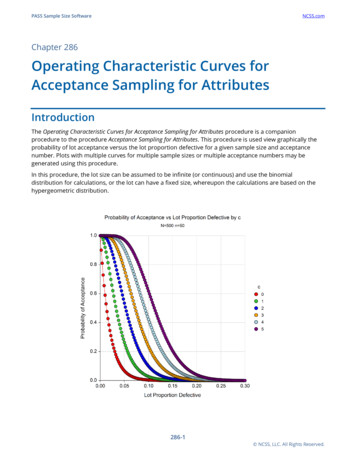
Motor and Sensory Nerve Conduction: Technique, Measurements, and Anatomic Correlationfibers in a MU is called the “motor unit action potential” (MUAP)(See Fig. 1B). It is usually studied using needle electrodes, but canalso be registered using surface electrodes (surface recorded motorunit potential [SMUP]).The number of muscle fibers in a MU, called MU size, varies considerably between different muscles and within a muscle. Small musclesused for fine movement have small MUs, while muscles producinga large force can have several hundred fibers in a MU. Larger MUswill create a larger SMUP.TechniqueThree electrodes are necessary for the all nerve conduction recording:the active, reference, and the ground. In MNCSs, the active electrodeis placed over the “motor point” of a muscle innervated by the testednerve. The reference electrode is placed off the muscle but near itsorigin or insertion. In most studies, the reference electrode position isslightly distal to the active recording electrode. The ground electrodeis placed between the active recording electrode and the closest stimulation site. For the median nerve, the active electrode is placed overthe abductor pollicis brevis muscle. The reference electrode is placedover the thumb. The ground electrode is placed on the dorsum of thehand (See Fig. 2A).The study begins by stimulating the nerve distally at a short fixeddistance (usually 6-8 cm) from the recording site. Some laboratoriesmay use an anatomic landmark (e.g., 2 cm proximal to the wristcrease) to locate the stimulation site. The cathode (i.e., negative pin)ABReferenceof the stimulator is placed over the stimulation site and the anodeis proximal. At low stimulus intensity, the electrical field under thecathode may not be adequate to depolarize any nerve fiber. Hence,one observes a small stimulus artifact followed by the baseline. Whenthe intensity is increased a few nerve fibers will depolarize and theirnerve action potentials will propagate to the muscle. The MUs stimulated in this manner will produce a small twitch of the muscle, andthe recording electrode will register a sum of their SMUPs. Whenthe stimulus intensity is increased more nerve fibers will be stimulated. The muscle will show a stronger contraction, and the electricalresponse will be larger (Fig. 2B). This will continue until all nervefibers supplying the muscle are stimulated. Further increase in intensity will not affect the response. Such intensity is called maximal. Toensure that all nerve fibers are stimulated, the intensity is increased byanother 10-20%. The response recorded at this supramaximal levelis called the “compound muscle action potential” (CMAP) (See Fig.2C, top trace).The CMAP is characterized by two basic measurements: latency (measured in milliseconds) and amplitude (measured in millivolts) (See Fig.2C). The onset of the CMAP occurs when the signal first deviates fromthe baseline (upward or downward). The time from stimulation to thispoint is the “onset latency.” For the distal site, this is also called thedistal latency (DL). The amplitude is measured as voltage differencefrom onset (or baseline) to the negative (upward) peak. Some laboratories measure the amplitude between the maximum positive andnegative peaks, i.e., peak-to-peak amplitude. Additional measurementsare also made of the area and duration of the negative peak.Next, the nerve is stimulated at a proximal site. As before, the intensity is increased to reach the supramaximal level (See Fig. 2C, bottomtrace). The CMAP latency at this stimulation site is called “proximallatency.” The distance between the cathode positions for the twostimulation sites is measured to compute conduction velocity (CV) as:velocity (m/s) distance (mm) / (proximal latency [ms] distallatency [ms])ActiveDistal siteThe procedure can be repeated for more stimulation sites, as necessary.CathodeAnode2 mV/div, 3 ms/divCDL: 3.1 msAmp: 6.3 mVProximalsitePL: 6.85 msAmp: 5.7 mVDist: 200 mmVel: 53 m/sFigure 2 The recording setup for a median motor nerve conduction study isshown in A. The increase in the response amplitude with stimulus intensity isshown in B. The compound motor action potential responses from the distaland proximal sites are shown in C (top and bottom traces, respectively).The measurements are indicated next to the traces. Copyright NandedkarProductions LLC, 2010.Amp amplitude, Dist distance, DL distal latency, PL peak latency,Vel velocity8Anatomic CorrelationWhen a single motor nerve fiber is stimulated, all muscles of fibers(few to 100 depending upon the muscle) belonging to that MUwill generate APs. This is a biologic amplifier which yields large amplitude signals that are easy to record. Hence, the default display gainsetting is usually 2-5 mV/div.The CMAP is usually a biphasic waveform with an initial negative(upward) deflection. This indicates that the active electrode is overthe motor point. An initial positive (downward) deflection occurs ifthe active electrode is off the motor point or from volume conductedactivity of neighboring muscles. The neighboring muscles may bestimulated due to excessive stimulus intensity or via anomalous innervation. Therefore, it is important to observe the muscle twitchwhen recording the CMAP.
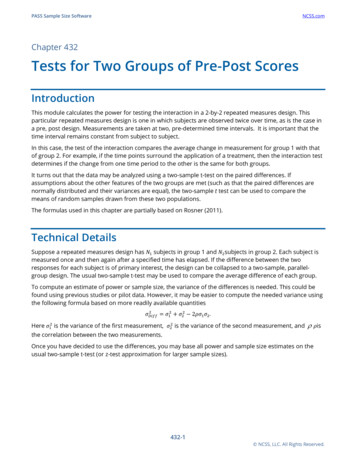
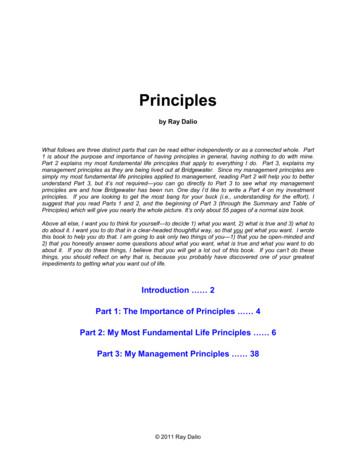
INstrumentation and neurophysiologyThe CMAP latency represents the time of nerve AP propagation distalto the stimulation site through the terminal axon branches to the neuromuscular junction, plus the time for transmission of the AP to musclefiber, depolarization of muscle fiber, etc. In essence, this is not the truetime of nerve conduction. The CMAP latency from the distal stimulation site alone can not be used to compute CV. However, when thelocation of distal stimulation site is standardized (using fixed distanceor anatomic landmark), one can compare the DL values. In pathology,CV is reduced causing increased distal latency.The distance between the proximal stimulation site and the activerecording electrode will vary among different subjects. Computationof the CV allows us to account for this variation. It is important tounderstand that the velocity characterizes the nerve segment betweenthe stimulation sites and does not reflect conduction in other parts ofthe nerve. Also, the CMAP onset occurs with the arrival of the fastestconducting axon AP at the muscle. Therefore, the CV also reflects theAP propagation in the fastest axons. It can decrease due to demyelination of axons or loss of fast conducting axons.The CMAP is the sum of SMUP of all stimulated MUs. Its amplitude reflects the number of nerve axons and muscle fibers stimulated.Reduced amplitude will occur from reduced excitability of nerve fibers,loss of nerve fibers (degeneration following injury, loss of the MU),failure of neuromuscular transmission, loss of muscle fibers, loss of excitability of muscle fibers, and muscle atrophy. Amplitude also decreasesdue to a phenomenon called “phase cancellation” (See Fig. 3). Thenerve fiber diameter varies within a nerve. Larger fibers conduct the APfaster than the smaller fibers. Therefore, the individual nerve fiber APsreach the muscle at different times. As a result, their SMUPs are notsynchronous, with the positive phase of one SMUP partially coincidingwith the negative phase of the other SMUP (See Fig. 3B). Their sumwill cancel these phases of opposite polarity to yield a smaller amplitudewaveform (phase cancellation). The time difference in the arrival of thefastest and the slowest axon AP at a muscle is called “temporal dispersion.” The greater the dispersion, the greater is the phase cancellationand smaller is the CMAP amplitude. The temporal dispersion will begreater when the distance between the stimulation and the recordingsite is longer. Therefore, the CMAP amplitude for the proximal siteis usually smaller than the CMAP for distal stimulation (see Fig. 2C).Increased dispersion also gives a slightly longer negative phase duration.The combination of a reduced amplitude with an increased durationcauses the CMAP area to have less of a decrease.F WAVEThe MNCS allows one to assess abnormalities distal to the stimulation site. Many nerve lesions are proximal where the nerve is too deepto allow stimulation using a surface electrode. Fortunately, the stimulated nerve propagates its AP bidirectionally (See Fig. 1C). This allowsus to record many types of late responses to investigate conduction inproximal segment. The F wave is one such late response that can beconsidered as an extension of the MNCS.TechniqueThe recording setup for an F wave study is identical to that usedfor distal stimulation in a MNCS, except a longer sweep duration(e.g., 50 or 100 ms, instead of 20 ms) is used. The display gain isalso changed to 200 or 500 µV/div. When the nerve is stimulated atA1B12****2CMAPF Wave500 µV5 mV1 21 2A5 msBFigure 3 Phase cancellation is shown schematically. In A, the two potentials are synchronous and yield a high amplitude response. In B, there istemporal dispersion. The shaded areas highlight the portions where phasecancellation occurred. Note the resulting waveform has lower amplitudeand longer duration. Copyright Nandedkar Productions LLC, 2010.5 msFigure 4 F waves from a normal nerve (A) show variable waveform.The dotted trace shows no F wave. Recordings from a patient with motorneuron disease (B) show higher amplitude F waves. Some responses(indicated by *) repeat, indicating that they are single motor unit potentials. They are shown in superimposed mode at the bottom. CopyrightNandedkar Productions LLC, 2010.CMAP compound muscle action potential9
Motor and Sensory Nerve Conduction: Technique, Measurements, and Anatomic Correlationsupramaximal intensity, the CMAP is observed near the beginningof the trace (syou ee Fig. 4). A little later, one observes another lowamplitude response with variable amplitude, latency, and shape. Thisis the F wave. In some stimuli, the F wave may not occur (See Fig.4A, dotted trace). Because of this variation, the nerve is stimulatedseveral (often 10 to 20) times to register a few F waves.Each F wave is characterized mainly by its onset latency, called Flatency. As in the MNCS, the first deviation of the signal is usedfor latency determination. Due to the variable nature of the F wave,most laboratories use the shortest F latency for interpretation (shownby the arrow in Fig. 4). Modern systems can provide additionalstatistics such as maximum and mean values, dispersion (obtainedas maximum minimum F latency), etc. One can also measure theamplitude of each F wave and compute the aforementioned statistics. Some laboratories use the difference between the F latency andCMAP (or M) latency for analysis. This is called the “F–M” latency.Using the distance between the stimulation site and the nerve root,the F velocity can be computed as:F velocity 2 distance / (min F latency M latency 1)Finally, the persistence of the F wave is the percentage of stimuli thatproduced F wave.Anatomic CorrelationWhen the nerve is stimulated, its APs propagate bidirectionally(see Fig. 1C). The volley towards the muscle produces the CMAP.The volley traveling in the opposite direction reaches the spinal cord.The arrival of AP at the motor neuron can cause it to depolarize.However, the probability of such excitation is very low. Only a fewneurons will depolarize sufficiently to generate a nerve AP that propagates back to the muscle. The sum of their SMUPs is the F wave.With each stimulation, different motor neurons may depolarize. Dueto differences in their axonal CV and size of these MUs, the F wavewill vary from one discharge to another. When none of the neuronsdepolarize, no F wave is seen (see Fig. 4A, dotted trace). When thenumber of MUs is reduced, the F wave may represent a single SMUP.This is readily identified from the repeater F wave that has the samewaveform and latency on many recordings (see Fig. 4B).The F wave latency represents AP propagation from the stimulationsite to the motor neuron and back to the muscle (see Fig. 1C). Itwill be prolonged if there is a conduction defect anywhere along thenerve, distal or proximal to the stimulation site. By subtracting theM latency from the F latency, the time of the AP propagation in thedistal segment is removed. This will allow one to study conductionabnormalities in the proximal segment only. This forms the basis forthe F–M latency analysis. This latency difference represents the APpropagation from the stimulation site to the root and back. It is estimated that roughly 1 ms is required to depolarize the motor neuron.This forms the basis for the formula for the F wave velocity.10The difference in F latency on successive stimuli reflects the difference in propagation velocity of nerve fibers. The minimum F wavelatency (and also the F velocity) reflects the propagation in the fastestconducting axons. The minimum F latency is easy to measure. Themean F latency should be a more sensitive measurement to studyreduced CV. However, this is not practical when the time availablefor the conduction study is limited.The F amplitude will decrease if the MU size is reduced.Hyperexcitability of the motor neuron (e.g., in spasticity) will causemore motor neurons to generate F waves. Hence, the F amplitudewill increase. The waveform will also become more complex. Thesame change in amplitude and shape will occur when the MUs arelarger due to reinnervation.The persistence of F waves will reduce when the number of MUsis reduced. Reduced excitability of motor neurons will also preventmotor neurons from generating F waves. Conduction block willalso prevent AP propagation and reduce the number of F waves. Incontrast, hyperexcitability of motor neurons will cause more MUsto participate in the F wave. This will increase the amplitude andpersistence of the F waves.SENSORY NERVE CONDUCTION STUDYIn principle, the sensory nerve conduction study (SNCS) is verysimilar to a MNCS. The nerve is stimulated at supramaximal intensity to record the “sensory nerve action potential” (SNAP). Theamplitude and latency of the response are used for analysis. However,there are many important practical differences between the MNCSand the SNCS.TechniqueWhen a nerve is stimulated, the AP propagates bidirectionally. TheSNAP can be recorded proximal or distal to the stimulation site. Asan example, the median nerve may be stimulated at the wrist andthe SNAP recorded from the index finger (see Fig. 5A). The APconduction in this instance is opposite of the natural SNAP propagation. This is called an “antidromic” recording. If the digit II wasstimulated to record a response at the wrist, it will be an “orthodromic” approach. Either method for SNCSs can be used because bothtechniques have their benefits and limitations.Sometimes, the conduction study will record responses from motorand sensory nerve fibers, e.g., ulnar nerve stimulation at wrist withthe recording electrode over the elbow. This is called a “mixed NCS”and the response should be called “nerve action potential” (NAP).For simplicity, this response will be referred to as SNAP.In MNCSs, the recording electrodes are placed over the musclewhich acts like a biologic amplifier. In SNCSs, the response is recorded directly from the nerve. Due to the smaller number of axonsin a nerve (compared to the number of muscle fibers in a muscle) theSNAP has a much smaller amplitude, often 1 to 100 µV. Therefore,noise and artifacts can be significant problems, especially in abnor-
INstrumentation and neurophysiologyABReferenceActive20 µV/div, 1 ms/divCStimulationFigure 5 The stimulation and recording setup for an antidromic mediansensory nerve conduction is shown in A. The response on successivestimuli are timelocked on screen (B), but the noise is random. Averageresponse (C) shows significantly reduced noise. Copyright NandedkarProductions LLC, 2010.mal nerves with small SNAPs. Fortunately, the SNAP is timelockedto the stimulation while the noise occurs randomly (see Fig. 5B). Byaveraging several sweeps, the noise level is reduced to obtain a goodSNAP for measurements (See Fig. 5C). It is important to recognizethat a single large amplitude surface electromyography (EMG) spikecan appear like a SNAP after averaging 8 or 10 responses. It is important to make sure that the resulting averaged waveform is observedin each individual response used to compute the average. Alternately,two independent averages should be performed to demonstrate reproducibility of the small SNAP. The noise and interference can bereduced using many simple procedures that are common to all EDXstudies. They are summarized later.Because of poor signal-to-noise ratio and high stimulus artifacts, thenegative peak latency is generally preferred for analysis. Some laboratories also identify the onset latency of the SNAP. Using the distancebetween the cathode and active recording electrode, the CV can becomputed as:velocity (m/s) distance (mm) / onset latency (ms)Anatomic CorrelationThe SNAP is a sum of APs of all nerve fibers in the tested nerve.The SNAP onset indicates the AP arrival at the recording site. Notethat this recording setup does not involve any neuromuscular junctions or slow-conducting terminal axon branches. Therefore, theonset latency is also the time of the AP propagation between thestimulating and recording sites. Hence, a single stimulation site canbe used to compute the CV as described before. One can also studyconduction velocity for segments defined by two stimulation sitesusing the formula for motor nerve conduction velocity (MNCV). Asin MNCSs, the onset latency and conduction velocity reflect conduction in the fastest axons.The peak latency is measured from a summated response of fast andslow conducting axons. Theoretically, this may be a more sensitive wayto detect abnormality than the onset latency. Peak latency is usually notused to compute CV using a single SNAP. Peak latency can be used tocompute velocity between two different stimulation sites. In pathology,peak latency will be increased due to reduced CV.The SNAP amplitude reflects the number of nerve fibers. It willbe reduced due to the loss of axons and the reduced excitability ofaxons. The amplitude also decreases due to temporal dispersion. Asingle SMUP has a duration of several milliseconds (see the F waves).Hence a few milliseconds of temporal dispersion will still allow theSMUPs to summate in a CMAP. But, a single nerve fiber AP has avery short duration waveform ( 2 ms). Therefore, even 1 ms dispersion will not allow the APs to summate constructively (See Fig. 3B).As a result, phase cancellation causes significant am
San Antonio San Antonio, Texas Dr. Dumitru currently serves as professor with tenure in the Department of Rehabilitation Medicine at The University of Texas Health Science Center at San Antonio. He also serves as professor in the departments of Occupational Therapy and Physiology at The University of Texas Health Science Center at San Antonio.