Transcription
NCSS Statistical SoftwareNCSS.comChapter 201Descriptive Statistics– Summary TablesIntroductionThis procedure is used to summarize continuous data. Large volumes of such data may be easily summarized instatistical tables of means, counts, standard deviations, etc. Categorical group variables may be used to calculatesummaries for individual groups. The tables are similar in structure to those produced by cross tabulation.This procedure produces tables of the following summary statistics: CountMissing CountSumMeanStandard Deviation (Std Dev)Standard Error (Std Error)Lower 95% Confidence Limit for theMean (95% LCL)Upper 95% Confidence Limit for theMean (95% UCL)MedianMinimumMaximumRange Interquartile Range (IQR)10th Percentile (10th Pctile)25th Percentile (25th Pctile)75th Percentile (75th Pctile)90th Percentile (90th Pctile)VarianceMean Absolute Deviation (MAD)Mean Absolute Deviation from theMedian (MADM)Coefficient of Variation (COV)Coefficient of Dispersion (COD)SkewnessKurtosisTypes of Categorical VariablesNote that we will refer to two types of categorical variables: Group Variables and Break Variables.The values of a Group Variable are used to define the rows, sub rows, and columns of the summary table. Up totwo Group Variables may be used per table. Group Variables are not required.Break Variables are used to split a database into subgroups. A separate report is generated for each unique set ofvalues of the break variables.201-1 NCSS, LLC. All Rights Reserved.
NCSS Statistical SoftwareNCSS.comDescriptive Statistics – Summary TablesData StructureThe data below are a subset of the Resale dataset provided with the software. This (computer simulated) datagives the selling price, the number of bedrooms, the total square footage (finished and unfinished), and the size ofthe lots for 150 residential properties sold during the last four months in two states. This data is representative ofthe type of data that may be analyzed with this procedure. Only the first 8 of the 150 observations are displayed.Resale dataset ize10173130697065848483557056611614422Missing ValuesObservations with missing values in either the group variables or the continuous data variables are ignored. Theprocedure also allows you to specify up to 5 additional values to be considered as missing in categorical groupvariables.Summary StatisticsThe following sections outline the summary statistics that are available in this procedure.CountThe number of non-missing data values, n. If no frequency variable was specified, this is the number of rows withnon-missing values.Missing CountThe number of missing data values. If no frequency variable was specified, this is the number of rows withmissing values.SumThe sum (or total) of the data values.nSum xii 1201-2 NCSS, LLC. All Rights Reserved.
NCSS Statistical SoftwareNCSS.comDescriptive Statistics – Summary TablesMeanThe average of the data values.n xx i 1inVarianceThe sample variance, s2, is a popular measure of dispersion. It is an average of the squared deviations from themean.n (xs2 i 1i x )2n 1Standard Deviation (Std Dev)The sample standard deviation, s, is a popular measure of dispersion. It measures the average distance between asingle observation and the mean. It is equal to the square root of the sample variance.n (xs i 1 x )2in 1Standard Error (Std Error)The standard error of the mean, a measure of the variation of the sample mean about the population mean, iscomputed by dividing the sample standard deviation by the square root of the sample size.sx sn95% Confidence Interval for the Mean (95% LCL & 95% UCL)This is the upper and lower values of a 95% confidence interval estimate for the mean based on a t distributionwith n – 1 degrees of freedom. This interval estimate assumes that the population standard deviation is not knownand that the data for this variable are normally distributed.95% CI x ta/ 2,n 1s xMinimumThe smallest data value.MaximumThe largest data value.201-3 NCSS, LLC. All Rights Reserved.
NCSS Statistical SoftwareNCSS.comDescriptive Statistics – Summary TablesRangeThe difference between the largest and smallest data values.Range Maximum – MinimumPercentilesThe 100pth percentile is the value below which 100p% of data values may be found (and above which 100p% ofdata values may be found).The 100pth percentile is computed asZ100p (1-g)X[k1] gX[k2]where k1 equals the integer part of p(n 1), k2 k1 1, g is the fractional part of p(n 1), and X[k] is the kthobservation when the data are sorted from lowest to highest.MedianThe median (or 50th percentile) is the “middle number” of the sorted data values.Median Z50Interquartile Range (IQR)The difference between the 75th and 25th percentiles (the 3rd and 1st quartiles). This represents the range of themiddle 50% of the data. It serves as a robust measure of the variation in the data.IQR Z75 – Z25Mean Absolute Deviation (MAD)A measure of dispersion that is not affected by outliers as much as the standard deviation and variance. Itmeasures the average absolute distance between a single observation and the mean.n xMAD i 1i x nMean Absolute Deviation from the Median (MADM)A measure of dispersion that is even more robust to outliers than the mean absolute deviation (MAD) since themedian is used as the center point of the distribution. It measures the average absolute distance between a singleobservation and the median.n xMADM i 1i Median n201-4 NCSS, LLC. All Rights Reserved.
NCSS Statistical SoftwareNCSS.comDescriptive Statistics – Summary TablesCoefficient of Variation (COV)A relative measure of dispersion used to compare the amount of variation in two samples. It is calculated bydividing the standard deviation by the mean. Sometimes it is referred to as COV or CV.COV sxCoefficient of Dispersion (COD)A robust, relative measure of dispersion. It is calculated by dividing the robust mean absolute deviation from themedian (MADM) by the median. It is frequently used in real estate or tax assessment applications. n xi Median i 1 n MADM COD MedianMedianSkewnessMeasures the direction and degree of asymmetry in the data distribution.Skewness m3m23/ 2wheren (xmr i 1i x )rnKurtosisMeasures the heaviness of the tails in the data distribution.Kurtosis m4m22wheren (xmr i 1i x )rn201-5 NCSS, LLC. All Rights Reserved.
NCSS Statistical SoftwareNCSS.comDescriptive Statistics – Summary TablesExample 1 – Basic Variable Summary Report (No GroupVariables)The data used in this example are in the Resale dataset.SetupTo run this example, complete the following steps:1Open the Resale example dataset From the File menu of the NCSS Data window, select Open Example Data. 2Select Resale and click OK.Specify the Descriptive Statistics – Summary Tables procedure options Find and open the Descriptive Statistics – Summary Tables procedure using the menus or the ProcedureNavigator. The settings for this example are listed below and are stored in the Example 1a settings template. To loadthis template, click Open Example Template in the Help Center or File menu.OptionValueVariables TabData Variable(s) . Price, Bedrooms, Bathrooms, Garage, TotalSqftStatistics . Count, Mean, Std Dev, 95% LCL, 95% UCLReport Options (in the Toolbar)Variable Labels . Column Names3Run the procedure Click the Run button to perform the calculations and generate the output.Summary TableSummary Table VariableStatisticCountMeanStandard DeviationLower 95% CL MeanUpper 95% CL 071The table is created with the statistics as rows and the data variables as columns when the positions are both set to“Auto”.201-6 NCSS, LLC. All Rights Reserved.
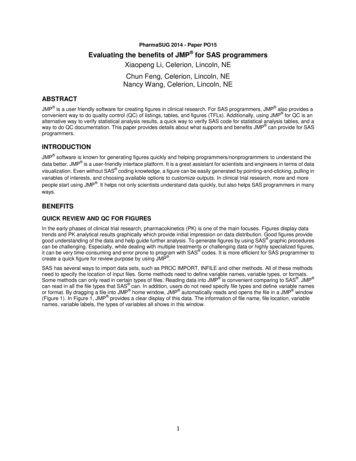
NCSS Statistical SoftwareNCSS.comDescriptive Statistics – Summary TablesPlots of Each StatisticPlots of each Statistic (More Plots Follow)The plots are not very informative because the variables have vastly different scales.Example 1b – Adjust Item Table Positions (Data Variables in Rows andStatistics in Columns)To rotate the table, all we have to do is change the position of one of the items. To do this, change DataVariable(s) Position to Rows and run the procedure again to get the results.4Modify the Data Variable(s) Position The settings for this section are listed below and are stored in the Example 1b settings template. To loadthis template, click Open Example Template in the Help Center or File menu.OptionValueVariables TabData Variable(s) Position . Rows5Run the procedure Click the Run button to perform the calculations and generate the output.201-7 NCSS, LLC. All Rights Reserved.
NCSS Statistical SoftwareNCSS.comDescriptive Statistics – Summary TablesSummary Table .5636252754.2496Lower 95%CL Mean1586362.2760932.2701581.1757311771.689Upper 95%CL Mean1901482.5639082.5298421.3576022015.071The table is now rotated with the data variables as rows and the statistics as columns. Notice that the actualsummary statistic values are exactly the same.201-8 NCSS, LLC. All Rights Reserved.
NCSS Statistical SoftwareNCSS.comDescriptive Statistics – Summary TablesExample 2 – Variable Summary Report (One Group Variable)The data used in this example are in the Resale dataset.SetupTo run this example, complete the following steps:1Open the Resale example dataset From the File menu of the NCSS Data window, select Open Example Data. 2Select Resale and click OK.Specify the Descriptive Statistics – Summary Tables procedure options Find and open the Descriptive Statistics – Summary Tables procedure using the menus or the ProcedureNavigator. The settings for this example are listed below and are stored in the Example 2a settings template. To loadthis template, click Open Example Template in the Help Center or File menu.OptionValueVariables TabData Variable(s) . Price, TotalSqft, LotSizeStatistics . Count, Mean, Std DevInclude Group Variable 1 . CheckedVariables . StateReport Options (in the Toolbar)Variable Labels . Column LabelsData Labels . Value Labels3Run the procedure Click the Run button to perform the calculations and generate the output.201-9 NCSS, LLC. All Rights Reserved.
NCSS Statistical SoftwareNCSS.comDescriptive Statistics – Summary TablesSummary TableSummary Table VariableStateStatisticCountMeanStandard DeviationSalesPrice88170762.598665.72Total Area(Sqft)881881.33788.569Lot rd 6.5972301.226TotalCountMeanStandard 6.9132376.334NevadaThe table displays the group variable values as the rows, the statistics as the subrows, and the data variables as thecolumns. The plots are not shown because they are not very informative because the variables have vastlydifferent scales. Totals are given for the group variable.Example 2b – Adjust Item Table Positions (Data Variables in Rows,Statistics in Sub Rows, and Group Variable in Columns)To rotate the table, all we have to do is change the position of one of the items. To do this, change DataVariable(s) Position to Rows and run the procedure again to get the results.4Modify the Data Variable(s) Position The settings for this section are listed below and are stored in the Example 2b settings template. To loadthis template, click Open Example Template in the Help Center or File menu.OptionValueVariables TabData Variable(s) Position . Rows5Run the procedure Click the Run button to perform the calculations and generate the output.Summary Table StateVariableStatisticCountMeanStandard 596771.49Total15017439297656.81Total Area (Sqft)CountMeanStandard .38754.2496Lot Size (Sqft)CountMeanStandard 6.9132376.334Sales Price201-10 NCSS, LLC. All Rights Reserved.
NCSS Statistical SoftwareNCSS.comDescriptive Statistics – Summary TablesThe table is now rotated with the data variables as rows and the group variable values as columns. Notice that theactual summary statistic values are exactly the same.Example 2c – Adjust Item Table Positions (Data Variables in Rows, GroupVariable in Sub Rows, and Statistics in Columns)To change the table so that statistics are presented as columns with the group variable as subrows and the datavariables as rows, change the position of Statistics to Columns with the position for Data Variable(s) still set toRows and run the procedure again to get the results.6Modify the Statistics Position The settings for this section are listed below and are stored in the Example 2b settings template. To loadthis template, click Open Example Template in the Help Center or File menu.OptionValueVariables TabStatistics Position. Columns7Run the procedure Click the Run button to perform the calculations and generate the output.Summary Table 5.7296771.4997656.81Total Area 3.38788.569708.6572754.2496Lot Size 66.9132419.882301.2262376.334Sales PriceThe table now has the data variables as rows and the group variable values as subrows with the statistics ascolumns.201-11 NCSS, LLC. All Rights Reserved.
NCSS Statistical SoftwareNCSS.comDescriptive Statistics – Summary TablesExample 3 – Variable Summary Report (Two Group Variables)The data used in this example are in the Pain dataset. In this example we will show you how to make even morecustomizations to adjust the appearance of the tables and plots and how easy it is to make position adjustments.SetupTo run this example, complete the following steps:1Open the Pain example dataset From the File menu of the NCSS Data window, select Open Example Data. 2Select Pain and click OK.Specify the Descriptive Statistics – Summary Tables procedure options Find and open the Descriptive Statistics – Summary Tables procedure using the menus or the ProcedureNavigator. The settings for this example are listed below and are stored in the Example 3a settings template. To loadthis template, click Open Example Template in the Help Center or File menu.OptionValueVariables TabData Variable(s) . PainStatistics . Mean, Minimum, 25th Pctile, Median, 75th Pctile, MaximumInclude Group Variable 1 . CheckedVariables . DrugInclude Group Variable 2 . CheckedVariables . TimeReport Options TabDisplay Group Variable Marginal . UncheckedTotals on the Summary TablesUse Short Statistical Names . Checkedon Reports and PlotsSum, Mean, CI Limits . 2Plots TabSeparate PlotsShow Bar Charts. CheckedShow Line Charts . UncheckedBar Chart Format (Click the Button)Numeric Axis TabMax (Boundaries) . 100Combined PlotsShow Bar Charts. CheckedShow Line Charts . Unchecked201-12 NCSS, LLC. All Rights Reserved.
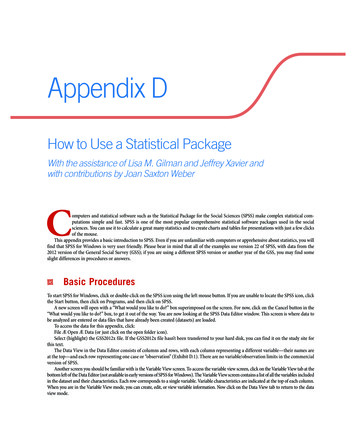
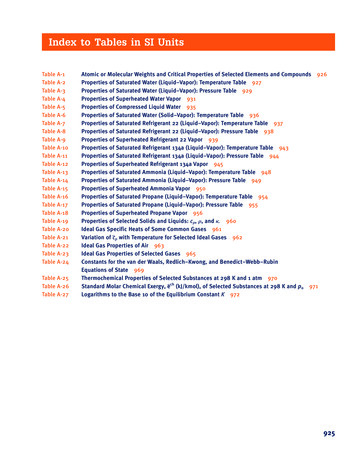
NCSS Statistical SoftwareNCSS.comDescriptive Statistics – Summary TablesBar Chart Format (Click the Button)Group Axis TabLower Axis Tick Label Layout (Click the Button)Alignment . RightRotation Angle . 45Margin Above the Text . 103Run the procedure Click the Run button to perform the calculations and generate the output.OutputSummary Table of Pain TimeDrugStatisticMeanMin25th PctileMedian75th 43337414546LaposecMeanMin25th PctileMedian75th laceboMeanMin25th PctileMedian75th erlosinThe table is displays Group Variable 1 (Drug) values as the rows, the statistics as the subrows, and GroupVariable 2 (Time) values as the columns.Plots of each Statistic for Pain (More Plots Follow)201-13 NCSS, LLC. All Rights Reserved.
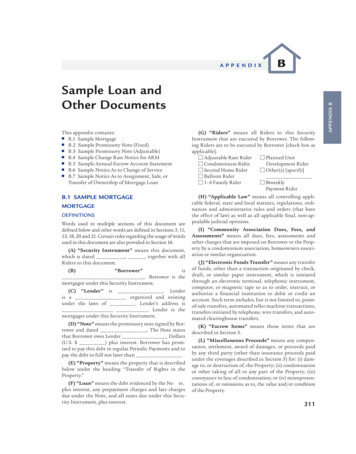
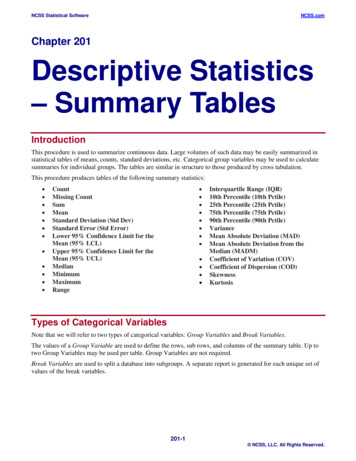
NCSS Statistical SoftwareNCSS.comDescriptive Statistics – Summary TablesIndividual plots are created with the table row item (Group Variable 1 --- “Drug”) on the group (X) axis and thetable column item (Group Variable 2 --- “Time”) as the legend variable. A separate plot is created for eachstatistic. These plots are very useful for seeing overall trends. From the plots shown here, it is apparent that theaverage and minimum pain response is lower for both drugs than for placebo and that the pain control is betterover time. Kerlosin appears to control pain the best from these results. Statistical tests would need to beperformed, however, to assert statistical significance in the differences.Combined Plot of Pain The combined plot displays all of the information in the table. We rotated the group axis labels so they would notoverlap and be readable. The table row item (Group Variable 1 --- “Drug”) and table sub row item (Statistic) arecombined on the group (X) axis. The table column item (Group Variable 2 --- “Time”) is the legend variable.201-14 NCSS, LLC. All Rights Reserved.
NCSS Statistical SoftwareNCSS.comDescriptive Statistics – Summary TablesExample 3b – Adjust Item Table Positions (Group 2 Variable in Rows,Group 1 Variable in Sub Rows, and Statistics in Columns)To change the orientation on the tables and plots, simply change the position the items. We will display theStatistics as the columns and Time as the rows. This will put Drug as the sub row.4Modify the Statistics and Group Variable 2 Positions The settings for this section are listed below and are stored in the Example 3b settings template. To loadthis template, click Open Example Template in the Help Center or File menu.OptionValueVariables TabStatistics Position. ColumnsGroup Variable 2 Position . Rows5Run the procedure Click the Run button to perform the calculations and generate the output.Summary Table of Pain 674556684658700.5The table is displays Group Variable 2 (Time) values as the rows, Group Variable 1 (Drug) values as the subrows,and the statistics as the columns.201-15 NCSS, LLC. All Rights Reserved.
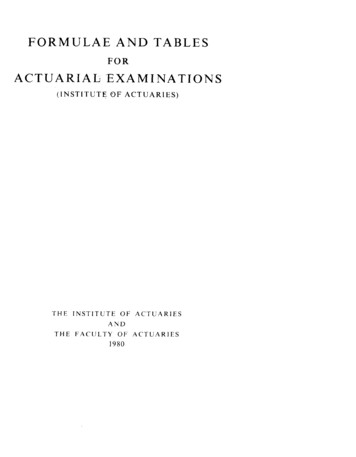
NCSS Statistical SoftwareNCSS.comDescriptive Statistics – Summary TablesPlots of each Statistic for Pain (More Statistic Plots Follow)The individual plots are different now with the table row item (Group Variable 2 --- “Time”) on the group (X)axis and the table column item (Group Variable 1 --- “Drug”) as the legend variable. A separate plot is created foreach statistic. These plots are again useful for seeing overall trends. There is a very distinct reduction in pain overtime.Combined Plot of Pain Again, the combined plot displays all of the information in the table. The table row item (Group Variable 2 --“Time”) and table sub row item (Group Variable 1 --- “Drug”) are combined on the group (X) axis. The tablecolumn item (Statistic) is the legend variable.201-16 NCSS, LLC. All Rights Reserved.
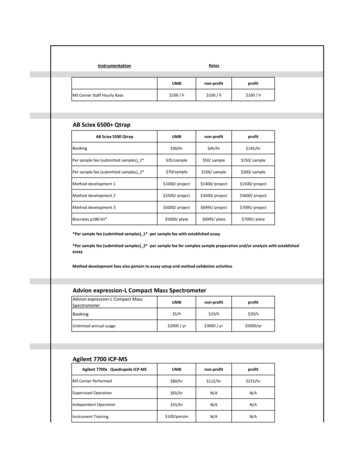
NCSS Statistical SoftwareNCSS.comDescriptive Statistics – Summary TablesExample 3c – Adjust Item Table Positions (Creating a Separate Table foreach Data Variable and Statistic Combination)It is easy to create a separate table for each data variable and statistic combination (this can only be done whenthere is at least one group variable). We will display a separate table for each statistic with Time as the rows andDrug as the columns. There will be no sub row item.6Modify the Data Variable(s), Statistics, and Group Variable 2 Positions The settings for this section are listed below and are stored in the Example 3c settings template. To loadthis template, click Open Example Template in the Help Center or File menu.OptionValueVariables TabData Variable(s) Position . TablesStatistics Position. TablesGroup Variable 2 Position . Rows7Run the procedure Click the Run button to perform the calculations and generate the output.Summary Table of Mean of Pain bo78.1476.2970.8672.1465.1465.43Plot of Mean of Pain 201-17 NCSS, LLC. All Rights Reserved.
NCSS Statistical SoftwareNCSS.comDescriptive Statistics – Summary TablesSummary Table of Min of Pain 555544647Placebo696662676160Plot of Min of Pain (Report continues with table and plot for each Data Variable/Statistic combination)A separate table is created for each Data Variable/Statistic combination. If more than one data variable wereentered, the report would be even longer. There is no combined plot in the output because the combined plot is thesame as the individual plot in this case.201-18 NCSS, LLC. All Rights Reserved.
NCSS Statistical Software NCSS.com Descriptive Statistics - Summary Tables 201-6 NCSS, LLC. All Rights Reserved. Example 1 - Basic Variable Summary Report (No .