Transcription
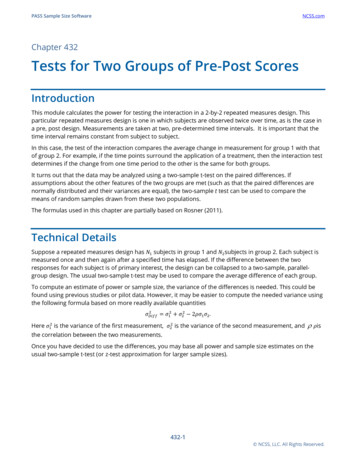
PASS Sample Size SoftwareNCSS.comChapter 432Tests for Two Groups of Pre-Post ScoresIntroductionThis module calculates the power for testing the interaction in a 2-by-2 repeated measures design. Thisparticular repeated measures design is one in which subjects are observed twice over time, as is the case ina pre, post design. Measurements are taken at two, pre-determined time intervals. It is important that thetime interval remains constant from subject to subject.In this case, the test of the interaction compares the average change in measurement for group 1 with thatof group 2. For example, if the time points surround the application of a treatment, then the interaction testdetermines if the change from one time period to the other is the same for both groups.It turns out that the data may be analyzed using a two-sample t-test on the paired differences. Ifassumptions about the other features of the two groups are met (such as that the paired differences arenormally distributed and their variances are equal), the two-sample t test can be used to compare themeans of random samples drawn from these two populations.The formulas used in this chapter are partially based on Rosner (2011).Technical DetailsSuppose a repeated measures design has 𝑁𝑁1 subjects in group 1 and 𝑁𝑁2 subjects in group 2. Each subject ismeasured once and then again after a specified time has elapsed. If the difference between the tworesponses for each subject is of primary interest, the design can be collapsed to a two-sample, parallelgroup design. The usual two-sample t-test may be used to compare the average difference of each group.To compute an estimate of power or sample size, the variance of the differences is needed. This could befound using previous studies or pilot data. However, it may be easier to compute the needed variance usingthe following formula based on more readily available � 𝜎𝜎12 𝜎𝜎22 2𝜌𝜌𝜎𝜎1 𝜎𝜎2 .Here 𝜎𝜎12 is the variance of the first measurement, 𝜎𝜎22 is the variance of the second measurement, andthe correlation between the two measurements.ρ 𝜌𝜌isOnce you have decided to use the differences, you may base all power and sample size estimates on theusual two-sample t-test (or z-test approximation for larger sample sizes).432-1 NCSS, LLC. All Rights Reserved.
PASS Sample Size SoftwareNCSS.comTests for Two Groups of Pre-Post ScoresData Model for Measurements X(group, time)Time 1 MeasurementsTime 2 MeasurementsGroup 1: X11 N[μ11, σ(T1)]Group 1: X12 N[μ12, σ(T2)]Group 2: X21 N[μ21, σ(T1)]Group 2: X22 N[μ22, σ(T2)]whereX N[μ, σ] means X is distributed normally with mean μ and standard deviation σ.Difference in Mean Changes, δTest statistical hypothesis aboutδ δ2 - δ1whereδ1 μ12 - μ11 (change in group 1)δ2 μ22 - μ21 (change in group 2)Case 1 – Standard Deviations Known and Equal (Z-Test)When 𝜎𝜎1 𝜎𝜎2 𝜎𝜎 and are known, the power of the t test is calculated as follows for a directional alternative(one-tailed test) in which 𝛿𝛿 0. Since the standard deviations are rarely known, this case usually used whenquick results based on the normal approximation to the t-test is desired. This is the case presented inRosner (2011).1. Find 𝑧𝑧α such that 1 Φ(𝑧𝑧α ) α, where Φ(𝑥𝑥) is the area under the standardized normal curve to theleft of x.2. Calculate 𝜎𝜎𝑋𝑋̄ 𝜎𝜎𝐷𝐷𝐷𝐷𝐷𝐷𝐷𝐷 3. Calculate 𝑧𝑧𝑝𝑝 𝑧𝑧𝛼𝛼 𝜎𝜎𝑋𝑋̄ 𝛿𝛿1𝑁𝑁1 1𝑁𝑁2𝜎𝜎𝑋𝑋̄4. Calculate Power 1 Φ 𝑧𝑧𝑝𝑝 .432-2 NCSS, LLC. All Rights Reserved.
PASS Sample Size SoftwareNCSS.comTests for Two Groups of Pre-Post ScoresCase 2 – Standard Deviations Unknown and Equal (T-Test)When 𝜎𝜎1 𝜎𝜎2 𝜎𝜎 and are unknown, the power of the t test is calculated as follows for a directionalalternative (one-tailed test) in which 𝛿𝛿 0.1. Find 𝑡𝑡α such that 1 𝑇𝑇𝑑𝑑𝑑𝑑 (𝑡𝑡α ) α, where 𝑇𝑇𝑑𝑑𝑑𝑑 (𝑡𝑡α ) is the area under a central-t curve to the left of x and𝑑𝑑𝑑𝑑 𝑁𝑁1 𝑁𝑁2 2.2. Calculate 𝜎𝜎𝑋𝑋̄ 𝜎𝜎𝐷𝐷𝐷𝐷𝐷𝐷𝐷𝐷 1𝑁𝑁1 1𝑁𝑁2.3. Calculate the noncentrality parameter 𝜆𝜆 4. Calculate 𝑡𝑡𝑝𝑝 𝑡𝑡𝛼𝛼 𝜎𝜎𝑋𝑋̄ 𝛿𝛿𝜎𝜎𝑋𝑋̄ �) is the area to the left of x under a noncentral-t curve 𝑡𝑡𝑝𝑝 , where 𝑇𝑇𝑑𝑑𝑑𝑑,λ5. Calculate: Power 1 𝑇𝑇𝑑𝑑𝑑𝑑,λwith degrees of freedom df and noncentrality parameter λ.432-3 NCSS, LLC. All Rights Reserved.
PASS Sample Size SoftwareNCSS.comTests for Two Groups of Pre-Post ScoresExample 1 – Power after a StudySuppose you are planning a repeated measures (longitudinal) study to compare blood pressures in a groupreceiving a special drug to a control group not receiving any drug. From previous studies, you know that thestandard deviation of the control group is 16 at baseline and 14 at follow-up two days later. Since the twomeasurements are only two days apart, you decide to use rather high correlation valued of 0.6 and 0.8. Youwould like to determine the power to detect a difference of 4 for group sample sizes of 10 to 200 inincrements of 20 when alpha is 0.05 for a two-sided t-test based on the differences.SetupIf the procedure window is not already open, use the PASS Home window to open it. The parameters for thisexample are listed below and are stored in the Example 1 settings file. To load these settings to theprocedure window, click Open Example Settings File in the Help Center or File menu.Design TabSolve For . PowerTest Type . T-TestAlternative Hypothesis . Ha: δ 0 (Two-Sided)Alpha. 0.05Group Allocation . Equal (N1 N2)Sample Size Per Group . 10 to 200 by 20δ . 4σ(T1) . 16σ(T2) . 14ρ . 0.6 0.8OutputClick the Calculate button to perform the calculations and generate the following output.Numeric ReportsNumeric Results for Comparing Mean Change in a Repeated Measures Design Solve For:PowerTest Type:T-TestHypotheses: H0: δ 0 vs. H1: δ 0 PowerN1N2Nδσ(T1)σ(T2)ρσ(Diff)Alpha 2-4 NCSS, LLC. All Rights Reserved.
PASS Sample Size SoftwareNCSS.comTests for Two Groups of Pre-Post 0.05 PowerN1 and N2Nδσ(T1) and σ(T2)ρAlphaThe probability of rejecting a false null hypothesis when the alternative hypothesis is true.The number of items sampled from each population.The total sample size. N N1 N2.The mean change of group 2 minus the mean change of group 1 assuming the alternative hypothesis.The standard deviations of measurements at time 1 and time 2, respectively.The correlation between a pair of observations made on the same subject. σ(Diff) is the standard deviationof the paired differences, assumed equal for the two groups.The probability of rejecting a true null hypothesis.Summary Statements A 2-by-2 repeated measures design consists of two groups of subjects, each measured at two time points. In thiscase, the primary goal of the study is to compare the change across time in group 1 to the change across time ingroup 2. Sample sizes of 10 in group 1 and 10 in group 2 achieve 10% power to detect a difference in meanchanges of 4 with a standard deviation of 16 at the first time point, a standard deviation of 14 at the second timepoint, and a correlation between measurement pairs of 0.6. The significance level (alpha) is 0.05 using a two-sided,two-sample t-test. Dropout-Inflated Sample Size Dropout-InflatedExpectedEnrollmentNumber ofSample SizeSample SizeDropouts Dropout RateN1N2NN1'N2'N'D1D2D 021321342643438620%190190380238238476484896 Dropout RateN1, N2, and NN1', N2', and N'D1, D2, and DThe percentage of subjects (or items) that are expected to be lost at random during the course of the studyand for whom no response data will be collected (i.e., will be treated as "missing"). Abbreviated as DR.The evaluable sample sizes at which power is computed (as entered by the user). If N1 and N2 subjectsare evaluated out of the N1' and N2' subjects that are enrolled in the study, the design will achieve thestated power.The number of subjects that should be enrolled in the study in order to obtain N1, N2, and N evaluablesubjects, based on the assumed dropout rate. N1' and N2' are calculated by inflating N1 and N2 using theformulas N1' N1 / (1 - DR) and N2' N2 / (1 - DR), with N1' and N2' always rounded up. (See Julious,S.A. (2010) pages 52-53, or Chow, S.C., Shao, J., Wang, H., and Lokhnygina, Y. (2018) pages 32-33.)The expected number of dropouts. D1 N1' - N1, D2 N2' - N2, and D D1 D2.432-5 NCSS, LLC. All Rights Reserved.
PASS Sample Size SoftwareNCSS.comTests for Two Groups of Pre-Post ScoresDropout Summary Statements Anticipating a 20% dropout rate, 13 subjects should be enrolled in Group 1, and 13 in Group 2, to obtain final groupsample sizes of 10 and 10, respectively. References Rosner, Barnard. 2011. Fundamentals of Biostatistics, Seventh Edition. Brooks/Cole. Boston, MA. This report shows the values of each of the parameters, one scenario per row.Plots SectionPlots 432-6 NCSS, LLC. All Rights Reserved.
PASS Sample Size SoftwareNCSS.comTests for Two Groups of Pre-Post ScoresThis plot shows the relationship between sample size and power for each value of ρ.432-7 NCSS, LLC. All Rights Reserved.
PASS Sample Size SoftwareNCSS.comTests for Two Groups of Pre-Post ScoresExample 2 – Validation using Rosner (2011)Rosner (2011) page 306 calculates the power for a longitudinal study in which the standard deviations areboth 15, the correlation is 0.7, the sample sizes are both 75, the mean change is 5, and a two-sided z-test isused with an alpha of 0.05. Rosner computes the power as 0.75.SetupIf the procedure window is not already open, use the PASS Home window to open it. The parameters for thisexample are listed below and are stored in the Example 2 settings file. To load these settings to theprocedure window, click Open Example Settings File in the Help Center or File menu.Design TabSolve For . PowerTest Type . Z-TestAlternative Hypothesis . Ha: δ 0 (Two-Sided)Alpha. 0.05N1 (Sample Size Group 1) . 75N2 (Sample Size Group 2) . Use RR (Sample Allocation Ratio) . 1.0δ . 5σ(T1) . 15σ(T2) . σ(T1)ρ . 0.7OutputClick the Calculate button to perform the calculations and generate the following output.Numeric Results for Comparing Mean Change in a Repeated Measures Design Solve For:PowerTest Type:Z-TestHypotheses: H0: δ 0 vs. H1: δ 0 PowerN1N2Nδσ(T1)σ(T2)ρσ(Diff)Alpha 0.750257575150515150.711.6190.05 Note that the results of PASS match those of Rosner.432-8 NCSS, LLC. All Rights Reserved.
PASS Sample Size Software NCSS.com Tests for Two Groups of Pre-Post Scores 432-2 NCSS, LLC. All Rights Reserved. Data Model for Measurements X(group, time)