Transcription
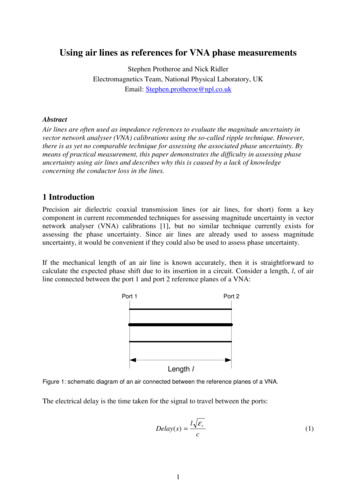
Using air lines as references for VNA phase measurementsStephen Protheroe and Nick RidlerElectromagnetics Team, National Physical Laboratory, UKEmail: Stephen.protheroe@npl.co.ukAbstractAir lines are often used as impedance references to evaluate the magnitude uncertainty invector network analyser (VNA) calibrations using the so-called ripple technique. However,there is as yet no comparable technique for assessing the associated phase uncertainty. Bymeans of practical measurement, this paper demonstrates the difficulty in assessing phaseuncertainty using air lines and describes why this is caused by a lack of knowledgeconcerning the conductor loss in the lines.1 IntroductionPrecision air dielectric coaxial transmission lines (or air lines, for short) form a keycomponent in current recommended techniques for assessing magnitude uncertainty in vectornetwork analyser (VNA) calibrations [1], but no similar technique currently exists forassessing the phase uncertainty. Since air lines are already used to assess magnitudeuncertainty, it would be convenient if they could also be used to assess phase uncertainty.If the mechanical length of an air line is known accurately, then it is straightforward tocalculate the expected phase shift due to its insertion in a circuit. Consider a length, l, of airline connected between the port 1 and port 2 reference planes of a VNA:Port 1Port 2Length lFigure 1: schematic diagram of an air connected between the reference planes of a VNA.The electrical delay is the time taken for the signal to travel between the ports:Delay ( s ) 1l εrc(1)
whereεr relative permittivity of line’s dielectric, εr 1.000649 for air at 23 ºCc speed of light 2.997925 108 m.s-1.For a coaxial line, the phase response, φ, is linear with frequency:φ(rad ) 2πf delay ω delay(2)where angular frequency (rad.s-1)f frequency (Hz).Henceφ 2πfl ε rc β0l(3)whereβ0 phase constant (rad.m-1) 2πf ε r.cThe measured phase (-π θ π) can be found from the phase response as1:θ(rad ) π mod(φ π,2π) .(4)Conversely, the phase response may be calculated from the measured phase:φ(rad ) mod(2π θ,2π) 2πn(5)where n is an integer (n 0, 1, 2, ).The electrical length of the line may therefore be calculated from the measured phase using:l c(2πn θ)2πf ε r (2πn θ).β0(6)Since there are multiple solutions to equations (5) and (6), the correct value for n can bedetermined by finding a length that is within a given tolerance of the nominal length. This1The modulo arithmetic operator mod(φ π, 2π) returns the remainder after (φ π) is divided by 2π.2
tolerance is dependent on the frequency (wavelength) of the measurement, e.g. at 18 GHz itwill be approximately 20 mm.2 MeasurementsThree 50 ohm air lines fitted with precision 7 mm connectors were selected for thisinvestigation: two nominal 100 mm lines from different manufacturers (i.e. Hewlett Packardand Maury Microwave) and one nominal 300 mm line (manufactured by Maury Microwave).The mechanical lengths of these lines were measured by a UKAS-accredited laboratory.2The S-parameters of the lines were measured using NPL’s primary national standard VNAmeasurement system to obtain the best possible accuracy. The electrical length of the lineswas calculated using equation (6) from both S21 and S12 phase data and compared with themechanical length. Figure 2 shows a plot of the difference in length between the electrical andmechanical determinations, as a function of frequency.0.600Length difference,Electrical - Mechanical 00080001000012000140001600018000Frequency (MHz)Figure 2: showing the difference in length between the electrical and mechanical determinations of thelength for the 300 mm line.2A correction was applied to these length measurements to take account of the difference in temperaturebetween the UKAS-accredited calibration laboratory temperature (i.e. 20 ºC) and NPL’s VNA laboratorytemperature (23 ºC).3
This Figure shows that the electrical determination of the line’s length produces a longerlength value than the mechanical determination at all frequencies. The length difference isalso frequency dependent. Finally, Figure 2 also shows that the data derived from S21 isessentially the same as that derived from S12 (as is to be expected for a reciprocal device) andso only S21 data will be shown in the plots that follow.Figure 3 shows a similar plot to Figure 2 except that the data for the two 100 mm lines hasbeen included. As before, there is a systematic difference between the electrical andmechanical determinations of the length – the electrical determinations measured the lines tobe longer than their mechanical length. However, this difference is less for the 100 mm linesthan it is for the 300 mm line.Again, as before, the length difference is frequency dependent. However the frequencydependence is less for the 100 mm lines than it is for the 300 mm line.0.5000.450HP 100mmLength difference,Electrical - Mechanical (mm)0.400Maury 100mmMaury 40006000800010000120001400016000Frequency (MHz)Figure 3: showing the difference in length between the electrical and mechanical determinations oflength for the two 100 mm lines and the 300 mm line.3. Lossless versus lossy linesThe theory presented so far in this paper has assumed that the air lines are lossless. However,in practice, this will not be the case. To illustrate this, Figure 4 shows measurements of thelinear magnitude of S21 (i.e. equivalent to the attenuation, or ‘loss’) of the lines as a functionof frequency.418000
A consequence of this loss is to increase the value of the phase constant from its losslessvalue, β0, by an amount that is dependent on frequency. For example, althoughβ0 1201.22 m-1 at 1 GHz, the electrical length measurement indicates a value that issomewhat higher.1.0000.9950.990Magnitude (U)0.9850.9800.9750.9700.965HP 100mmMaury 100mm0.960Maury 0018000Frequency (MHz)Figure 4: S21 linear magnitude, with uncertainties shown as ‘error bars’, for each air line.From the measured phase data and mechanical length, equation (6) can be used to determine avalue for the actual phase constant, , taking into account the loss in the line:β (2πn θ )l(7)If we now consider a lossy coaxial line in detail, then:γ α jβ (R jωL )(G jωC )whereγ propagation constantα attenuation constant (Np.m-1)R series resistance (Ω.m-1)L series inductance (H.m-1)5(8)
G shunt conductance (S.m-1)C shunt capacitance (F.m-1)It has been shown that [2]:R 2ωL0 d 0 1 k 2 a 2 F02L L0 1 2d 0 1 k 2 a 2 F02G ωC 0 d 0 k 2 a 2 F0(C C 0 1 d 0 k 2 a 2 F0)where-1L0 series inductance of lossless line (H.m ) C0 shunt capacitance of lossless line (F.m-1) ( a)µ ln b2π2πεln ba( )a radius of line’s centre conductor (m)b radius of line’s outer conductor (m)k angular wavenumber, k 2π/λ (rad.m-1)ε permittivity, ε ε0εr (F.m-1)ε0 permittivity of free space, ε0 c2µ0 (F.m-1)µ permeability, µ µ0µr (H.m-1)µ0 permeability of free space, µ0 4π 10-7 (H.m-1)µr relative permeability of line’s dielectric, µr 1 for airF0 and d0 are constants defined as:b)( 1 (b ) ln (b ) 1aa a2F0d02( a ) (b a ) 1δ (1 (b a )) 4b ln (b )a2 ln bb 12 aswhereδs skin depth (m) ρπfµandρ resistivity (Ω.m).6
Since the radii a and b are known for these lines, equation (7) and the imaginary part ofequation (8) can be equated and a value for the resistivity can be determined. Figure 5 showsvalues of resistivity determined in this way for the three air lines under investigation.600HP 100 mm500Maury 100 mmResistivity (nOhm.m)Maury 300 0018000Frequency (MHz)Figure 5: values of resistivity for each air line as a function of frequency.The uncertainties shown in Figure 5 have been calculated by observing the changes in thecalculated resistivity due to offsetting each of the calculation’s input parameters, in turn, byits standard uncertainty. These ‘component uncertainties’ are then combined using aroot-sum-of-squares approach.3 The error bars on the graph show the uncertainties at a 95%level of confidence (i.e. using a coverage factor, k 2).4. DiscussionFigure 5 shows the values of resistivity for each air line that are needed to cause the electricaland mechanical determinations of each line’s length to become equal (to within the stateduncertainties). It is interesting to note that the values of resistivity calculated for each air lineagree with each other to within the stated uncertainties. The calculated resistivity also appearsto rise slightly with frequency whereas perhaps one might expect this to remain effectively3A sensitivity analysis of the model derived from equations (6) and (7) has shown that the dominant componentto the overall uncertainty is due to the measured phase. Other components, such as the measured mechanicallength and temperature effects, were found to have a negligible effect on the overall uncertainty of the resistivitydetermination.7
constant over this range of frequencies. However, any such frequency dependence is onlyslight and well within the stated uncertainties. In fact, the results could be further summarisedby choosing a value of approximately 150 nΩ.m, which could be applicable across this entirefrequency range.The above experimentally determined resistivity value of 150 nΩ.m can be compared with‘textbook’ values for suitable materials. For example, in [3], a value for the resistivity of brassat room temperature is given as 63 nΩ.m. This is considerably less than the value determinedin this paper. This could be for the following reasons:1) It is not certain that the air lines’ conductors are made of brass, although brass is amaterial that can be used to fabricate such air lines [4]. Other suitable materials(e.g. beryllium copper, which is also often used to fabricate air lines) will havedifferent values of resistivity;2) The textbook value of 63 nΩ.m has probably been derived from measurements madeat DC and therefore may not be representative of the resistivity at high frequencies.However, the lack of significant frequency dependence observed in this paper tends tosuggest that values derived at DC will not be too different from values at higherfrequencies;3) Textbook values of resistivity usually refer to bulk samples of materials, whereas themetal used for air lines is often formed by depositing layers using electroplating andmachining techniques. The degree of compactness and surface finish, along with atendency for electroplated surfaces to become porous, will cause the resistivity to varysignificantly from a textbook value of a bulk sample. This will usually result in anincrease in the loss (and hence the resistivity) of the material used to construct the line[5]. Such an increase is consistent with the discrepancy observed above.For the above reasons, it is desirable to establish a convenient method for determining theresistivity of a particular line under the conditions to which it is used. The development ofsuch a method is currently work-in-progress at NPL and is based on an earlier experimentaltechnique [6]. Early indications suggest that the value of 150 nΩ.m is not unrealistic for thelines considered in this investigation [7].5. ConclusionThe practical difficulty of using air lines as references for VNA phase measurements has beendemonstrated. The electrical length will appear longer than the mechanical length of the line ifthe assumption that the line being used is lossless. Air lines are therefore only useful asaccurate phase references if their loss is considered. This requires an accurate knowledge ofthe resistivity of the conductors of the line and this is likely to be a property of each individualline in question.When a method becomes available to reliably and conveniently determine the loss in a givenline, then this paper has shown that these lines will become suitable reference devices forverifying VNA phase measurements. This will provide a significant improvement to thecurrent international guidelines for evaluating VNA measurements given in [1].8
6. References[1]“EA Guidelines on the Evaluation of Vector Network Analysers (VNA)”, Europeanco-operation for Accreditation, publication reference EA-10/12, May 2000.(Available from: www.european-accreditation.org.)[2]W C Daywitt, “First-order symmetric modes for a slightly lossy coaxial transmissionline”, IEEE Trans, MTT-38(11):1644-1651, Nov 1990.[3]Kaye & Laby: http://www.kayelaby.npl.co.uk/general physics/2 6/2 6 1.html[4]“Type 900 air lines”, The General Radio Experimenter, 37(11):7-8, Nov 1963.[5]B O Weinschel, “Errors in coaxial air line standards due to skin effect”, MicrowaveJournal, 33(11):131-143, Nov 1990.[6]G J Kilby and N M Ridler, “Comparison of theoretical and measured values forattenuation of precision coaxial lines”, IEE Electronics Letters, 28(21):1992-1994,Oct 1992.[7]C P Eiø and N M Ridler, “Characterising air lines using VNA loss measurements”,BEMC 2005 conference digest, National Physical Laboratory, November 2005.9
and Maury Microwave) and one nominal 300 mm line (manufactured by Maury Microwave). The mechanical lengths of these lines were measured by a UKAS-accredited laboratory.2 The S-parameters of the lines were measured using NPL's primary national standard VNA measurement system to obtain the best possible accuracy. The electrical length of the lines