Transcription
Project Number: MQPBXT1201Total Cost of Ownership Model: A Framework for HanoverA Major Qualifying Project Report:Submitted to the Facultyof theWORCESTER POLYTECHNIC INSTITUTEin partial fulfillment of the requirements for theDegree of Bachelor of SciencebyTaylor Demers, MISRachael Huntress, MISSerena Makkaoui, MISDate: February 27th, 2013Approved:Professor Bengisu Tulu, Advisor Page
Table of ContentsList of Figures . iiiList of Tables. ivAbstract . vExecutive Summary . viAuthorship. viiAcknowledgments . viii1. Introduction . 12. Background. 32.1 TCO Models proposed in Literature . 32.2 Breakdown of Cost . 62.3 Importance of Aligning IT and Business Strategies. 102.4 Hanover’s Approach . 122.4.1 Information Technology Service Management (ITSM) . 132.4.2 Information Technology Infrastructure Library (ITIL). 142.4.3 Hanover’s 2007 TCO Model Attempt . 162.5 Technology Business Management Solutions . 162.5.1 Apptio. 172.5.2 CUBEbilling . 182.5.3 Costnomics. 182.5.4 ComSci . 192.6 Summary . 213. Methodology . 223.1 Document Analysis . 223.2 Interviews. 233.3 Data Analysis . 244. Interview Results . 254.1 Assessment of Hanover’s Current Alignment Strategy . 254.2 TCO Model’s Value . 264.3 Breakdown of Cost at Hanover. 275. Proposed TCO Model . 285.1 Our Approach . 285.2 Our TCO Model . 306. Discussion . 366.1 Model Maintenance. 366.2 Value of the Model . 376.3 Alternative Matrix . 377. Recommendation and Conclusions . 427.1 Recommendation 1: Launching the TCO Model . 427.1.1 Step 1: Implementation of Proposed Model . 427.1.2 Step 2: Expansion of the TCO Model . 427.1.3 Step 3: Consider Advanced Analytic Solutions . 43i Page
7.27.37.4Recommendation 2: Data Maintenance . 43Recommendation 3: Change Management . 44Conclusion . 44References . 45Appendix A-Interview Protocol . 46Appendix B-IRB Approval Letter . 47Appendix C-Resources Spreadsheet . 48Appendix D-Cost Drivers Spreadsheet . 52Appendix E-TCO Model Worksheets . 55Total Cost Per Line of Business Worksheet . 55PL-Transaction Counts Worksheet . 56CL-Transaction Counts Worksheet . 57PL-Percentages Worksheet . 58CL-Percentages Worksheet . 59PL-Total Cost Breakdown Worksheet . 60CL-Total Cost Breakdowns Worksheet . 61ii P a g e
List of FiguresFigure 1: Inspired by Communication of the ACM TCO model layout inspired by (Smith,2002) . 4Figure 2: “A Simple Model for Determining True Total Cost of Ownership for DataCenters” TCO model excel spreadsheet(Koomey, 2007) . 7Figure 3: ITIL Service Strategy (Broadbent, 2002) . 9Figure 4: Hanover’s ITIL Service Strategy (Archives, 2011) . 15Figure 5: Costnomics Dash-boarding feature (http://costnomics.com/products/screenshots.html) . 19Figure 6: ComSci TBM Solution (http://www.comsci.com/). 21Figure 7: Total Cost per Line of Business Worksheet . 32Figure 8: PL Transactions Worksheet . 33Figure 9: PL Percentages Worksheet . 34Figure 10: PL Total Cost Breakdown Worksheet . 35Figure 11: Transaction Counts per Application: Personal Lines Dashboard . 38Figure 12: Total Cost per Application: Personal Lines Dashboard . 38Figure 13: Alternative Matrix . 39iii P a g e
List of TablesTable 1: Hanover Interviewees . 24iv P a g e
AbstractFinancial pressures are forcing companies to focus on calculating Total Cost ofOwnership (TCO) of Information Technology (IT) assets and their business value.Hanover Insurance had attempted to develop a TCO model in the past. This model wasnot implemented due to a limited set of defined metrics. This project proposes a TCOmodel that includes a larger set of metrics, which allows the company to calculate thecosts derived by IT assets and the business value these assets generate.v Page
Executive SummaryThe Hanover Technology Group (HTG) needed to develop an understanding ofthe drivers of each line of business in order to properly spread costs across the company.Through this project, we created a Total Cost of Ownership (TCO) model to help HTGdetermine the value of their current IT costs while maintaining alignment. The projectobjectives were:Objective 1: Understand Hanover’s Business and IT StrategiesObjective 2: Analyze business processes within two lines of business: PersonalLines and Commercial Lines.Objective 3: Determine links between IT applications and business processesanalyzed in the two lines of business.Objective 4: Develop a TCO model that takes into consideration the ITinfrastructure and alignment between business processes.We reviewed the literature to examine previous TCO models used by othercompanies, breakdown of cost techniques, and business drivers, which are crucial indeveloping an effective TCO model. We also reviewed research studies, internaldocuments, and Hanover’s approach of achieving alignment with InformationTechnology Service Management (ITSM) and Information Technology InfrastructureLibrary (ITIL). Lastly, we explored the topic of Technology Business Managementvi P a g e
(TBM) and analyzed packaged TBM solutions which are an alternative to calculatingTotal Cost of Ownership.Initially, we researched scholarly articles on TCO models used by othercompanies. These models provided situational examples to help determine the mostapplicable TCO model for Hanover. After understanding other approaches to creating aTCO model, we scrutinized internal resources to gain a stronger perspective of Hanover’sbusiness processes. More specifically, we studied the process maps for Personal Linesand Commercial Lines to better understand how Hanover structures its business withinthese lines. In addition, we analyzed internal data worksheets that contained theapplications and products used by the company. These internal worksheets were crucialin deciding the components of our TCO model.To enhance our understanding from literature review and document analysis, weinterviewed the CIO’s from each line of business at Hanover. We used these interviewsto gauge the opinions of both business and IT perspectives on the approach to the newTCO model. After accumulating outlooks on the problem, we were able to establish astronger understanding of the specific needs in creating a successful TCO model forHanover.In order to determine the drivers of our TCO model, we met with the BusinessProcess Architects to discuss the main transactions, core applications, and products forPersonal Lines and Commercial lines. We limited our project scope to 16 coreapplications and four main transactions. These transactions were chosen because theyheld the highest percent of usage by the determined core applications. We determinedvii P a g e
that having a transaction-based model provides an opportunity to better align ITapplications and business processes, a theme we heard frequently in our interviews. Wedeveloped the following equation to calculate Total Cost of Ownership in our model: This equation allows Hanover to better align the IT and Business side, because thetransactions provide a link between the IT applications and business products. Along withthe TCO Excel worksheet, we incorporated a visual representation of the data derived bythe above equation. These two deliverables generate value for Hanover Insurance becauseit allows the company to benchmark across company standards, as well as, slicefinancials while providing cost transparency.At the end of this project, we created a TCO model for Hanover and provided thecompany with the following recommendations:Recommendation 1: The new TCO model should be employed with a three-stepapproach. The first two steps include the implementation of the proposed model, and theexpansion of the model with minor applications, third-party services, and additionaltransactions. The third step recommended Hanover to consider other advanced analyticsolutions such as TBM.Recommendation 2: Hanover should update their Business Process Maps andSystems Impacts model data every six months in order to easily maintain the TCO model.viii P a g e
Recommendation 3: Proper training and a value-added presentation weresuggested to gain the confidence of the employees and minimize resistance to change.In summary, through this project we were able to improve our data miningabilities as well as our qualitative and analytical skills. Through our efforts, we hope thismodel will provide a solid framework to assist Hanover Insurance with the delineation oftheir current IT costs.ix P a g e
AuthorshipEach team member has contributed equally to the writing and editing of all sections ofthis report.vii P a g e
AcknowledgmentsThe team would like to acknowledge and thank the following individuals for theguidance and assistance they provided throughout the duration of the project:Project SponsorsKarin Winsky, Program DirectorMark Malkasian, Program ManagerHanover EmployeesJustin Brooks, Business Analyst IIDave Trigo, VP Hanover TechnologyCilsy Harris, VP Hanover TechnologySean Hauver, VP Hanover TechnologyRaymond Balser, Director of HTG OperationsDonald Beesley, Keane WorcesterDonald Howe Hughes, Application Technical LeadBusiness Process Architects TeamLori Caron, Enterprise Architect-BusinessMatthew Loehr, Strategic Business ConsultantDanielle Daviau, Strategic Business ConsultantWorcester Polytechnic InstituteProfessor Bengisu Tulu, School of Businessviii P a g e
1. IntroductionManaging information technology (IT) investments, expenditures, costs andbenefits are a challenge for most companies as tighter budget controls on IT spending areimplemented commonly across industries. Executives have found that understanding theTotal Cost of Ownership (TCO) within IT could allow companies to more accuratelybudget their future costs (Smith, 2002). In this report, we use the term Total Cost ofOwnership to refer to the direct and indirect costs of applications used to support lines ofbusiness. This description of TCO provides a balanced approach to emphasizing both theoperations and technology components in these models. Hanover, like many othersuccessful businesses, understands the value of evaluating their IT services. In thisproject, we advise Hanover Technology Group (HTG) on the best approach in assessingcurrent and future budget by creating a Total Cost of Ownership model for the company.This reliable model highlights the opportunity for technology standardization and allowsHanover to benchmark against industry standards.One of the main motivations of Hanover’s initiative is to create a TCO modelthat will inadvertently cause IT staff to think of business capabilities and the future ofHanover’s budget. In doing so, Hanover strives to maintain and further improvealignment between business and IT. The Technology and business sectors are toodynamic to be easily connected. By creating strategic alignment maturity, businesses areable to identify with a successful business strategy. Furthermore, HTG needs to developan understanding of the drivers of each line of business in order to properly spread costsacross the company. HTG had attempted to come up with a TCO model for IT in 2007,1 Page
but their biggest challenge was repeatability and maintainability within the model. HTGhas defined valuable metrics over the past five years that helped form a strong platformfor the new TCO model. HTG asked us to approach this problem again and develop anew model that meets HTG’s needs and functions well within the current environment.In order to attain our goal, as a project team we upheld the following objectives:Objective 1: Understand Hanover’s Business and IT StrategiesObjective 2: Analyze business processes within two lines of business: Personal Linesand Commercial Lines.Objective 3: Determine links between IT applications and business processes analyzed inthe two lines of business.Objective 4: Develop a TCO model that takes into consideration the IT infrastructureand alignment between business processes.This report continues with a summary of the background information collected bythe team followed by a brief description of the methods used in this project. We thenpresent interview results and our TCO model. The Discussion section touches on thevalue gained from our model and the Recommendation section discuss what we believe isthe best approach for Hanover. The Conclusion section presents a summary of the keyfindings from our project.2 Page
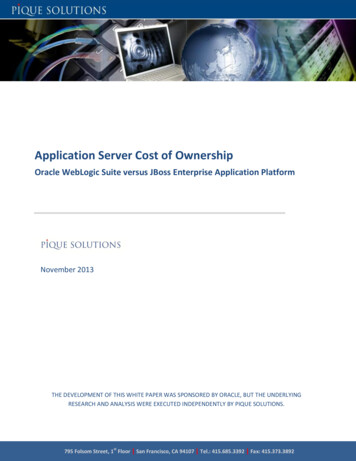
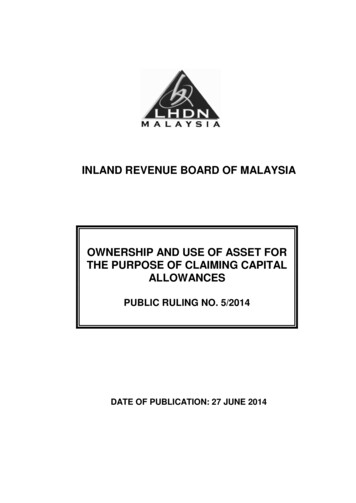
2. BackgroundIn this section, we have articulated the literature review that was conducted inorder to provide a direction for the TCO model. The literature review is made up ofinternal documents, case studies, and scholarly articles. The topics discussed includeprevious TCO models used by companies and the breakdown of cost and drivers that arecrucial to developing an effective TCO model. The topic of alignment was discussed,along with Hanover’s approach of achieving alignment with Information TechnologyService Management (ITSM) and Information Technology Infrastructure Library (ITIL).Lastly, the topic of Technology Business Management (TBM) and an analysis ofcompanies that currently implement TBM conclude the background section.2.1 TCO Models proposed in LiteratureThere are several TCO Models that reflect what businesses can use in order tobetter understand their IT costs. By implementing and analyzing a TCO model, thesecompanies will be able to reduce their overall IT expenditure. Many times, companieswill overestimate the value of specific applications, which causes them todisproportionally request high IT support levels. We looked into various TCO models inliterature and internal documents in order to better grasp the approach that was taken forHTG’s TCO model. Below are the three most relevant TCO models to the projectobjectives.According to a study (Smith, 2002), IT cost can be separated into two main sets ofcost factors to create a TCO model; acquisition cost and administration costs. Figure 1presents a detailed chart of the TCO Model breakdown inspired by the study (Smith,2002). In this study, acquisition costs include hardware and software. On the other hand,3 Page
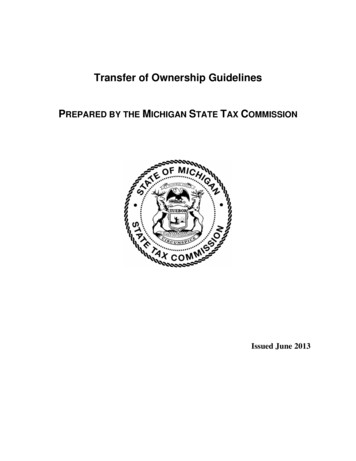
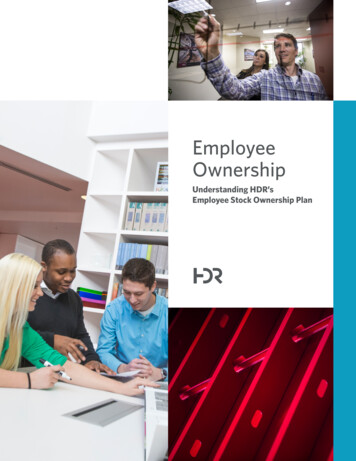
administration costs include control and operational costs that can be even further brokendown. Control costs include implementation and maintenance of both centralization andstandardization. Operational costs involve support, evaluation, installation upgrades,training, downtime, futz, auditing viruses, and power consumption. These costs weredeveloped into an equation that derived a per-seat cost. Per-seat cost is simplified into thebelow equation: , ,AdministrationCostsAquisition CostsHardware SoftwareControlImplementationand Maintenanceof CentralizationImplementationand Maintenanceof ationUpgradesTrainingDowntimeFutzAuditing VirusesPowerConsumptionFigure 1: Inspired by Communication of the ACM TCO model layout inspired by (Smith, 2002)In another paper (Koomey, 2007), the TCO model was split into IT hardware andsoftware such as servers, disks, tape storage, and networking. This model had taken theenergy usage and cost into consideration by comparing themselves to other companyusages and costs. In turn, this model developed a relation to current technology data for4 Page
other high-performance computing program’s financials. Furthermore, this TCO model,as depicted in Error! Reference source not found., recommended that data center’sevaluate their “architectural and engineering fees, interest during production phase, land,inert gas fire suppression costs, IT build-out costs for racks, cabling, internal routers andswitches, point-of-presence connections, external networking and communications fees,electricity costs, security costs, and operations and maintenance costs for both IT andfacilities.” This allowed the data center to better assess their energy usage as well as theirIT expenditure. See Error! Reference source not found. for a detailed layout of thespreadsheet used to hold this relevant information (Koomey, 2007) .In addition to the TCO models we found in the academic literature, weinvestigated TCO models in Hanover’s internal archives. One of the TCO modelsinvolved an innovation-driven pharmaceutical company called Lilly (Archives, 2010b)This company, like many other companies, overestimated their applications, which hascaused disproportionately high IT support levels. Therefore, Lilly decided that animplementation initiative to educate business partners on value and total cost of existingapplications portfolio was necessary for the improvement of the company’s capital usage.The approach of this pharmaceutical company was to correlate the costs with thebenefits of applications in order to determine their importance to the company throughthe use of scorecarding. Scorecarding provides a way for business users to trackemployee performance. Through the use of key performance indicators (KPIs), a visualrecord of results is created. KPIs can include sales performance, margins, or amountssold. The scorecard then makes target goals, and monitors the company’s progresstowards them. Scorecarding is a good way to communicate important strategies in an5 Page
effective way. These indicators can be tailored for many industries, as they assist withbudget decisions and benchmarkingCreating score applications that allowed the business to weigh out businessobjectives demonstrated the impact of investing, or choosing to not invest, in anapplication. This was a zero to one based scale that looked into both qualitative andtechnical factors. After accumulating this data, the company was then able to reduce cost,increase value, retire and/or keep as is (Archives, 2010b).2.2 Breakdown of CostCost is an important component to developing a well-designed model. Weevaluated the most frequently used costs within a TCO model. These costs includedinfrastructure costs, annual support costs, direct costs, and per-seat costs.Infrastructure costs are concerned with “the portion of the shared infrastructurethat a particular application utilizes” (Archives, 2012). These costs refer to the hardwareand software costs associated with a process for a given line of business. For example,most processes must pass through multiple automated activities. For each activity, thesoftware and hardware have both an initial purchase cost and continual maintenancecosts. Infrastructure costs are the accumulated cost of purchase and maintenance costs forone activity.Direct costs are important for most companies who use applications that involvetechnology. Direct costs “include application maintenance costs and depreciation.”(Archives, 2012). For example, for any given user, they must have access to technicalsupport, repair, and up-to-date technology in order to complete the task at hand. Annualsupport costs umbrella part of direct costs, but on a much larger scale.6 Page
Figure 2: “A Simple Model for Determining True Total Cost of Ownership for Data Centers” TCO model excel spreadsheet(Koomey, 2007)7 Page
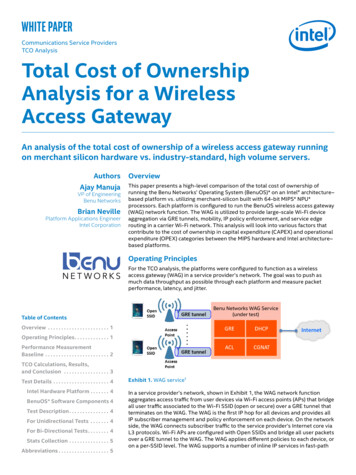
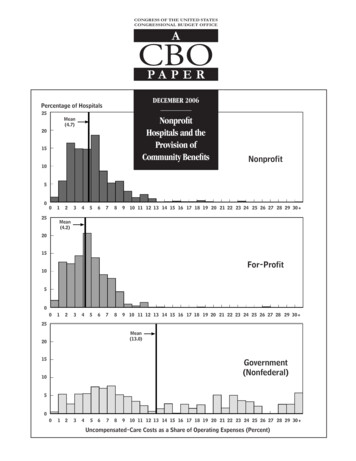
They are not determined on a daily basis, but must be calculated when determining thevalue of an application. These particular costs include “the ongoing costs necessary tosustain the program in the future, including maintenance, staffing, and upgrades,calculated by averaging three years of support costs after achieving scale” (Archives,2012). When considering staffing costs, it is also very important to include the cost oftraining. Training can involve materials, training leaders, and employee payments. Perseat cost combines every cost associated with one user. The formula is as such, ( , , ! , ! , , "# , , , % , , & , % )(Smith, 2002).Drivers are a key factor to the overall layout of the model when considering acompany’s Total Cost of Ownership. Depending on the needs of the company, the driversmay change according to the model type; application-based or transaction-based. Overallthe drivers will spread the cost in a presentable and maintainable manner, which is whythey are crucial to the development of a TCO model.Infrastructure drivers “[support] the enterprise IT applications via standardizedinterfaces,” as shown in Figure 3 (Broadbent, 2002). With these drivers businesses cancommunicate with customers and business partners in a standardized and efficient way.The infrastructure is broken into two main parts; physical and management-orientedclusters. Within the figure, the overarching clusters have strong dependencies with eachother, which is why many of the management-oriented clusters touch several differentcomponents. The physical clusters, which are the dark blue clusters, contain components8 Page
that use technology to improve business standards and efficiency. The managementoriented cluster uses education and organization to control and maintain the physicalcluster.Figure 3: ITIL Service Strategy (Broadbent, 2002)One example of how breakdown of cost can address both technical andoperational issues is illustrated in the MetLife case study. MetLife, a well-knowninsurance company, has developed steps of best practice to define IT services from thebottom up. This approach helps to “take advantage of business capabilities definedthrough the formal business architecture process” (Archives, 2010a). The processoutlined by the MetLife case study provides a guide on how to identify the lines ofbusiness, processes, IT infrastructure, and relevant applications. The value of this casestudy was its consideration of the business side of the company including who actuallyuses applications and in what capacity. The previous TCO models discussed in Section2.1 primarily focused on the IT side of the business, which can lead to unaligned businesssectors.In determining a business strategy, it requires a detailed understanding of thebusiness processes and capabilities in order to determine how to achieve the end-goal. It9 Page
is important to define the business strategy for each line of business relevant to theproject. MetLife recommended discussing with each business partner their point of viewon their business strategy in order to identify any inconsistencies across the company.The second step in the MetLife case study is to identify business processes. Once thebusiness processes are clearly outlined, key business activities will be seen. Theseprocesses help to determine relevant business services, and may reveal importantbusiness drivers.Once business processes are clearly understood, they should be linked to thecompany applications. Linking the two, maps the IT infrastructure. In this step,applications for each capability are identified and mapped as well. When considering thebusiness processes and applications, one has to consider what factors drive the cost ofutilizing the services involved in each process. Whether it is a financial driver or a driverof IT infrastructure, the TCO model needs to address the various aspects that caninfluence the Total Cost of Ownership of the company.2.3 Importance of Aligning IT and Business StrategiesAlignment involves setting the priorities of IT with the business strategy. I
Total Cost of Ownership (TCO) within IT could allow companies to more accurately budget their future costs (Smith, 2002). In this report, we use the term Total Cost of Ownership to refer to the direct and indirect costs of applications used to support lines of business. This description of TCO provides a balanced approach to emphasizing both the