Transcription
Automated Identification of Food SubstitutionsUsing Knowledge Graph EmbeddingsJulie Loesch1 , Louis Meeckers1 , Ilse van Lier2,3[0000 0001 8381 1252] , Alie deBoer2[0000 0002 6500 4649] , Michel Dumontier4[0000 0003 4727 9435] , and RemziCelebi4[0000 0001 7769 4272]1Data Science and Knowledge Engineering, Maastricht University, niversity.nl2Food Claims Centre Venlo, Campus Venlo, Maastricht University, Venlo,Netherlands3Chair Youth, Food, and Health, Maastricht University Campus stitute of Data Science, Maastricht University, tuniversity.nlAbstract. Healthy eating is a daily challenge for many, which is influenced by various factors such as taste, accessibility, price, and the foodenvironment. Consumers often are insufficiently informed about healthieroptions for the foods they consume. Being able to identify healthy alternatives for foods according to similarities in nutritional value will helpconsumers choose products that they prefer. This work aims to identifyhealthy alternatives to foods that also have similar nutritional characteristics through the use of knowledge graph embeddings (KGEs). Thequality of the KGEs is assessed against a newly created ground truth,which is verified by two domain experts. Hence, this work presents anewly created ground truth food substitution data set and describes thedevelopment of a food recommender system that identifies healthier alternatives to foods.Keywords: Healthy food choice · nutritional profile · ingredient substitution · Knowledge graph embedding · Food similarity.1IntroductionAn unhealthy diet is associated with an increased risk on a range of healthissues and diseases. Multiple studies have shown that chronic diseases such ascardiovascular disease, high blood pressure, type 2 diabetes, some cancers, andpoor bone health are linked to poor dietary habits [1]. At the same time, healthcrises such as the COVID-19 pandemic highlight the importance of a healthydiet, as dietary and health status have been shown to influence people’s abilityto prevent, combat, and recover from infections [2]. Even though no specificfoods or dietary supplements can prevent or cure infections such as COVID-19,healthy diets are important to support an individual’s immune system [3].Copyright 2022 for this paper by its authors. Use permitted under Creative Commons License Attribution 4.0 International (CC BY 4.0).
2Loesch et al.While healthy diets are known to be important, it is known that individualsdo not always make healthy dietary choices. Even though information about nutritional values, ingredients, and even health effects of foods is made available onfood labels, this information is not always used to make healthy dietary decisions[4,5]. There are various factors that influence the food choices individuals make,which are not limited to social, political, cultural, and individual factors (e.g.,habits). General knowledge of nutritional aspects of food plays an important roleas well [6]. Studies show a relation between nutrition knowledge of individualsand their overall diet quality [7,8]. Providing individuals with tools to select unfamiliar foods that are similar to, or even have a better nutritional value, thanthe ones they are familiar with, could increase the quality of their diet and subsequently, their overall health. To this extent, it is important to create a systemthat provides individuals with personalized dietary information [6].Previous efforts to automate the selection of food substitutions have been limited by the absence of an accepted data set of valid substitutions. For this reason,Shirai and colleagues [9] proposed to scrape online resources for a ground truthfood substitution data set and developed a heuristic that ranks plausible foodsubstitutions. The researchers created semantically interlinked food information by linking USDA5 , FoodOn Ontology [10] and FoodKG [11]. Moreover, theauthors incorporated “healthy” ingredient substitution options into their workas previous works did not consider personal dietary constraints on nutritionalinformation. Shirai and colleagues [9] considered two categories of dietary constraints, namely restrictions on the types of ingredients that may be consumed(e.g., replacing meat-based ingredients for vegetarian alternatives or replacingallergens such as peanuts), and limitations on the consumption of certain nutrients (e.g., replacing high-carb ingredients with low-carb alternatives). However,their “healthy” ingredient substitution options are limited, which is why ourwork explores the use of knowledge graph embeddings to identify a broad rangeof food substitution options.More precisely, this study presents an approach to find alternative food products with comparable or more favourable nutritional profiles that fall within asimilar product category using knowledge graph embeddings. With this, a recommender system is built that suggests healthier substitutes for the ingredientsand food products to its user. The knowledge graph of food is based on twoopen data sets, namely OpenFoodFacts6 , which is a food products database,and USDA, which provides nutritional information of food products. Furthermore, due to the low quality and unavailability of the existing ground truths(food review and cook thesaurus, used in the work of Shirai, et al., 2021 [9]), wecurated an expert-verified data set for the evaluation of food substitution recommendations. The data and code to generate the analysis are made availableat our Github repository7 U-IDS/healthy-food-subs
Automated Identification of Food Substitutions22.13BackgroundKnowledge GraphsA knowledge graph is a graph, composed of a set of assertions (edges labeledwith relations) that are expressed between entities (vertices). A knowledge graphis made up of three main components: nodes, edges, and labels. Any object,place, or person can be a node, while an edge defines the relationship betweenthe nodes. The directed edges are often called triplets and are represented as a(h, r, t) tuple, where h is the head entity, t is the tail entity, and r is the relationassociating the head with the tail entities. For instance, the triplet (banana,contains, protein) would describe the fact that protein is contained in a banana.2.2KG Embeddings and SimilarityKnowledge graph embeddings are low-dimensional representations of the entitiesand relations in a KG. Compared to high-dimensional representations of KGssuch as the adjacent matrix, these representations are more efficient at identifying the semantic similarities. There are many popular KGE models, such asTransE [12] and Complex [13]. Essentially, what most methods do is to create avector for each entity and each relation. These embeddings are then generated insuch a way that they capture latent properties of the semantics in the knowledgegraph, that is, similar entities and similar relationships will be represented withsimilar vectors. Thus, these KGE models differentiate by their scoring function,which measures the distance of two entities relative to its relation type in thelow-dimensional embedding space. These score functions are used to train theKGE models so that the entities connected by relations are close to each other,while the entities that are not connected are far away.3Related WorkEftimov and colleagues [14] showed the utility of representing food data as embeddings, which are in the form of vectors of continuous numbers. The authors used the FoodEx2 data, which is a comprehensive system for classifying and describing food items developed by the European Food Safety Authority (EFSA) [15] to learn vector representations by using the Pointcaré graphembedding learning method [16]. The authors showed the utility of such vectorrepresentations on four different problems: i) automated determination of different food groups, ii) automated detection of the food class for each food concept(raw, derivative or composite), iii) identification of most similar food conceptsfor a given food concept, and iv) qualitative evaluation by a food expert. Hence,the authors introduced the concept of vector representations for food, or foodembeddings, that can be used for downstream food data analysis and is available as an open-source resource. Moreover, their experiments have shown thatthe FoodEx2vec embeddings outperformed traditional feature representationsfor food data analysis.
4Loesch et al.One common problem when people prepare food is that some required ingredients of a recipe are not available. In order to deal with this issue, Pan andcolleagues [17] collected recipe data of different cuisine styles from a websitehosting thousands of recipes (Spoonacular8 ) to generate ingredient and recipeembeddings. Calculating the cosine similarity (i.e. the measure of similarity thatcomputes the cosine of the angle between two non-zero vectors) of two ingredients or two recipes enables people to choose alternative ingredients, or evenrecipes. For instance, the authors found out that “Calamari” is the substituteof “Carrot”. However, no formal evaluation of the results is provided by theauthors.A promising way to find food substitutes is to use the vast amounts of (mostlytextual) cooking-related data to draw conclusions about which food items can replace one another. For that reason, Pellegrini and colleagues [18] exploited NLPtechniques and trained two models, namely word2vec [19] (named Food2Vec)and BERT [20] (named FoodBERT) on recipe instructions from the Recipe1M dataset9 . The Food2Vec approach is divided in two parts. The first part calculates text-based embeddings for all ingredients and optimally concatenates themwith image-based embeddings. In the second part, these embeddings are usedin addition with KNN to predict food substitutes. The only difference to theFoodBERT approach is that the latter calculates text-based embeddings for upto 100 occurrences of every ingredient and adds a further scoring and filteringstep before predicting food substitutes. The authors evaluated their results byhuman evaluation and created a list of ground truth substitutes for a subset ofingredients, showing good performance.Transey and colleagues [21] presented diet2vec, which is a scalable and robustapproach for modeling nutritional diaries from smart phone apps. The authorsanalyzed massive amounts of nutritional data generated by 55k active users ofa diet tracking app, called LoseIt10 . To model the foods, the authors first ranword2vec [19] on the names of the food and subsequently ran weighted k-meansto cluster the foods into 5, 000 “food words”, placing 20% of the weight onthe name and 80% of the weight on the nutrients. The authors then generatedmeal vectors via the DBOW model of paragraph2vec [22]. Similar to the foods,the authors clustered the meal vectors to get “meal words”. The authors thenrepresented each user’s diet as a bag of meal words and again generated dietvectors, which were clustered into 100 diet words. The clusters generated bythe authors are interpretable: however, no formal evaluation of the results isprovided.4MethodologyThe first step was to construct knowledge graph data in RDF format and createsemantically interlinked food knowledge by linking OpenFoodFacts and .csail.mit.edu/lhttps://www.loseit.com/
Automated Identification of Food Substitutions5In the second step, food substitution recommendations were extracted using theknowledge graph by applying different graph embedding approaches, namely,TransE [12], Complex [13] and RDF2Vec [23].4.1DatasetsUSDA USDA consists of 8,618 different foods and provides the informationon both macronutrients and micronutrients. To incorporate the USDA data setinto a knowledge graph, we used the previous work (also known as FoodKG) ofHaussmann et al., 2019 [11].OpenFoodFacts OpenFoodFacts is an open and collaborative database whichgathers more than 1, 600, 000 products from over 150 countries. For each foodproduct, information such as categories, nutritional data, Nutri-Score, ingredients, origin, and allergens were retrieved.Ground Truth To create ground truth substitution data, we first looked ataccessible substitution data from Food.com reviews11 . We used the script provided by [9]12 to scrape the substitutions from Food.com reviews. We linked theingredients to the USDA food items via Limes framework (see Section Linkingfor the details). The linking was reviewed manually and incorrect matches forthe ground truth ingredients were removed from the ground truth. After cleaning and linking, 1,841 candidate substitute pairs remained from 3,846 samples inthis dataset. We built an additional candidate food substitution list to increasethe amount of available substitutions. We used the RDF2Vec-based similarityalgorithm (see Section Embeddings) for the most commonly consumed foodsto generate candidate substitutions and took the top 20 foods with the highest similarity scores for each food. Two domain experts (nutrition scholars andco-authors AdB and IvL) were asked to annotate these candidate food pairs asbeing a correct substitution or not, based on a pre-determined set of criteria.Before labeling, the experts compiled a list of criteria for nutritional contentsimilarity 13 based on data about macronutrients and various micronutrientsand then applied this list to the candidate substitution dataset. Two researchersreviewed the list of 3,344 candidate substitutions between 966 unique food itemsindependently and labeled all items based on the criteria defined. The annotation results were compared with each other and the inter-agreement betweenthe two experts was computed using Cohen Kappa score. The Kappa score forinter-agreement between these two experts was 0.88, which indicates a strongagreement. In total, 1,847 substitutions spanning 786 unique food items approvedby both experts were added to the ground tary material: https://doi.org/10.6084/m9.figshare.16658284.v1
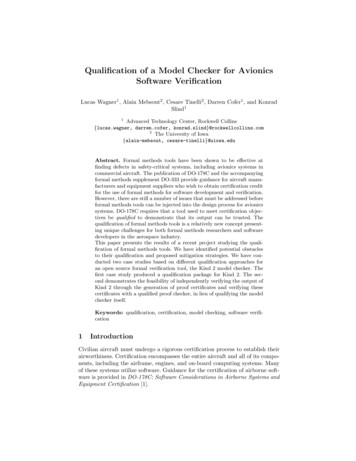
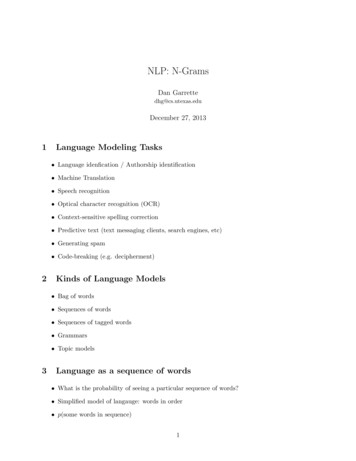
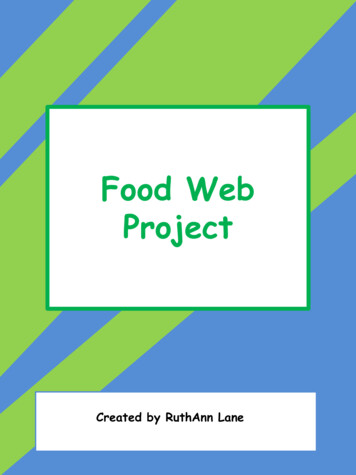
6Loesch et al.4.2LinkingWe used Limes14 , a discovery framework for linking the Web of Data, to create relations between the food ingredients of USDA and OpenFoodFacts using acosine similarity measure. More precisely, the metric employed evaluates the similarity between two input strings, taking an inner product space that measuresthe cosine of the angle between their vector representations. We set a thresholdof 0.8 to accept results from linked ingredients based on manual inspection.4.3Enrichment of Knowledge GraphThe KG was enriched by tagging the ingredients based on the nutritional contentwe calculated according to the U.S. FDA’s Recommended Dietary Allowances(RDAs)15 . The tags that indicate the presence of rich mineral or vitamin contentwere added to the knowledge graph. Each food was tagged as high in a nutrientif the level of that nutrient contained in the food per serving is more than 30% ofits respective RDA. This is the cut-off point that is used for nutritional contentclaims in the EU. In the EU, a nutritional content claim that a food is high in acertain vitamin or mineral, and any claim likely to have the same meaning for theconsumer, may only be made where the product contains at least twice the valueof ‘source of (NAME OF VITAMIN/S) and/or (NAME OF MINERAL/S)’. Inother words, the food should contain at least 30% of the RDA of a specificmineral/vitamin to be tagged as ‘high in’. The distribution of the generatedtags from the USDA dataset is depicted in Figure 1.4.4EmbeddingsTransE Translation based embedding model (TransE) [12] is a representativetranslational distance model that represents entities and relations as vectors inthe same semantic space. A relational fact is represented as a triplet (h, r, t)where h stands for the head, r represents the relation, and t denotes the tail.A vector representation of every entity and relation in the knowledge graph canbe computed by training a neural network model, which minimizes the energyfunction f (h, r, t) h r t . The key idea is to make the sum of the headvector and the relation vector as close as possible to the tail vector.Complex Complex [13] scoring function is based on the Hermitian dot product, meaning that it involves the conjugate-transpose of one of the two vectors.Consequently, the dot product is not symmetric anymore, which is why complexvectors can effectively capture anti-symmetric relations.RDF2Vec RDF2vec [23] is a tool for creating vector representations of RDFgraphs by creating a numeric vector for each node in an RDF graph. Thus,RDF2Vec [23] generates (random) walks on the knowledge graph data to be usedas input for word2vec [19] neural networks. Word2vec [19] represents each esFood Component: https://www.fda.gov/media/99059/download and Nutrient:https://www.fda.gov/media/99069/download
Automated Identification of Food Substitutions7Fig. 1: Number of Tags per Nutrient.with a low-dimensional vector, called word embeddings, where semantically andsyntactically closer words appear closer in the vector space. Thus, word2vec [19]trains a neural network model to learn vector representation of words to predicta target word from its surrounding words.5Evaluation and ResultsWe first applied TransE [12], Complex [13], and RDF2Vec [23] models on different subsets of the knowledge graph. The results of the experiments are shown inTable 1a. We evaluated the performance of the models by using Mean ReciprocalRank (MRR), Mean Average Precision (MAP), and Recall Rate at k (RR@k).The MRR is the average of the reciprocal rank, which measures the reciprocalof the rank (multiplicative inverse of the rank) at which the first relevant ingredient was retrieved. The MAP is the average of the average precision, whichis the mean of the precision after each relevant food is retrieved. The RR@kis the proportion of relevant ingredients found in the top-k recommended foodsubstitutions.Table 1a shows that the best performance results were obtained with theRDF2Vec method. RDF2Vec achieved a Recall Rate of 0.33 and 0.4 for thetop 5 and top 10 results respectively, indicating a significant performance fora recommender system. While the MAP and MRR values seem relatively low,0.133 and 0.234, it should be noted that these metrics were calculated by looking
8Loesch et al.Table 1: Results of experiments(a) Without filteringUSDA KGEUSDA Tags KGEUSDA Tags OpenFoodFacts 4540.4140.438(b) With filtered ranking using food categoryUSDA KGEUSDA Tags KGEUSDA Tags OpenFoodFacts 0.2530.2470.259at the rank order of the substitute foods among all food items in the USDAdatabase (8,618 ingredients), not only ground truth foods.In order to see how food category information affects the results, we restrictedthe recommended substitutes to be in the same food category as the query food.More precisely, we made sure to filter out substitutes that were not in the samefood category as the query food. The results in Table 1b show that all metricshave improved significantly with this filtering strategy.6DiscussionOverall, Table 1a and Table 1b show encouraging results from our objective tobuild a recommender system for substituting food products. Table 1b shows animprovement over the results shown in Table 1a by including food category information in the ranking calculation. It is logical to consider category informationin ranking substitutes as most of the foods in the same category have similar nutritional profiles. However, the ranking might not be practical for somespecialized diets. For example, the ranking may fail to recommend meat substitutions for specialized diets such as vegan or vegetarian diets, because theirdiet will not permit the recommendations from the meat category. On the otherhand, it should be noted that the similarities between foods are mainly basedon nutritional values.This study describes the development of a food recommender system thatidentifies healthier alternatives to target foods. These healthier alternatives are
Automated Identification of Food Substitutions9food products that have a more favourable nutritional profile within their product category, based on key macro- and micronutrients. However, when searchingfor food substitutes, people often focus on other factors such as taste, functionality, accessibility, or dietary restrictions [6]. For example, some people may wishto replace potatoes to reduce carbohydrate intake, or replace peanuts because ofallergens. This is not yet included in the ground truth. These mentioned factors,that are known to affect food product selection and dietary choices, are a gooddirection for future work.7ConclusionIn this work, an unsupervised method using the knowledge graph embeddingbased similarity for food substitution is presented. The quality of knowledgegraph embeddings for this task was assessed against a newly created groundtruth which was verified by two domain experts. Even though the ground truthcan be further optimised and the recommender system can be further developedby also including other variables to compare food products with each other, thisground truth is one of the first steps in making it easier to let people identifyalternative food products. We believe that KGE based recommender can be improved further with existing supervised methods such as Graph Neural Networksince a training dataset (ground truth) is now made available. As a future work,we would like to extend the recommender system by using an actual nutrientprofiling system that is currently being used in specific countries to identify foodsas being healthy or not. We also plan to use and compare the state-of-the-artsupervised methods to train on ground truth data created.References1. Jill Jin. Dietary Guidelines for Americans. JAMA, 315(5):528–528, 02 2016.2. Maintaining a healthy diet during the COVID-19 pandemic. FAO, 2020.3. Michael J. Butler and Ruth M. Barrientos. The impact of nutrition on covid19 susceptibility and long-term consequences. Brain, Behavior, and Immunity,87:53–54, 2020.4. Alie de Boer. Fifteen years of regulating nutrition and health claims in europe:The past, the present and the future. Nutrients, 13(5), 2021.5. A.C. Hoek, D. Pearson, S.W. James, M.A. Lawrence, and S. Friel. Healthy andenvironmentally sustainable food choices: Consumer responses to point-of-purchaseactions. Food Quality and Preference, 58:94–106, 2017.6. Christoph Trattner and David Elsweiler. Food recommender systems: Importantcontributions, challenges and future research directions. 11 2017.7. Dahyun Park, Yoo Kyoung Park, Clara Yongjoo Park, Mi-Kyung Choi, and MinJeong Shin. Development of a comprehensive food literacy measurement tool integrating the food system and sustainability. Nutrients, 12(11), 2020.8. Maartje Poelman, S. Dijkstra, Hanne Sponselee, Carlijn Kamphuis, MariekeBattjes-Fries, Marleen Gillebaart, and Jaap Seidell. Towards the measurementof food literacy with respect to healthy eating: The development and validation ofthe self perceived food literacy scale among an adult sample in the netherlands.International Journal of Behavioral Nutrition and Physical Activity, 15, 06 2018.
10Loesch et al.9. Sola S. Shirai, Oshani Seneviratne, Minor E. Gordon, Ching-Hua Chen, and Deborah L. McGuinness. Identifying ingredient substitutions using a knowledge graphof food. Frontiers in Artificial Intelligence, 3:111, 2021.10. E. Griffiths, Damion M. Dooley, P. L. Buttigieg, R. Hoehndorf, F. Brinkman, andW. Hsiao. Foodon: A global farm-to-fork food ontology. In ICBO/BioCreative,2016.11. Steven Haussmann, O. Seneviratne, Yu Chen, Yarden Ne’eman, James Codella,Ching-Hua Chen, D. McGuinness, and Mohammed J. Zaki. Foodkg: A semanticsdriven knowledge graph for food recommendation. In SEMWEB, 2019.12. Antoine Bordes, Nicolas Usunier, Alberto Garcia-Durán, Jason Weston, and Oksana Yakhnenko. Translating embeddings for modeling multi-relational data. InProceedings of the 26th International Conference on Neural Information ProcessingSystems - Volume 2, page 2787–2795, Red Hook, NY, USA, 2013. Curran Associates Inc.13. Théo Trouillon, Johannes Welbl, Sebastian Riedel, Éric Gaussier, and GuillaumeBouchard. Complex embeddings for simple link prediction, 2016.14. Tome Eftimov, Gorjan Popovski, Eva Valenčič, and Barbara Koroušić Seljak.Foodex2vec: New foods’ representation for advanced food data analysis. Food andchemical toxicology : an international journal published for the British IndustrialBiological Research Association, 138:111169, April 2020.15. European Food Safety Authority (EFSA). The food classification and descriptionsystem foodex 2 (revision 2). EFSA Supporting Publications, 12(5):804E, 2015.16. Maximillian Nickel and Douwe Kiela. Poincaré embeddings for learning hierarchical representations. In I. Guyon, U. V. Luxburg, S. Bengio, H. Wallach, R. Fergus,S. Vishwanathan, and R. Garnett, editors, Advances in Neural Information Processing Systems, volume 30. Curran Associates, Inc., 2017.17. Yuran Pan, Qiangwen Xu, and Yanjun Li. Food recipe alternation and generationwith natural language processing techniques. In 2020 IEEE 36th InternationalConference on Data Engineering Workshops (ICDEW), pages 94–97, 2020.18. Chantal Pellegrini., Ege Özsoy., Monika Wintergerst., and Georg Groh. Exploitingfood embeddings for ingredient substitution. In Proceedings of the 14th International Joint Conference on Biomedical Engineering Systems and Technologies HEALTHINF,, pages 67–77. INSTICC, SciTePress, 2021.19. Tomas Mikolov, Ilya Sutskever, Kai Chen, Greg Corrado, and Jeffrey Dean. Distributed representations of words and phrases and their compositionality. In Proceedings of the 26th International Conference on Neural Information ProcessingSystems - Volume 2, NIPS’13, page 3111–3119, Red Hook, NY, USA, 2013. Curran Associates Inc.20. Jacob Devlin, Ming-Wei Chang, Kenton Lee, and Kristina Toutanova. Bert: Pretraining of deep bidirectional transformers for language understanding, 2019.21. Wesley Tansey, Edward W. Lowe Jr. au2, and James G. Scott. Diet2vec: Multiscale analysis of massive dietary data, 2016.22. Quoc V. Le and Tomas Mikolov. Distributed representations of sentences anddocuments, 2014.23. Petar Ristoski and Heiko Paulheim. Rdf2vec: Rdf graph embeddings for datamining. In Paul Groth, editor, The Semantic Web - ISWC 2016 : 15th InternationalSemantic Web Conference, Kobe, Japan, October 17-21, 2016, Proceedings, PartI, volume 9981, pages 498–514, Cham, 2016. Springer International Publishing.
Automated Identi cation of Food Substitutions Using Knowledge Graph Embeddings Julie Loesch1, Louis Meeckers1, Ilse van Lier2;3[0000 0001 8381 1252], Alie de Boer2[0000 0002 6500 4649], Michel Dumontier4[0000 0003 4727 9435], and Remzi Celebi4[0000 0001 7769 4272] 1 Data Science and Knowledge Engineering, Maastricht University, Netherlands l