Transcription
Fusion of Photogrammetry and Video Analysis for ProductivityAssessment of Earthwork ProcessesM. Bügler1 , G. Ogunmakin2 , P. A. Vela2 , A. Borrmann1 , J. Teizer31Chair of Computational Modeling and Simulation, Technische Universität München,Arcisstraße 21, 80333 Munich, Germany2School of Electrical and Computer Engineering, Georgia Institute of Technology, United States of America3RAPIDS Construction Safety and Technology Laboratory, Ettlingen, GermanyAbstract: The high complexity of modern large scaleconstruction projects leads their schedules to be sensitiveto delays. At underground construction sites the earthwork processes are vital, as most of the following tasksdepend on them. This paper presents a method for estimating the productivity of soil removal by combining twotechnologies based on computer vision: photogrammetryand video analysis. Photogrammetry is applied to createa time series of point clouds throughout excavation, whichare used to measure the volume of the excavated soil fordaily estimates of productivity. Video analysis is usedto generate statistics regarding the construction activitiesfor estimating productivity at finer time scales, when combined with the output from the photogrammetry pipeline.As there may be multiple causes for specific productivitylevels, the automated generation of progress and activitystatistics from both measurement methods supports interpretation of the productivity estimates. Comparisonto annotated ground truth for the tracking and activitymonitoring method highlights the reliability of the extracted information. The suitability of the approach isdemonstrated by two case studies of real-world urban excavation projects.1stitute two distinct components of productivity measurement. Specifically, progress tracking measures quantitiesinstalled while resource utilization tracking measures consumed work hours as well as how such work hours werespent (Zhai & Goodrum, 2009). The key difference between the components lies in the definition of productivity. A resource can be fully utilized but not achieve anyprogress. An excavator can move soil within an excavationarea all day, but not be productive in terms of the volumeof soil removed from the excavation area within a certaintime. Current techniques for site operation analysis, asdescribed by Goodrum et al. (2009), focus on the monitoring of construction progress and the measurement ofwork task productivity, but are heavily based on manualefforts or at best partially automated. In real operationsthey are frequently out-of-date (Gong & Caldas, 2011).Many current research efforts associated to progressand productivity monitoring seek to prove the hypothesis that it is possible to reliably track multiple resourceswith images (video and/or time-lapse) in order to reproduce the daily workflow activities associated to a construction site. The intent behind such monitoring andanalysis is to automatically provide critical information,through computer-vision algorithms, on construction operations for improved decision making in construction engineering and management (Teizer et al., 2005).This paper focuses on a vision-based approach to theautomatic estimation of productivity associated to excavation processes on a construction site. Earthwork processes are often subject to unanticipated delays (Assaf &Al-Hejji, 2006), which are likely to propagate through theentire remaining schedule and adversely impact progress,productivity, and costs (Koehn et al., 1978). The presented work impacts research into excavation operationsby enabling the automated monitoring and tracking ofon-site resources. Video-based monitoring, photogrammetry and processing algorithms provide a non-intrusive,easy, inexpensive, and rapid mechanism for generating abody of operational information and knowledge on theprogress and productivity of excavation operations. Ifmade available to project stakeholders, the informationINTRODUCTIONConstruction sites involve significant quantities of resources, including multiple types of manpower, equipment, and materials. Proper coordination of these temporary entities positively impacts on-site productivity,which in turn influences construction safety, costs, andschedules (Goodrum et al., 2009; Zhai & Goodrum, 2009).In a related vein, awareness of labor productivity hasbeen shown to improve the direct work rate (Gouett &Haas, 2011). Thus, the existence of on-site productivity measurements is sufficient to improve on-site operations and mitigate any adverse conditions that may impede progress.Progress tracking and resource utilization tracking con1
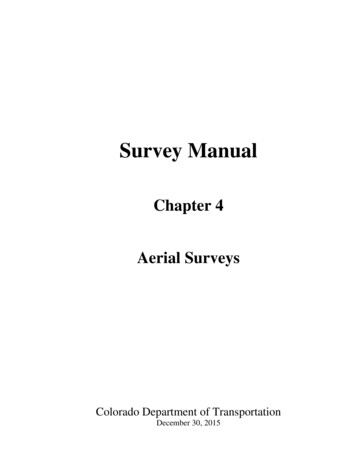
2Bügler et al.and knowledge would enable inquiry into construction operations that is currently not possible (Bohn & Teizer,2010). Longer term, vision-based research can serve as avaluable aid to project management by enabling tightercontrol and greater efficiency.Demonstrating that a visual measurement system caneffectively analyze and assess work-site productivity willassist project managers by reducing the time spent monitoring and interpreting project status and performance,thus enabling increased attention to the control of costand schedule. By making project management and workforce more aware of the performance status of theirproject and their work environment, potential savings tothe industry are envisioned. Since benefits in constructionoften impact a broader theme of issues, they are likelyto impact schedule, cost, safety, and quality at the sametime.Contribution. This paper introduces a novel methodology which combines two different sources of data (photogrammetry and video analysis) to gain insight into theproductivity of earthwork operations. Here, earthworkoperations refers to the coordination between excavatorsand dump trucks for soil removal. The proposed workflow, illustrated in Figure 1, retrieves the excavated volume from point clouds created through photogrammetryalgorithms, generates activity statistics of interacting excavators and dump trucks from automatically processedsurveillance video, then fuses the information to arriveat soil removal productivity estimates over the course ofa day (e.g., at hourly intervals). Statistical analysis ofthe excavated volume progress and the machine activitystates provide supporting information for understandingthe factors influencing the estimated productivity levels.By reacting upon this knowledge, a more optimal allocation of resources can be found, saving time and costs forproject stakeholders.2RELATED WORKWhile current research into construction site monitoringhas considered non-vision technological solutions such asRadio Frequency Identification (RFID) and Ultra Wideband technology (Cheng et al., 2013; Costin et al., 2012;Grau et al., 2009; Saidi et al., 2011), and Global Positioning Systems (Grau et al., 2009; Pradhananga & Teizer,2013; Vahdatikhaki & Hammad, 2014; Vasenev et al.,2014), the current focus of the related work is on visionbased solutions. Further, the emphasis is on passive imaging as opposed to active imaging such as that provided bylaser scanners (Bosché, 2010). Although laser-scanningmethods are known to have better accuracy and measurement density, passive imaging solutions have beenshown to provide complementary capabilities that makethem suitable to certain monitoring tasks (GolparvarFard et al., 2011; Malinovskiy et al., 2009). The reviewwill first cover vision-based progress monitoring via 3Dreconstruction of the construction site, and then covervision-based activity estimation for on-site resources.2.1Image-Based Progress Monitoring.The use of imagery to estimate construction progressand connect it to building information models (BIM) hasbeen demonstrated to work using fixed cameras mountedaround the construction site (Karsch et al., 2014; Lukinset al., 2007). Due to the geometric complexity and potential occlusions on larger work-sites, hand-held imaging devices are often preferable (Marzouk & Zaher, 2015). Successful methods use hand-held devices and photogrammetry (Braun et al., 2015; Dimitrov & Golparvar-Fard,2014; Golparvar-Fard et al., 2011; Walsh et al., 2013),with some methods specialized to particular elements ofthe built infrastructure such as façades and roofs (Aydin,2014; Fathi & Brilakis, 2013). Photogrammetry uses photos typically taken by a pedestrian worker equipped with aconventional digital camera as input data and generates,through computational algorithms, a three-dimensionalpoint cloud of the imaged site. Contemporary researchhas also focused on unmanned platforms for performingthe data collection (Mills et al., 2010; Siebert & Teizer,2014; Zhang & Elaksher, 2012). The focus of this paper ison excavation processes and volumetric analysis. Preliminary work presented by Bügler et al. (2013) estimated thecurrent progress of an excavation process by determiningthe excavated volume through the Visual Structure fromMotion (VisualSFM) algorithm (Wu, 2011).2.2Vision-Based Resource TrackingUsing passive imaging cameras aimed at a worksite forperforming resource tracking and activity monitoring relies on applying methods and tools from surveillance research (Collins et al., 2000). As will be detailed further inSection 4, video surveillance systems require the connection of several modules, which perform object detection,identification, tracking, and reidentification (needed whenan object leaves and returns the scene). Once these basiccomponents are functional, an additional interpretationmodule may be added in order to identify behaviors or activities engaged by the tracked objects within the sensedscene (Haritaoglu et al., 2000). These may be furtherdecomposed into typical or unusual (Javed et al., 2003).Further analysis of the behaviors and activities over timemay be performed in order to identify key events, whichcan then be entered into a database or spreadsheet forreporting or query purposes. For example, the system byTian et al. (2008) performs event-based retrieval, providesreal-time event alerts through the internet, and extractslong term statistical patterns of activity in a more generalsetting.Detection. Resource detection on construction sitevideos is broadly categorizable into two approaches: object detection algorithms and general foreground esti-
umeVideoanalysisActivitystatisticsVideoSite layout3Analysis & controlConstruction SiteVision-Based Productivity Assessment of Excavation ProcessesFigure 1: Data flow diagram of proposed conceptmation algorithms. Detection algorithms, usually relying on machine learning techniques, involve training tolearn the unique signature of a given object. Algorithmsinclude neural networks (Rezazadeh Azar & McCabe,2012a), support vector machines with specific featuremodels (Memarzadeh et al., 2012), random forests (Parket al., 2011a), and parts-based models (Rezazadeh Azar &McCabe, 2012b). Parts-based modeling approaches workbest for articulated objects since their appearance geometry has high variation, which can be compensated throughmultiple, individual part detectors. Since detection-basedmethods often seek specific targets, the resource type willtypically be known from the detection itself. Foregroundestimation algorithms tend to be simpler; they generatea model of the expected scene and classify continuous regions that do not match the model to be target regions(Chi & Caldas, 2011; Gong & Caldas, 2009). Foregroundestimation works well when the entrance into the scene ofthe object is controlled, or the object of interest is not occluded by other foreground objects (Yang et al., 2011). Inless controlled settings, stronger results are obtained bycombining the two techniques (Chi & Caldas, 2011; Gong& Caldas, 2011; Rezazadeh Azar & McCabe, 2012a). Thevalue is due to the fact that foreground detection methods do not classify the detected objects. Therefore, theaddition of object recognition or object detection algorithms to classify the foreground regions has the addedbenefit of both rejecting irrelevant foreground detectionsand recognizing the resource category.Tracking. When seeking to estimate target trajectories from target detections, additional processing is required to keep track of the detected objects over time.Situations such as short term occlusion, trajectory crossings, and object overlap, all lead to target label ambiguityand require data association methods to properly link detections across frames. A common approach is to utilizespatio-temporal reasoning to generate the proper associations (Chi & Caldas, 2011). An alternative approach isto incorporate a target tracking algorithm, which utilizesthe detection region to generate a specific signature modelfor the target, then search for the signature in futureframes independently from the detection results. Therehave been comparative papers studying the performanceof specific tracking algorithms on construction worksites(Park et al., 2011b; Teizer & Vela, 2009) with probabilistic and kernel-based methods showing strong performance. Kernel-based methods have been used since fortracking on-site resources (Park & Brilakis, 2012). Yanget al. (2010) used a probabilistic kernel method to trackmultiple workers with overlapping trajectories, showingthat these methods can be modified to handle occlusions.Ogunmakin et al. (2013) extended these results to rigidconstruction machines observed from a distance. Whilemost tracking papers are on tracking with a single cameraview, Brilakis et al. (2011) demonstrated 3D tracking ofconstruction site resources using stereo video.Activity Analysis. For a detected and tracked construction resource, further analysis of the object’s visualstream provides important information regarding the roleand contribution of the resource to the construction process. Deciphering this information falls within the category of activity analysis. Activity analysis on a construction site involves determining the action each target inthe scene is engaged in over a period of time. Early activity analysis utilized sensors installed on the resource ofinterest, with demonstrated proof of concept (Ake, 2001).Since then, research has explored the feasibility of visionbased strategies by translating advances in computer vision to the construction field. The vision-based researchliterature, not just in construction but in general, canbe split into activity identification through analysis ofspecific spatio-temporal visual features of the resource orthrough analysis of the trajectory and proximity information.The former category has mostly focused on articulatedresources, such as personnel and machines (Peddi et al.,2009; Weerasinghe & Ruwanpura, 2010). By decoding thearticulation poses or target feature elements over time,the activity category can be inferred (Khosrowpour et al.,2014; Yang et al., 2015). Work activities may be brokeninto effective work, ineffective work, or contributory workfor productivity analysis (Peddi et al., 2009).In some cases, knowledge of trajectory and proximityinformation is sufficient to infer the activity state. Theaddition of a-priori information about the targets andtheir work packages, the location of regions of interest
4Bügler et al.plus their meaning, and the trajectories of each targetenables the decoding of activities through Markov modelsbased on work process diagrams (Gong & Caldas, 2009;Yang et al., 2011). Site analysis is possible for earthworkprocesses since the quantity and types of equipment arelimited during this part of the construction phase, and theactivities can be inferred from the interaction dynamicsof the machines (Ogunmakin et al., 2013).Productivity Estimation. Analysis of activity stateestimates over time, when connected to specific workpackages, provides productivity data for the work packages (Gong & Caldas, 2011). Over short time intervals,with specific work packages, productivity can be inferredthrough the activity states coupled with some minimalinformation regarding the task (Navon, 2005). For longertime intervals, however, it is more useful to connect activity statistics to actual progress, which requires progresstracking. To date, we are unaware of any vision-based solutions that provide productivity estimation of construction site operations through the measurement of progressand activity states over time.3VOLUME CALCULATION USINGPHOTOGRAMMETRYThe proposed approach to quantify the amount of excavated soil on an excavation site is to create a 3D pointcloud of the site space via photogrammetry. The photogrammetry algorithm used is VisualSFM (Wu, 2011).The algorithm locates feature points within the recordedphotos using the scale invariant feature transform SIFT(Lowe, 1999). Those features are then matched amongthe individual photographs. Features visible in at leastthree photographs are then used to triangulate points inthree dimensional space (see Figure 6a). Those pointseventually form a point cloud. Additionally the patchbased multi view stereo (PMVS) algorithm (Furukawa &Ponce, 2010) can be used to create a denser representation of the scene and to add information about the localsurface normals throughout the point cloud.Once the point cloud is generated, volume calculation of the point cloud required several additional steps.First, the points outside of the excavation area are clearedfrom the point cloud through conditional Euclidean cluster analysis (Lefkovitch, 1980). Second, a consistent topplane, which covers the excavation area, is found by performing a vertical histogram analysis, showing a suddendrop in the number of points along the vertical axis, whichis consistent over the time series of point clouds in the casestudies.For sites with very close surrounding trees or buildings the histogram might not be sufficiently accurate, inwhich case markers are placed on site. Those markers actto precisely demarcate a reference plane, most commonlythe ground level of the soil prior to excavation, for volume calculation. To resolve the scale ambiguity of thesite arising from photogrammetry, the scale of the site iscalculated from known distances between marker points,or known distances between points in the scene. Eitherthe known features, such as bored pile walls, or the markers have been located within the point clouds in order todetermine the scale. All points above the top cover planeare removed and gaps remaining in the point set are filledusing linear interpolation. The volume of the excavationpit is calculated using signed tetrahedron volumes of amesh generated from the top plane and the point cloud.More details on the entire procedure are given by Bügleret al. (2013). The documented point clouds in this paperwere each calculated on the basis of several hundred photos, per session, processed offline to create a point cloudof high density, containing more than a million points.4VIDEO ANALYSISFollowing the approach by Ogunmakin et al. (2013), thispaper presents an automatic surveillance system for processing videos of excavation operations that requires apriori information about the construction work site layout and any activities of interest. The problem setupinvolves a single monocular camera configured to view ascene where activities of interest could occur. The cameraview is assumed to provide an angled sideways view froma high enough vantage point that the region of interestfits within the field of view. The targets of interest aredump trucks and excavators. After processing the video,the system provides an automated report of the activitystates of the targets (moving, static, or excavating) andthe statistics associated with the activities of interest.Figure 2 depicts the main steps of the online algorithmicprocessing, which includes the following elements:1. Background modeling: Background estimation to initialize the background subtraction model and to identify potential targets via foreground detection.2. Target detection: Foreground objects analysis to detect new targets and learn their respective appearance models for re-identification.3. Tracking: Check whether a tracker has been lost,check the entrances for new targets, and, if a targetis detected, re-identify previously seen targets.4. Activity status estimation: Activity status estimation for each tracked target based on regions of interest.The system processes video at real-time, given a framerate of 10 frames per second. Once the whole video sequence is tracked, the results are passed to an event detection processor that outputs the average time spent inthe region of interest, the number of targets that enteredthe region of interest, the number of targets that enteredthe scene, how long they spent in each region of interest,and each target’s deviation from the average time spentin the region of interest. The post-processing event detection step completes in less than 10 minutes of time for
Vision-Based Productivity Assessment of Excavation ProcessesVideo inputSite layout5Video ctivity statusestimationEvent detectionprocessorFigure 2: Process flow for the automatic surveillance system.a full workday. The subsections that follow describe thedifferent modules included in the system and their implementation details.4.1Foreground-Based Target DetectionTarget detection is performed using the background Gaussian Mixture Model (GMM) method proposed by Stauffer& Grimson (1999), which determines foreground based onthe probability of a pixel belonging to the background.The GMM is initialized using the background estimationtechnique of Reddy et al. (2009). Figure 3 illustrates different background models created for one of the case studies. The blurred or pixelized areas in the image were interpolated image regions, in order to remove machines fromthe scene.Regions with low probabilities, as determined by athreshold, define the foreground regions. Coupling theseforeground detections with the worksite layout information (e.g., entrance gates or zones), establishes when atarget first enters the scene. For a given frame, the foreground regions need to be classified as excavator, dumptruck, or neither. To differentiate between the two machines, the size, and aspect ratio of the detected entity isused to decide whether it is a dump truck or an excavator. The area of the region is used to determine whetherit should be classified as one of these machines or as aspurious detection.4.2spatial information, into a higher dimensional space using the Gaussian kernel and performing kernel principalcomponent analysis. For every frame and each target, agradient ascent procedure localizes the target by comparing the foreground image data with the targets’ learntmodel in order to optimize the region similarity.4.3Activity Status EstimationThe activity status of the machines follows that of Bügleret al. (2014), where machine activity is decomposed intostatic, moving, absent, and filling. An activity check isperformed when an excavator and a dump truck are inclose proximity. This is the case when the closest distance between the outlines of the machines is low relativeto the sizes of the machines. In the presented case studies, a threshold equal to the expected length of one dumptruck proved effective. Then, the movement of the excavator in the proximity zone of a dump truck establisheswhen an excavator might be filling a dump truck. Thisstate can only be triggered when the two machines are inclose proximity and the dump truck is static. Comparedto Golparvar-Fard et al. (2013), where the machine activity is determined using machine learning with spatiotemporal features, the presented system utilizes opticalflow to detect the dump-truck filling activities. It relieson the angled sideways camera view (as opposed to a topdown view).Kernel Covariance TrackingAn improvement on the kernel covariance tracker used inOgunmakin et al. (2013) is utilized for tracking detectedtargets. Two improvements were made: (1) reduction ofdata before tracking (Kingravi et al., 2013), and (2) introduction of a scale space search with upper limits andlower limits. The data reduction step saves memory andlowers the computational cost of tracking. The scale spacesearch allows the tracker to handle changes in scale. Toinitialize a tracker, the target’s tracker model is learntby mapping its feature vector, consisting of its color and4.4Event Detection ProcessorThe event detection processor takes as input the trajectory information from the tracker and the results fromthe activity status estimation, and uses this to generatethe statistics needed to determine the time spans of thework activities of the excavators and dump trucks. Themetrics computed are the number of dump trucks thatentered the scene (ntrucks ), how much time they spent inthe scene (tscene ), how much time they spent in the regionof interest getting filled (troi ), how many bucket loads of
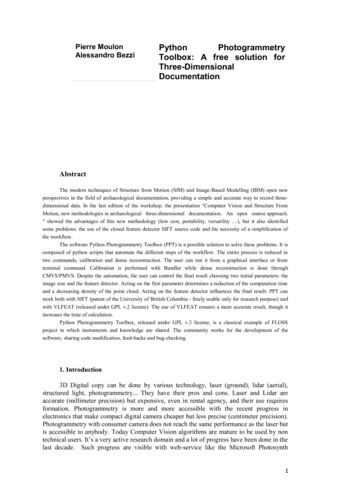
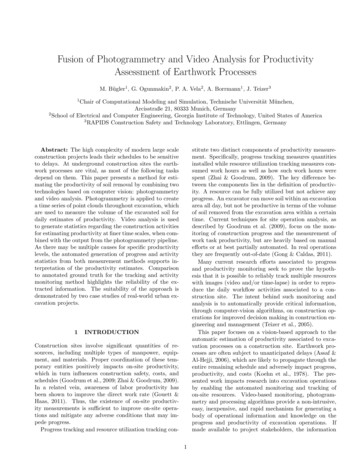
6Bügler et al.Figure 3: Estimated background models (pixellated regions are interpolation artifacts from deleted machines).soil were placed in each dump truck (nbuckets ), and howlong the machines spent idle while in the scene (tidle ).The number of dump trucks that entered the scene,ntrucks , is computed by counting the number of trackers initialized for detected dump trucks. Their durationin the scene, tscene , is obtained by subtracting the timestamp they left the scene from the time stamp they entered the scene. The time spent being loaded by the excavator, troi , is determined using the results from the activity estimation. It sums up the total amount of time theactivity estimation detected that the dump truck was being loaded. The number of bucket loads, nbuckets , is alsodetermined by the activity estimation module by countinghow many times it detected the excavator bucket over thedump truck using optical flow (optical flow measures theapparent motion of pixels from one frame to the next).The time the machines spent idle in the scene, tidle , is determined by checking how much movement has happenedbetween frames. Movement below a threshold triggers theidle state.The event processor tabulates the temporal statisticsof the activities and also identifies events, such as fillingcycles and outlier time spans. A sample activity timelineand summary pie chart is given in Figure 4 for a 6 minutesegment of processed video.5PERFORMANCE ANALYSISThe performance of machines, operators, workers, andprocesses is commonly described by performance factors,such as soil removed per hour/day, the quantity of dumptruck loads per hour, or the time required by a truck totransport soil to a dump site. The data acquired by cameras, as described in the previous sections, may indicateinstances where those factors deviate from established values. In those cases it is important to determine the reasons for the failure and update the respective performancefactors.In the context of this research the performance is defined as the amount of soil removed from the site pertime. Given two volume measurements provided by thephotogrammetry approach, this is calculated as defined inEquation (1), where t1 and t2 are the points in time andare vt1 and vt2 are the respective volumes of the excavatedpit, vvt vt1 2τp (1) tt2 t1This performance factor is calculated on a daily basis, butit does not provide deeper estimates during the course ofthe day, nor insight into the causes for the observed performance factors. Thus, video analysis is used to calculatethe performance factor on a hourly (or finer) basis basedon the number of excavation buckets nbuckets counted.The volume of a bucket is assumed known for a givenexcavator. The automatically tabulated statistics associated to daily activity levels and provided via charts assistwith the interpretation of the measured productivity levels.Due to the swell factor of soil, which expands duringexcavation, and due to the varying filling level of thebucket, activity analysis only provides a rough estimateand the resulting performance factor τv can be assumedto be larger than τp . Furthermore, the volume error willaccumulate on the long run and reduce the reliability ofthe volume estimates. As the swell factor and the fillinglevel of the bucket can be assumed to have a low variance within a day or so, the statistical data of the videoanalysis is normalized by the daily volume measurement,which provides an absolute measure of the excavated soil.Normalization is achieved by assuming that both measurements should yield an equal performance factor. Imposing equality involves scaling τv to the same value as τpby correcting the bucket volume to the mean volume required to equalize the performance factors. The correctedbucket volume is calculated by dividing the excavated volume calculated via photogrammetry by the number ofbucket loads counted via video analysis. Taking this corrected bucket volume into account, the statistics resultingfrom the video analysis can be accurately scaled to yieldhourly performance factors for the excavation process thatdo not suffer from a cumulative error.By combining the absolute volumetric measurementsof photogrammetry with the fine temporal resolution ofvideo analysis, the presented approach automatically pro-
Vision-Based Productivity Assessment of Excavation Processes01234576AbsentStaticMovingFillingFigure 4: Dump truck state estimates for a video segment of 6 minutes duration, plus activity states in a pie chart.vides accurate earth excavation performance factors forarbitrary time intervals. In addition, the developed videoanalysis techniques allow for a detailed analysis of thecauses for performance fluctuations. As the event detector allows for measuring time intervals, a detailed analysis of the interaction between excavator and dump trucksbecomes possible: If the created statistic shows that thedump trucks are absent over long periods of time, thereason for a low productivity is an insu
performing resource tracking and activity monitoring re-lies on applying methods and tools from surveillance re-search (Collins et al., 2000). As will be detailed further in Section 4, video surveillance systems require the connec-tion of several modules, which perform object detection, identi cation, tracking, and reidenti cation (needed when