Transcription
Total Maximum Daily Load (TMDL) forPhosphorus in Port BayWayne County, New YorkApril 2011Prepared for:U.S. Environmental Protection AgencyRegion 2290 BroadwayNew York, NY 10007New York State Department ofEnvironmental Conservation625 Broadway, 4th FloorAlbany, NY 12233Prepared by:
TABLE OF CONTENTS1.0INTRODUCTION . 31.1.Background . 31.2.Problem Statement . 32.0WATERSHED AND LAKE CHARACTERIZATION . 42.1.Watershed Characterization . 42.2.Lake Morphometry . 72.3.Water Quality . 83.0NUMERIC WATER QUALITY TARGET . 94.0SOURCE ASSESSMENT . 94.1.Analysis of Phosphorus Contributions . 94.2.Sources of Phosphorus Loading . 105.0DETERMINATION OF LOAD CAPACITY . 145.1.Lake Modeling Using the BATHTUB Model . 145.2.Linking Total Phosphorus Loading to the Numeric Water Quality Target . 146.0POLLUTANT LOAD ALLOCATIONS. 166.1.Wasteload Allocation (WLA). 166.2.Load Allocation (LA) . 166.3.Margin of Safety (MOS) . 196.4.Critical Conditions . 196.5.Seasonal Variations . 197.0IMPLEMENTATION. 197.1.Reasonable Assurance for Implementation. 207.2Follow-up Monitoring . 238.0PUBLIC PARTICIPATION . 23APPENDIX A. MAPSHED MODELING ANALYSIS . 32APPENDIX B. BATHTUB MODELING ANALYSIS . 46APPENDIX C. TOTAL EQUIVALENT DAILY PHOSPHORUS LOADALLOCATIONS . 51APPENDIX D. ESTIMATED DISCHARGE DATA FOR WASTEWATERTREATMENT PLANTS . 522
1.0INTRODUCTION1.1.BackgroundIn April of 1991, the United States Environmental Protection Agency (EPA) Office of Water’sAssessment and Protection Division published “Guidance for Water Quality-based Decisions: TheTotal Maximum Daily Load (TMDL) Process” (USEPA 1991b). In July 1992, EPA published thefinal “Water Quality Planning and Management Regulation” (40 CFR Part 130). Together, thesedocuments describe the roles and responsibilities of EPA and the states in meeting the requirementsof Section 303(d) of the Federal Clean Water Act (CWA) as amended by the Water Quality Act of1987, Public Law 100-4. Section 303(d) of the CWA requires each state to identify those waterswithin its boundaries not meeting water quality standards for any given pollutant applicable to thewater’s designated uses.Further, Section 303(d) requires EPA and states to develop TMDLs for all pollutants violating orcausing violation of applicable water quality standards for each impaired waterbody. A TMDLdetermines the maximum amount of pollutant that a waterbody is capable of assimilating whilecontinuing to meet the existing water quality standards. Such loads are established for all the pointand nonpoint sources of pollution that cause the impairment at levels necessary to meet theapplicable standards with consideration given to seasonal variations and margin of safety. TMDLsprovide the framework that allows states to establish and implement pollution control andmanagement plans with the ultimate goal indicated in Section 101(a)(2) of the CWA: “water qualitywhich provides for the protection and propagation of fish, shellfish, and wildlife, and recreation inand on the water, wherever attainable” (USEPA, 1991a).1.2.Problem StatementPort Bay (WI/PWL ID 0302-0012) is situated in the Town of Wolcott and Town of Huron, withinWayne County, New York. Over the past couple of decades, the bay has experienced degradedwater quality that has reduced the bay’s recreational and aesthetic value. Recreational suitability hasbecome less favorable due to “excessive weed growth” in the bay. The “excessive weed growth” isthought to be caused by high levels of nutrients entering the bay from the surrounding watershed,lake-shore septic systems, and a municipal wastewater treatment plant (Wayne County, 2007). PortBay is presently among the lakes listed on the Lake Ontario Basin PWL (NYS DEC, 2008).A variety of sources of phosphorus are contributing to the poor water quality in Port Bay. The waterquality of the bay is influenced by runoff events from the drainage basin, point source discharges,and loading from nearby residential septic systems. In response to precipitation, nutrients, such asphosphorus – naturally found in New York soils – drain into the bay from the surrounding drainagebasin by way of streams, overland flow, and subsurface flow. Nutrients are then deposited andstored in the bay bottom sediments. Phosphorus is often the limiting nutrient in temperate lakes andponds and can be thought of as a fertilizer; a primary food for plants, including algae. When lakesreceive excess phosphorus, it “fertilizes” the lake by feeding the algae. Too much phosphorus canresult in algae blooms, which can damage the ecology/aesthetics of a lake, as well as the economicwell-being of the surrounding drainage basin community.3
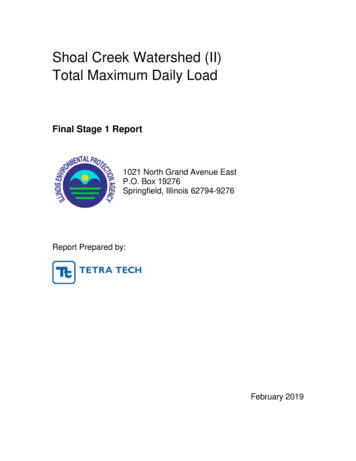
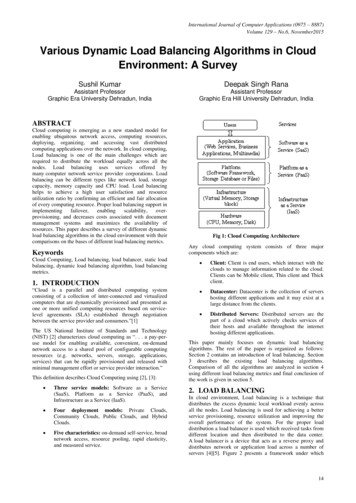
The results from state sampling efforts confirm eutrophic conditions in Port Bay, with theconcentration of phosphorus in the bay exceeding the state’s current guidance value for phosphorus(20 µg/L or 0.020 mg/L, applied as the mean summer, epilimnetic total phosphorus concentration),which increases the potential for nuisance summertime algae blooms. In 2002, Port Bay was addedto the New York State Department of Environmental Conservation (NYS DEC) CWA Section303(d) list of impaired waterbodies that do not meet water quality standards due to phosphorusimpairments and was ranked as a high priority for TMDL development (NYS DEC, 2008). Based onthis listing, a TMDL for phosphorus is being developed for the bay to address the impairment.2.0WATERSHED AND LAKE CHARACTERIZATION2.1.Watershed CharacterizationPort Bay has a direct drainage basin area of 21,068 acres excluding the surface area of the bay(Figure 1). Elevations in the bay’s basin range from approximately 604 feet above mean sea level(AMSL) to as low as 246 feet AMSL at the surface of Port Bay.Existing land use and land cover in the Port Bay drainage basin was determined from digital aerialphotography and geographic information system (GIS) datasets. Digital land use/land cover datawere obtained from the 2001 National Land Cover Dataset (NLCD, Homer, 2004). The NLCD is aconsistent representation of land cover for the conterminous United States generated from classified30-meter resolution Landsat thematic mapper satellite imagery data. High-resolution colororthophotos were used to manually update and refine land use categories for portions of thedrainage basin to reflect current conditions in the drainage basin (Figure 2). Appendix A providesadditional detail about the refinement of land use for the drainage basin. Land use categories(including individual category acres and percent of total) in Port Bay’s drainage basin are listed inTable 1 and presented in Figures 3 and 4.4
Figure 1. Port Bay Direct Drainage BasinFigure 2. Aerial Image of Port Bay5
Table 1. Land Use Acres and Percent inPort Bay Drainage BasinLand UseCategoryOpen WaterAgricultureHay & PastureCroplandDeveloped LandLow IntensityHigh 1,3331,2775610,0221,17821,068% of .6%5.6%100%Figure 3. Percent Land Use in Port BayDrainage BasinRow Crops17.7%DevelopedLand6.33%Hay igure 4. Land Use in Port Bay Drainage Basin6
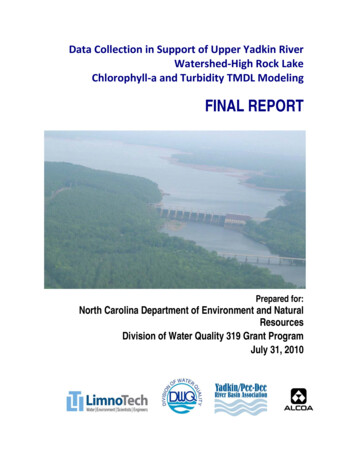
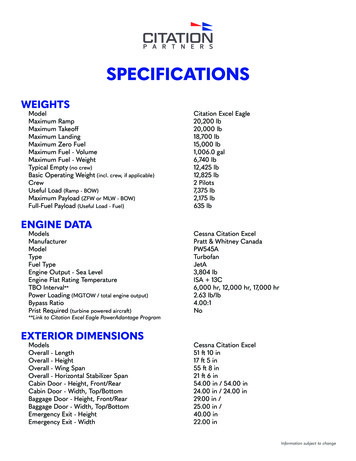
2.2.Lake MorphometryPort Bay is a 461 acre waterbody at an elevation of about 246 feet AMSL. Figure 5 shows abathymetric map developed by The Cadmus Group, Inc. for Port Bay based on data collected by theUpstate Freshwater Institute during the summer of 2007. Table 2 summarizes key morphometriccharacteristics for Port Bay.Figure 5. Bathymetric Map of Port BayTable 2. Port Bay CharacteristicsSurface Area (acres)Elevation (ft AMSL)Maximum Depth (ft)Mean Depth (ft)Length (ft)Width at widest point (ft)Shoreline perimeter (ft)Direct Drainage Area (acres)Watershed: Lake RatioMass Residence Time (years)Hydraulic Residence Time (years)46124627138,0142,99941,44821,06846:10.20.27
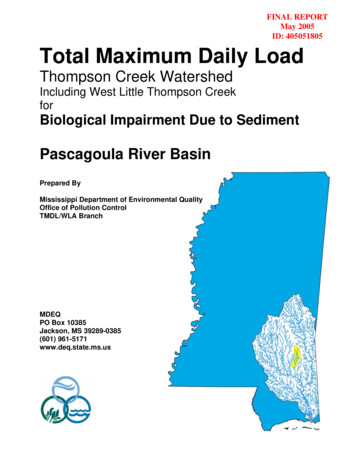
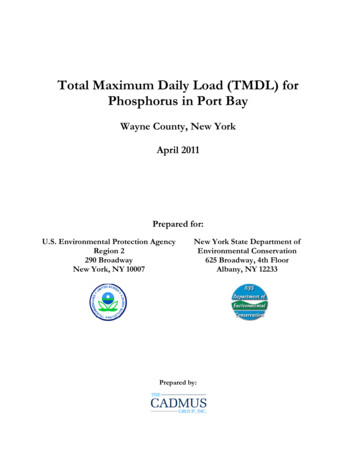
2.3.Water QualityNYS DEC’s Citizens Statewide Lake Assessment Program (CSLAP) is a cooperative volunteermonitoring effort between NYS DEC and the New York Federation of Lake Associations (FOLA).The goal of the program is to establish a volunteer lake monitoring program that provides data for avariety of purposes, including establishment of a long-term database for NYS lakes, identification ofwater quality problems on individual lakes, geographic and ecological groupings of lakes, andeducation for data collectors and users. The data collected in CSLAP are fully integrated into thestate database for lakes, have been used to assist in local lake management and evaluation of trophicstatus, spread of invasive species, and other problems seen in the state’s lakes.Volunteers undergo on-site initial training and follow-up quality assurance and quality controlsessions are conducted by NYS DEC and trained NYS FOLA staff. After training, equipment,supplies, and preserved bottles are provided to the volunteers by NYS DEC for bi-weekly samplingfor a 15 week period between May and October. Water samples are analyzed for standard lake waterquality indicators, with a focus on evaluating eutrophication status-total phosphorus, nitrogen(nitrate, ammonia, and total), chlorophyll a, pH, conductivity, color, and calcium. Fieldmeasurements include water depth, water temperature, and Secchi disk transparency. Volunteers alsoevaluate use impairments through the use of field observation forms, utilizing a methodologydeveloped in Minnesota and Vermont. Aquatic vegetation samples, deepwater samples, andoccasional tributary samples are also collected by sampling volunteers at some lakes. Data are sentfrom the laboratory to NYS DEC and annual interpretive summary reports are developed andprovided to the participating lake associations and other interested parties.As part of CSLAP, a limited number of water quality samples were collected in Port Bay during thesummers of 1990-1991. SUNY Brockport collected water samples in Port Bay during the summersof 2003-2006 and NYS DEC collected additional samples in the summer of 2009. The results fromthese sampling efforts show eutrophic conditions in Port Bay, with the concentration of phosphorusin the bay exceeding the state guidance value for phosphorus (20 µg/L or 0.020 mg/L, applied asthe mean summer, epilimnetic total phosphorus concentration), which increases the potential fornuisance summertime algae blooms. Figure 6 shows the summer mean epilimnetic phosphorusconcentrations for phosphorus data collected during all sampling seasons and years in which PortBay was sampled; the number annotations on the bars indicate the number of data points includedin each summer mean.8
Figure 6. Summer Mean Epilimnetic Total Phosphorus Levels in Port 901991604020020032004200520062009Phosphorus Water Quality Target (20 ug/L)3.0NUMERIC WATER QUALITY TARGETThe TMDL target is a numeric endpoint specified to represent the level of acceptable water qualitythat is to be achieved by implementing the TMDL. The water quality classification for Port Bay is B,which means that the best usages of the lake are primary and secondary contact recreation andfishing. The lake must also be suitable for fish propagation and survival. New York State has anarrative standard for nutrients: “none in amounts that will result in growths of algae, weeds andslimes that will impair the waters for their best usages” (6 NYSCRR Part 703.2). As part of itsTechnical and Operational Guidance Series (TOGS 1.1.1 and accompanying fact sheet, NYS, 1993),NYS DEC has suggested that for waters classified as ponded (i.e., lakes, reservoirs and ponds,excluding Lakes Erie, Ontario, and Champlain), the epilimnetic summer mean total phosphoruslevel shall not exceed 20 µg/L (or 0.02 mg/L), based on biweekly sampling, conducted from June 1to September 30. This guidance value of 20 µg/L is the TMDL target for Port Bay.4.0SOURCE ASSESSMENT4.1.Analysis of Phosphorus ContributionsThe MapShed watershed model was used in combination with the BATHTUB lake response modelto develop the Port Bay TMDL. This approach consists of using MapShed to determine meanannual phosphorus loading to the bay, and BATHTUB to define the extent to which this load mustbe reduced to meet the water quality target. MapShed incorporates an enhanced version of the9
Generalized Watershed Loading Function (GWLF) model developed by Haith and Shoemaker(1987) and the RUNQUAL model also developed by Haith (1993). GWLF and RUNQUALsimulate runoff and stream flow by a water-balance method based on measurements of dailyprecipitation and average temperature. The complexity of the two models falls between that ofdetailed, process-based simulation models and simple export coefficient models that do notrepresent temporal variability. The GWLF and RUNQUAL models were determined to beappropriate for this TMDL analysis because they simulate the important processes of concern, butdo not have onerous data requirements for calibration. MapShed was developed to facilitate the useof the GWLF and RUNQUAL models via a MapWindow interface (Evans, 2009). Appendix Adiscusses the setup, calibration, and use of the MapShed model for lake TMDL assessments in NewYork.4.2.Sources of Phosphorus LoadingMapShed was used to estimate long-term (1990-2007) mean annual phosphorus (external) loading toPort Bay. Additionally, estimates for internal loading were calculated (see Section 4.2.7). Theestimated mean annual external load of 41,899 lbs/yr of total phosphorus that enters Port Baycomes from the sources listed in Table 3 and shown in Figure 7. Appendix A provides the detailedsimulation results from MapShed.Table 3. Estimated Sources of Phosphorus Loading to Port d LandStream BankSeptic SystemsGroundwaterVillage of Wolcott WWTP (NY0020303)Reckitt Benckiser, Inc. (NY0078531)Merrell Farms Inc. (NYA000120)Internal LoadingTOTALTotal Phosphorus 1,89910
Figure 7. Estimated Sources of Total Phosphorus Loading to Port BaySeptic Systems3.3%Hay/Pasture2.5%Internal eveloped Land0.7%Point Sources6.4%4.2.1. Wastewater Treatment PlantsThe following two wastewater treatment plants are located in the Port Bay drainage basin: 1)Wolcott Wastewater Treatment Facility (SPDES ID: NY0020303); and 2) Reckitt Benckiser, Inc.(SPDES ID: NY0078531). Estimated monthly total phosphorus concentrations and flows werecalculated by NYS DEC for these facilities; these estimates are provided in Appendix D. Thisinformation is used in MapShed to calculate phosphorus loading from the point sources. Estimatedtotal phosphorus loading from the point sources (combined) is 2,674 lbs/yr (6.4% of the totalexternal loading to Port Bay). Reckitt Benckiser, Inc. is no longer operating and the permit has beendiscontinued. Therefore, this facility will not be a future source of phosphorus.4.2.2. Residential On-Site Septic SystemsResidential on-site septic systems contribute an estimated 1,376 lbs/yr of phosphorus to Port Bay,which is about 3.3% of the total loading to the bay. Residential septic systems contribute dissolvedphosphorus to nearby waterbodies due to system malfunctions. Septic systems treat human wasteusing a collection system that discharges liquid waste into the soil through a series of distributionlines that comprise the drain field. In properly functioning (normal) systems, phosphates areadsorbed and retained by the soil as the effluent percolates through the soil to the shallow saturatedzone. Therefore, normal systems contribute very little phosphorus loads to nearby waterbodies. Aponding septic system malfunction occurs when there is a discharge of waste to the soil surface(where it is available for runoff); as a result, malfunctioning septic systems can contribute highphosphorus loads to nearby waterbodies. Short-circuited systems (those systems in close proximityto surface waters where there is limited opportunity for phosphorus adsorption to take place) alsocontribute significant phosphorus loads; septic systems within 250 feet of the lake are subject topotential short-circuiting, with those closer to the lake more likely to contribute greater loads.Additional details about the process for estimating the population served by normal andmalfunctioning systems within the lake drainage basin is provided in Appendix A.11
GIS analysis of orthoimagery for the basin shows approximately 101 houses within 50 feet of theshoreline and 302 houses between 50 and 250 feet of the shoreline; all of the houses are assumed tohave septic systems. Additionally, 85 houses were identified as directly abutting stream banks in thewatershed. Within 50 feet of the shorelines and on stream banks, 100% of septic systems werecategorized as short-circuiting. Between 50 and 250 feet of the shoreline, 80% of septic systemswere categorized as short-circuiting, 5% were categorized as ponding systems, and 15% werecategorized as normal systems. To convert the estimated number of septic systems to populationserved, an average household size of 2.61 people per dwelling was used based on the circa 2000USCB census estimate for number of persons per household in New York State. To account forseasonal variations in population, data from the 2000 census were used to estimate the percentage ofseasonal homes for the town(s) surrounding the bay. Approximately 78% of the homes around thebay are assumed to be year-round residences, while 22% are seasonally occupied (i.e., June throughAugust only). The estimated population in the Port Bay drainage basin served by normal andmalfunctioning systems is summarized in Table 4.Table 4. Population Served by Septic Systems in the Port Bay Drainage BasinSeptember – MayJune – August (Summer)Normally Functioning92118Ponding3139Short Circuiting8711116Total99412734.2.3. Agricultural RunoffAgricultural land encompasses 8,437 acres (40.0%) of the bay’s drainage basin and includes hay andpasture land (22.3%) and row crops (17.7%). Overland runoff from agricultural land is estimated tocontribute 1,869 lbs/yr of phosphorus loading to Port Bay, which is 4.5% of the total phosphorusloading to the bay.In addition to the contribution of phosphorus to the bay from overland agriculture runoff,additional phosphorus originating from agricultural lands is leached in dissolved form from thesurface and transported to the bay through subsurface movement via groundwater. The process forestimating subsurface delivery of phosphorus originating from agricultural land is discussed in theGroundwater Seepage section (below). Phosphorus loading from agricultural land originatesprimarily from soil erosion and the application of manure and fertilizers. Implementation plans foragricultural sources will require voluntary controls applied on an incremental basis.4.2.4. Urban and Residential Development RunoffDeveloped land comprises 1,333 acres (6.3%) of the bay’s drainage basin. Stormwater runoff fromdeveloped land contributes 295 lb/yr of phosphorus to Port Bay, which is about 0.7% of the totalphosphorus loading to the bay. This load does not account for contributions from malfunctioningseptic systems.In addition to the contribution of phosphorus to the bay from overland urban runoff, additionalphosphorus originating from developed lands is leached in dissolved form from the surface andtransported to the bay through subsurface movement via groundwater. The process for estimating12
subsurface delivery of phosphorus originating from developed land is discussed in the GroundwaterSeepage section (below).Phosphorus runoff from developed areas originates primarily from human activities, such asfertilizer applications to lawns. Shoreline development, in particular, can have a large phosphorusloading impact to nearby waterbodies in comparison to its relatively small percentage of the totalland area in the drainage basin.4.2.5. Forest Land RunoffForested land comprises 10,022 acres (47.6%) of the bay’s drainage basin. Runoff from forested landis estimated to contribute about 30 lbs/yr of phosphorus loading to Port Bay, which is about 0.1%of the total phosphorus loading to the bay. Phosphorus contribution from forested land isconsidered a component of background loading.4.2.6. Groundwater SeepageIn addition to nonpoint sources of phosphorus delivered to the bay by surface runoff, a portion ofthe phosphorus loading from nonpoint sources seeps into the ground and is transported to the bayvia groundwater. Groundwater is estimated to transport 3,906 lbs/yr (9.3%) of the total phosphorusload to Port Bay. With respect to groundwater, there is typically a small background concentrationowing to various natural sources. In the Port Bay drainage basin, the model-estimated groundwaterphosphorus concentration is 0.058 mg/L. The GWLF manual provides estimated backgroundgroundwater phosphorus concentrations for 90% forested land in the eastern United States, whichis 0.006 mg/L. Consequently, about 10% of the groundwater load (404 lbs/yr) can be attributed tonatural sources, including forested land and soils.The remaining amount of the groundwater phosphorus load likely originates from agricultural ordeveloped land sources (i.e., leached in dissolved form from the surface). It is estimated that theremaining 3,501.5 lbs/yr of phosphorus transported to the bay through groundwater originates fromdeveloped land (477.4 lbs/yr) and agricultural sources (3,024.1 lbs/yr), proportional to theirrespective surface runoff loads. Table 5 summarizes this information.Table 5. Sources of Phosphorus Transported in the Subsurface via GroundwaterNatural SourcesAgricultural LandDeveloped LandTOTALTotal Phosphorus (lbs/yr)404.03,024.1477.43,905.5% of Total Groundwater Load10.35%77.43%12.22%100.00%4.2.7. Internal LoadingPort Bay has been exposed to nutrient loading that is much higher than its assimilative capacity.Over time, much of this excess phosphorus has been deposited into the bottom sediments. Internalphosphorus loading from lake sediments can be an important component of the phosphorus budgetfor lakes, especially shallow lakes. Excess phosphorus in a lake’s bottom sediments is available for13
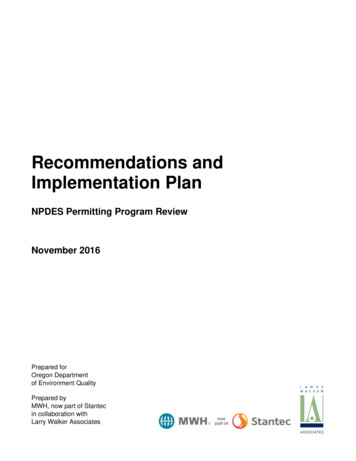
release back into the water column when conditions are favorable for nutrient release. Suchconditions can include re-suspension of sediments by wind mixing or rough fish activity (e.g.,feeding off bottom of lake), sediment anoxia (i.e., low dissolved oxygen levels near the sedimentwater interface), high pH levels, die-offs of heavy growths of curly-leaf pond weeds, and othermechanisms that result in the release of poorly bound phosphorus.Accurate simulation of internal phosphorus loading is an uncertain science and a generally applicablemethod has yet to be identified. Several existing methods were considered for estimating internalloading in Port Bay. However, a lack of sufficient data hindered the ability to verify the ability ofthese methods to accurately simulate the internal loading process. Therefore, once all externalsources of phosphorus loading were identified, the remaining load was assumed to be originatingfrom internal sources (i.e., lake bottom sediments). Based on this determination, internal loading iscurrently estimated to contribute about 31,724 lbs/yr (75.7%) of phosphorus to Port Bay.4.2.8. Other SourcesAtmospheric deposition, wildlife, waterfowl, and domestic pets are also potential sources ofphosphorus loading to the bay. All of these small sources of phosphorus are incorporated into theland use loadings as identified in the TMDL analysis (and therefore accounted for). Further, thedeposition of phosphorus from the atmosphere over the surface of the bay is accounted for in thebay model, though it is small in comparison to the external loading to the bay.5.0DETERMINATION OF LOAD CAPACITY5.1.Lake Modeling Using the BATHTUB ModelBATHTUB was used to define the relationship between phosphorus loading to the bay and theresulting concentrations of total phosphorus in the bay. The U.S. Army Corps of Engineers’BATHTUB model predicts eutrophication-related water quality conditions (e.g., phosphorus,nitrogen, chlorophyll a, and transparency) using empirical relationships previously developed andtested for reservoir applications (Walker, 1987). BATHTUB performs steady-state water andnutrient balance calculations in a spatially segmented hydraulic network. Appendix B discusses thesetup, calibration, and use of the BATHTUB model.5.2.Linking Total Phosphorus Loading to the Numeric Water Quality TargetIn order to estimate the loading capacity of the bay, simulated phosphorus loads from MapShed andcalculated internal loads were input to the BATHTUB model, which was then used to simulatewater quality in Port Bay. MapShed was used to derive a mean annual phosphorus loading to the bayfor the period 1990-2007. Using this external load and the calculated internal load as input,BATHTUB was used to simulate water quality in the bay. The results of the BATHTUB simulationwere compared against the average of the bay’s observed summer mean phosphorus concentrationsfor the years 1990-1991 and 2003-2006. Year-specific loading was also simulated with MapShed forexternal loading and calculated for internal loading, run through BATHTUB, and compared againstthe observed summer mean phosphorus concentration for years with observed in-lake data. Thecombined use of MapShed, BATHTUB, and internal loading estimates provides a decent fit to theobserved data for Port Bay (Figure 8).14
Figure 8. Observed vs. Simulated Summer Mean Epilimnetic Total PhosphorusConcentrations (µg/L) in Port 80(ug/l)6040200The BATHTUB model was used as a “diagnostic” tool to derive the total phosphorus loadreduction required to achieve the current phosphorus target of 20 µg/L. The loading capacity ofPort Bay was determined by running BATHTUB iteratively, reducing the concentration of thedrainage basin phosphorus load (which in turn reduced the internal load) until model resultsdemonstrated attainment of the water quality target. As external loading is reduced, internal loadingis also reduced; thus the percent reduction in internal loading is estimated to be proportional to thepercent reduction in external loading. The maximum concentration that results in compliance withthe TMDL target for phosphorus is used as the basis for determining the bay’s loading capacity.This concentration is converted into a loading rate using simulated flow from MapShed.The maximum annual phosphorus load (i.e., the annual TMDL) that will maintain compliance withthe phosphorus water quality goal of 20 µg/L in Port Bay is a mean annual load of 2,251 lbs/yr. Thedaily TMDL of 6.2 lbs/day was calculated by dividing the annual load by the number of days in ayear. Lakes and reservoirs store phosphorus in the water column and sediment, therefore waterquality responses are generally related to the total nutrient loading occurring over a year or season.For this reason, phosphorus TMDLs for lakes and reservoirs are generally calculated on an annualor seasonal bas
photography and geographic information system (GIS) datasets. Digital land use/land cover data were obtained from the 2001 National Land Cover Dataset (NLCD, Homer, 2004). The NLCD is a consistent representation of land cover for the conterminous United States generated from classified 30-meter resolution Landsat thematic mapper satellite imagery data. High-resolution color orthophotos were .