Transcription
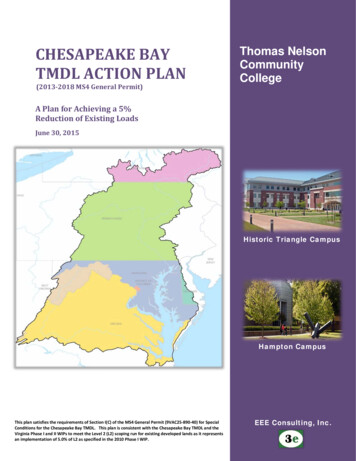
Data Collection in Support of Upper Yadkin RiverWatershed‐High Rock LakeChlorophyll‐a and Turbidity TMDL ModelingFINAL REPORTPrepared for:North Carolina Department of Environment and NaturalResourcesDivision of Water Quality 319 Grant ProgramJuly 31, 2010
This page is blank to facilitate double sided printing.
Data Collection in Support of Upper YadkinRiver Watershed‐High Rock LakeChlorophyll‐a and Turbidity TMDL ModelingFINAL REPORTJuly 31, 2010Prepared for:North Carolina Department of Environment and Natural ResourcesPrepared by:LimnoTechAnn Arbor, MichiganSponsor:Fiscal Year of Grant:NC-DENR Contract Number:Contract Period:Federal Dollar Amount:Project Coordinator:Yadkin Pee-Dee River Basin Association2007EWO8011August 1, 2007 – July 31, 2010 462,200Stan Webb
ACKNOWLEDGEMENTSThis project was funded through the support of the North Carolina Department ofEnvironment and Natural Resources and an EPA Section 319 Grant.We would like to acknowledge the contributions of the following individuals andorganizations for their work in making this project a success:Stan Webb – Yadkin Pee-Dee River Basin AssociationRon Hargrove – City of Winston-Salem, NCJeff Jones – City of Salisbury, NCKim Hinson – City of Monroe, NCKathy Stecker – North Carolina Division of Water QualityPete Caldwell - North Carolina Division of Water QualityPam Behm - North Carolina Division of Water QualityDiane Reid - North Carolina Division of Water QualityMichelle Woolfolk – North Carolina Division of Water Quality (formerly)Kim Nimmer – North Carolina Division of Water Quality 319 GrantCoordinatorLaura Spell – North Carolina Division of Water Quality Intensive Survey UnitAlcoa Power Generating, Inc.North Carolina Department of Environment and Natural ResourcesYadkin Pee-Dee River Basin AssociationHigh Rock Lake Technical Advisory CommitteeCity of Lexington, North CarolinaEnvironment 1 Analytical LaboratoriesLimnoTech
High Rock Lake TMDL Water Quality MonitoringJuly 31, 2010Final ReportTABLE OF CONTENTS1. EXECUTIVE SUMMARY . 12. INTRODUCTION/BACKGROUND . 52.1 Problem Definition. 52.2 EPA 319 Grant Application . 102.3 Project Partners . 102.4 Project Goals . 113. DELIVERABLES . 134. METHODOLOGY/EXECUTION . 154.1 Lake Sampling . 164.2 Ambient/Enhanced Ambient Watershed Monitoring . 234.3 Focused (High Flow) Watershed Monitoring . 294.3.1 FOCUSED (HIGH FLOW) SAMPLING PROTOCOL . 344.4 ACCESS Database . 365. OUTPUTS AND RESULTS. 375.1 Watershed Monitoring . 375.1.1 WATERSHED LOADS. 461.FIGURE 4. ANNUAL WATERSHED LOADS TO HIGH ROCK LAKE BYSTATION (NH3, N N, TP AND TSS . 491.515.1.2 WATERSHED SYSTEM BEHAVIORS . 515.2 Lake Monitoring . 535.2.1 LAKE SYSTEM BEHAVIORS. 596. OUTCOMES AND CONCLUSIONS . 637. BUDGET . 678. REFERENCES . 69LimnoTechPage i
High Rock Lake TMDL Water Quality MonitoringJuly 31, 2010Final ReportLIST OF TABLESTable 1.Table 2.Table 3.Table 4.Table 5.Table 6.Table 7.Table 8.Table 9.Yadkin Pee-Dee River Basin 2008 303(d) List Impairments .6Existing Data Prior to 2007 .92006 TAC Recommendations for Addressing Significant Data Gaps .10High Rock Lake TMDL Monitoring – Revised Project Deliverables .14High Rock Lake Monitoring – Summary of Locations and Parameters.19Lake Sampling Dates .21Lake Analytical and Field Parameters Monitored at all Stations .22Lake Analytical Parameters – Monitoring Station Specific .22Enhanced Ambient Watershed Monitoring – Summary of Locations andParameters .25Table 10. Enhanced Ambient Monitoring Schedule .27Table 11. Ambient and Enhanced Ambient Monitoring Dates.28Table 12. Enhanced Ambient Watershed Monitoring - Analytical andField Parameters .29Table 13. Focused (Wet Weather) Watershed Monitoring – Summary of Locationsand Parameters .31Table 14. Focused (High Flow) Monitoring Schedule .33Table 15. Focused (High Flow) Monitoring Dates .33Table 16. Focused (High Flow) Monitoring – Analytical and Field Parameters.34Table 17. USGS Gage Locations .35Table 18. Watershed Physical Data Summary (April 2008 through March 2010) .39Table 19. Watershed Focused Flow Sample Data Summary(April 2008 through January 2010) .40Table 20. Watershed Precipitation Data Related To Focused Flow Events .41Table 21. NCDWQ Watershed Ambient/Enhanced Ambient Grab Sample DataSummary (April 2008 through April 2010) .42Table 22. YPDRBA/Environment 1Watershed Enhanced Ambient GrabSample Data Summary (April 2008 through February 2010) .43Table 23. Focused Flow-Ambient/Enhanced Ambient SamplingResults Comparison.45Table 24. Annual Watershed Loads (metric tons) .47Table 25. NPDES Permit Holders .52Table 26. Discrete Lake Sample Physical Data Summary (April 2008 through March2010).55Table 27. Summary of Composited Lake Sample Data (April 2008 through March2010).56Table 28. Summary of Lake Hypolimnion Discrete Sample Data .57Table 29. 2007 319 Grant Budget .67LimnoTechPage ii
High Rock Lake TMDL Water Quality MonitoringJuly 31, 2010Final ReportLIST OF FIGURESFigure 1. High Rock Lake Monitoring Location Map .7Figure 2. High Rock Lake Watershed Monitoring Location Map .8Figure 3 Annual Watershed Loads to High Rock Lake by Year(NH3, N N, TP, TSS) .48Figure 4. Annual Watershed Loads to High Rock Lake by Station(NH3, N N, TP and TSS .49APPENDICESAppendix A: Data Collection in Support of Upper Yadkin River Watershed - HighRock Lake Chlorophyll-a and Turbidity TMDL Modeling319 Grant ApplicationAppendix B: Correspondence with all participating Public Agencies (on CD)Appendix C: Quarterly Progress ReportsAppendix D: High Rock Lake TMDL Monitoring Project – July 13, 2010 PublicMeeting Presentation Materials for Public MeetingAppendix E: High Rock Lake TMDL Database Structure Report 2008-2010Monitoring Program.Appendix F: High Rock Lake TMDL Monitoring Project Quality Assurance ProjectPlanAppendix G: Laboratory Reports, Laboratory QA/QC, Field Notes and CalibrationLogs (on CD)Appendix H: High Rock Lake TMDL Monitoring Project Database (on CD)Appendix I: GIS Information for Project Area MapsAppendix J: Watershed Data FiguresAppendix K: Lake Data FiguresAppendix L: Particle Size Distribution DataAppendix M: 319 Grant Budget DetailsLimnoTechPage iii
High Rock Lake TMDL Water Quality MonitoringJuly 31, 2010Final ReportThis page is blank to facilitate double sided printing.LimnoTechPage iv
High Rock Lake TMDL Water Quality MonitoringJuly 31, 20101. EXECUTIVE SUMMARYHigh Rock Lake is an impoundment of the Yadkin River and was constructed in 1929to provide hydroelectric power. The lake is also classified for aquatic life, watersupply and primary recreation. It is owned and operated by the Yadkin Division ofAlcoa Power Generating, Inc. (APGI). High Rock Lake has a large watershed,including portions of 11 counties and 34 municipalities. There are more than 23major NPDES dischargers with flows greater than 1 million gallons per day (MGD)in the lake watershed, including discharges direct to the lake or close to the lake. Thetotal permitted discharge to the watershed is approximately 126 MGD. Thewatershed also contains a significant proportion of North Carolina’s total capacity fordairy production, including 76 registered animal operations.The lake has been monitored since the early 1970s, and has consistently shown a highlevel of eutrophication, with elevated chlorophyll-a, nutrient concentrations, anddissolved gas levels. The lake also receives large inputs of sediment. The sedimentload, combined with algal production, results in turbidity problems throughout thelake. High Rock Lake has been placed on the North Carolina list of impaired watersfor exceedances of the chlorophyll-a (entire lake), turbidity (upper portion of the lakeand the Abbotts Creek Arm), and pH (entire lake with exception of the upper portionof the Abbotts Creek Arm) standards and requires development of Total MaximumDaily Loads (TMDLs).The TMDLs for High Rock Lake will provide allowable nutrient loads associatedwith attainment of the chlorophyll-a standard and the allowable sediment loadassociated with the turbidity standard. Completion of the TMDLs for High RockLake will require the development of water quality models for nutrient response andwatershed loading. The objective of this project was to collect the necessary data todevelop, calibrate, confirm and apply a linked watershed-lake model aimed atquantifying the relationship between land use and activities in the watershed, nutrientand sediment loading from watershed to the lake, and the lake quality response interms of turbidity and nutrient driven trophic conditions. In 2007, the North CarolinaDepartment of Environment and Natural Resources Division of Water Quality(NCDWQ) and the project management team, after consultation with Region 4 EPA,decided upon using HSPF to model the watershed and WASP7 linked to EFDC tomodel the hydrodynamic and nutrient responses in the lake. The project team verifiedthat the database developed as part of this project would support the chosen models.The Data Collection in Support of Upper Yadkin River Watershed-High Rock LakeChlorophyll-a and Turbidity TMDL Modeling project (referred to as the High RockLake TMDL Water Quality Monitoring project) was funded by an EPA 319 grant tocollect the data necessary to develop the models used in the TMDL process. Asstated in the 319 grant application, the project goals were as follows:1. Collect watershed and lake data acceptable for input to an approvable TMDLfor High Rock Lake.LimnoTechPage 1
High Rock Lake TMDL Water Quality MonitoringJuly 31, 2010Final Report2. Estimate the relative point and non-point source contributions to nutrientloads, including generated and delivered loads. Provide spatial and temporalinformation regarding the sources of non-point source loads.3. Provide data for development, calibration and validation of a watershed modeland a lake water quality model.4. Support the development of non-point source management strategies,voluntary and mandatory, to reduce nutrient and sediment loading in thewatershed.Project deliverables included the following: Quality Assurance Project Plan (QAPP) Hard copy and electronic copy of all data sets Quarterly Progress Reports GIS Maps Access database with data for model development and evaluation Correspondence with all participating public agencies Presentation materials for final meeting to present 319 Project results toNCDWQ, High Rock Lake TAC, YPDRBA, and other interested parties. Preliminary characterization and relative contribution from point sources andnon-point sources within the watershed Data-based pollutant load estimates to High Rock Lake Baseline conditions for prioritizing and then evaluating implementation ofBMPs Semi-annual public meetings of the TMDL Technical Advisory Committee Public outreach event Final meeting to present 319 project results to NCDWQ, High Rock LakeTechnical Advisory Committee, Members of YPDRBA, Alcoa PowerGeneration Inc. and other interested parties Final Project ReportThe Data Collection activities were conducted from April 7, 2008 through April 5,2010. Samples were collected on a routine basis in the lake and watershed, as well asin response to high flow events in the watershed. The data from the sampling eventsLimnoTechPage 2
High Rock Lake TMDL Water Quality MonitoringJuly 31, 2010Final Reportwill be used to characterize both the lake and watershed response to various stimuli,including seasonal weather changes. The field study also included collection ofbathymetry, temperature, weather data, hydrology, physical parameters, turbidity,total dissolved solids, total suspended solids, and nutrient data for High Rock Lakeand the watershed. Specifically, the two-year field study incorporated four tasks: High Rock Lake monitoring at ten stations, conducted by NCDWQ IntensiveSurvey (IS) and APGI. This work was done through matching funds fromAPGI and in-kind services from NCDWQ. Enhanced Ambient Watershed monitoring at twelve stations (a subset ofwatershed and tributary sampling locations that routinely are monitored forambient water quality data, but are included for enhanced monitoring insupport of the TMDL modeling study). This sampling work was donethrough matching funds from YPDRBA and in-kind services from NCDWQ. Focused (High Flow) Watershed monitoring at 14 stations. Twelve of thesestations also correspond to those that were sampled for enhanced watershedmonitoring. Funding for the high flow monitoring task was provided throughYPDRBA’s Section 319 Grant. Construction of an Access Database to include all information derived fromthe monitoring project. This work was completed with the 319 Grant funds.The data collected during the April 2008 -April 2010 sampling program suggestgeneral system behaviors that the models will need to capture to give NCDWQconfidence in computing and allocating the TMDL. The following observations canbe made from the watershed data:1. Total Phosphorus (TP) and Total Suspended Solids (TSS) generally increasewith increasing flow in the Yadkin River at Yadkin College (sampling stationQ2810000), suggesting that the river is carrying more suspended solids byfraction of TP as particulate matter. This also suggest the importance of nonpoint source runoff in terms of the load to the lake.2. The South Yadkin at Mocksville tributary (sampling station Q3460000) is thesecond largest contributor of loads to High Rock Lake. Here, TP and TSSgenerally increase with increasing flow, as at station Q2810000.3. At the Abbotts Creek sampling station (Q5930000), TP concentrations do notappear to have much of a response to flow. This indicates a greater pointsource load.4. TP and turbidity concentrations show some increase with flow at Enon(sampling station Q2040000), as compared to Abbotts Creek.5. The bulk of the watershed loads of NH3, N N, TP and TSS are coming intothe system at the head of the reservoir (sampling stations Q2810000 andQ3460000). However, the two study years are very different in terms of themagnitude of loads to the system. Very high flows occurred during the earlypart of 2010, with correspondingly higher loads when compared to early 2009.LimnoTechPage 3
High Rock Lake TMDL Water Quality MonitoringJuly 31, 2010Final ReportThe following observations can be made from the lake data:1. In late summer, the dissolved oxygen (DO) in the main stem of the lake issupersaturated at the surface of the lake, but declines sharply with depth afterone meter. The higher DO concentrations at and near the lake surface are theresult of high primary productivity, which produces oxygen. Concentrationsof DO decline sharply with depth because of the high oxygen demand exertedin the hypolimnion exerted by decay of settling phytoplankton and sedimentoxygen demand (SOD).2. The abundance of algal growth at the surface of the lake during the summermonths also results in higher pH near the surface, with a fairly significant dropin pH with depth. This results from the consumption of CO2 (an acid) byalgae.3. Suspended solids (TSS) along the main stem of the lake respond strongly tospring high flow and November high flow periods. . TSS peaks are highestfurther upstream along the main stem of the lake because of the influence ofthe Yadkin River loads, which enter at the upstream end of the lake. Furtherdownstream, the system is not responding much to the high flow peaks. Thisis likely the result of lower suspended solids concentrations from dilution andsettling of solids as the reservoir widens and deepens going downstream.4. The lake arm stations show the highest concentrations of TSS during Januaryand February, and are not showing the spring and fall peaks observed alongthe main stem. This likely is due to the smaller arm drainage areas relative tothe main stem drainage area.5. Chlorophyll-a is relatively high at the furthest upstream main stem station,suggesting that additional algal growth may be occurring in the river upstreamof the lake.6. Chlorophyll-a concentrations at the main stem stations generally rangebetween 50 to 70 ug/l during the summer months and drop off significantlyduring the winter months.7. At the lake arm stations, chlorophyll-a concentrations also are highest duringthe summer months, but do not drop off as much during the winter months.LimnoTechPage 4
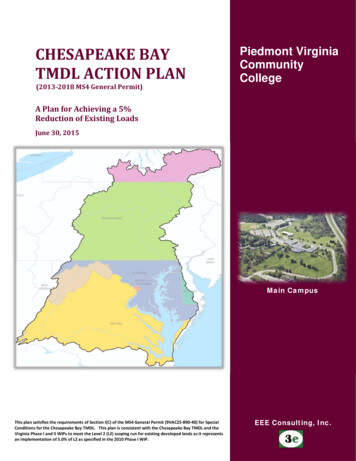
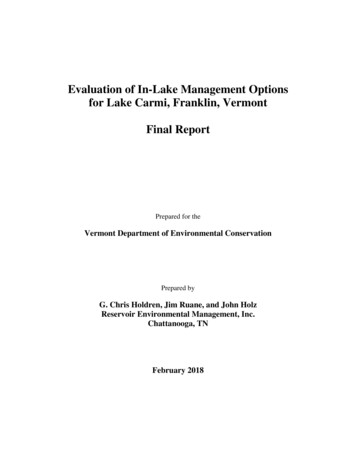
High Rock Lake TMDL Water Quality MonitoringJuly 31, 2010Final Report2. INTRODUCTION/BACKGROUNDThe Data Collection in Support of Upper Yadkin River Watershed-High Rock LakeChlorophyll-a and Turbidity TMDL Modeling project (referred to as the High RockLake TMDL Water Quality Monitoring project) was funded by an EPA 319 grant tocollect the data necessary to develop the models used in the TMDL process.High Rock Lake is an impoundment of the Yadkin River and was constructed in 1929to provide hydroelectric power. The lake is also classified for aquatic life, watersupply and primary recreation. It is owned and operated by the Yadkin Division ofAlcoa Power Generating, Inc. (APGI). The average daily flow in the Yadkin Riverabove the lake exceeds 3,000 cubic feet per second (cfs), resulting in short averagehydraulic retention times for the reservoir, typically ranging from 15 to 30 days. Dueto hydropower operation, outflow from the lake is relatively constant, but lake levelsvary dramatically according to inflows. The maximum reported depth is 52 feet.Although most of the flow occurs along the main axis of the lake, there are significanttributary cove areas, such as Abbotts Creek and Second Creek (see Figure 1).High Rock Lake has a large watershed, including portions of 11 counties and 34municipalities (see Figure 2). There are more than 23 major NPDES dischargers withflows greater than 1 million gallons per day (MGD) in the lake watershed, includingdischarges direct to the lake or close to the lake. The total permitted discharge to thewatershed is approximately 126 MGD. The watershed also contains a significantproportion of North Carolina’s total capacity for dairy production, including 76registered animal operations.2.1 PROBLEM DEFINITIONThe lake has been monitored since the early 1970s, and has consistently shown a highlevel of eutrophication, with elevated chlorophyll-a, nutrient concentrations, anddissolved gas levels. The lake also receives large inputs of sediment. The sedimentload, combined with algal production, results in turbidity problems throughout thelake. High Rock Lake was placed on the North Carolina list of impaired waters in2004 for exceedances of the chlorophyll a and turbidity standards in the lake, andrequires development of Total Maximum Daily Loads (TMDLs). The specificimpairments from the 2008 303(d) list are shown in Table 1 and now include highpH. However, this study was designed to address the issues of high turbidity andchlorophyll-a concentrations and collect the data necessary to develop, calibrate,confirm and apply a linked watershed-lake model required for development of thechlorophyll- a and turbidity TMDLs.LimnoTechPage 5
High Rock Lake TMDL Water Quality MonitoringJuly 31, 2010Final ReportTable 1. Yadkin Pee-Dee River Basin 2008 303(d) List odyYadkin River(including upperportion of High RockLake (HRL) belownormal operating levelYadkin River(including lowerportion of HRL)12-(124.5)aYadkin River(including lowerportion of HRL)12-118.5aAbbotts Creek Arm ofHRLAbbotts Creek Arm ofHRLSecond Creek Arm ofHRL12-118.5b12-117-(3)LimnoTechDescriptionFrom mouth of Grants Creek to aline across HRL from thedownstream (d/s) side of mouth ofCrane Creek to the d/s side ofmouth of Swearing CreekFrom a line across HRL from thed/s side of mouth of Crane Creekto the d/s side of mouth ofSwearing Creek to a point 0.6miles upstream (u/s) of dam ofHRL, except for the Abbotts CreekArm of HRL from source to a point1.7 miles u/s of Rowan County SR1004From a point 0.6 miles upstream ofdam of HRL to High Rock LakeDamFrom source at I-85 to NC 47From NC 47 to Davidson CountySR 2294From a point 1.7 miles downstreamof Rowan County SR 1004 to HighRock LakeAssessmentUnit size5,569 acresParametersChlorophyll-a,High pH, Turbidity4,870 acresChlorophyll-a,High pH10.8 acresChlorophyll-a,High pH3.7 milesChlorophyll-a5.9 milesChlorophyll-a,High pH, TurbidityChlorophyll-a,High pH894.9 acresPage 6
High Rock Lake TMDL Water Quality MonitoringJuly 31, 2010Final ReportFigure 1. High Rock Lake Monitoring Location MapLimnoTechPage 7
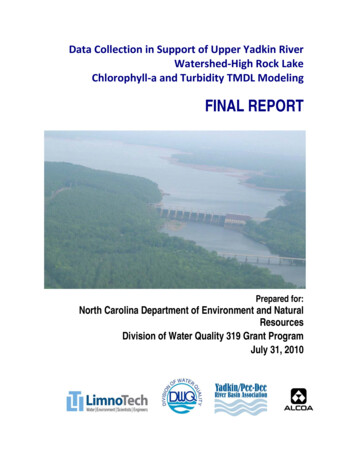
High Rock Lake TMDL Water Quality MonitoringJuly 31, 2010Final ReportFigure 2. High Rock Lake Watershed Monitoring Location MapLimnoTechPage 8
High Rock Lake TMDL Water Quality MonitoringJuly 31, 2010Final ReportEPA requires that TMDLs should be completed within 8 to 13 years of the originallisting. Thus, the TMDLs for High Rock Lake should be completed by 2012 to 2017.The TMDL process requires an initial planning, design and budgeting phase. Areview of the existing data was conducted in 2004. A monitoring and modeling studyplan that addressed project responsibilities, goals and approaches was prepared by theNorth Carolina Department of Environment and Natural Resources (NCDENR)Division of Water Quality (NCDWQ) in January 2006. The monitoring andmodeling must be conducted prior to developing the TMDL strategy which includes:target setting; allocation; and point and non-point strategies. The results of the HighRock Lake TMDL Water Quality Monitoring project will provide information formodels of the watershed and the lake, to support the TMDL development.A general stakeholder group was formed in 2005 and designated as the High RockLake Technical Advisory Committee (TAC). The group has met regularly andprovided input on the field study and modeling plan presented by NCDWQ. Asummary of the data that existed when this project began is shown in Table 2. The2006 TAC recommendations for addressing significant data gaps for modeldevelopment are shown in Table 3.Table 2. Existing Data Prior to 2007TimePeriodLocationParametersDissolved oxygen,Secchi depth,suspended solids,chlorophyll-a,nutrientsFlow, stage,dissolved oxygen,nutrients, turbiditySince1973High RockLakeSince1974HRLtributaries19891990HRL2 stationsAlgal biomass andspecies numbersHRL - lakearms/tribs13 sitesHRLtributaries18 sitesDissolved quencyAgencyNCDWQmonthlyNCDWQNCDWQMonthly for6 monthseach yearProgramLakesAssessmentMonitoringProgramAmbient SurfaceWater CDWQYPDRBAPage 9
High Rock Lake TMDL Water Quality MonitoringJuly 31, 2010Final ReportTable 3. 2006 TAC Recommendations for Addressing Significant Data GapsLocationParametersHigh Rock LakeChlorophyll-aHigh Rock LakeNH3, TKN, Nitrite Nitrate, Total Phosphorus,Orthophosphate, Total Organic Carbon, TotalSuspended Solids, Volatile Suspended Solids,Total Dissolved Solids, Total Solids, TotalVolatile Solids, turbidity, Soluble Total SilicaHigh Rock LakeBiochemical Oxygen Demand (BOD)High Rock Lake2006 Sediment Oxygen Demand (SOD)TributariesNH3, Nitrite Nitrate, TKN, Total Phosphorus,Orthophosphate, BOD5, Total Organic Carbon,Total Solids, Total Volatile Solids, TotalSuspended Solids, Volatile Suspended Solids,Total Dissolved Solids, turbidityNotesUse current method (EPA 445) withadequate quality control in placeHigh frequency samplingRoutine monitoring scheduleUse to support a dissolved oxygenmodel of the lakeUse to support a dissolved oxygenmodel of the lakeDuring high and low flows to definenutrient and sediment loads2.2 EPA 319 GRANT APPLICATIONThe 319 grant application was submitted to NCDENR in May 2006 requesting fundsto support the TMDL monitoring project. Matching funds came from the YPDRA,the City of Winston-Salem, APGI and in-kind services from NCDWQ.The grant application is included in Appendix A.2.3 PROJECT PARTNERSThe Yadkin/Pee-Dee River Basin Association (YPDRBA) was the project sponsor forthe monitoring program. Stan Webb, retired from the City of Winston-Salem, servedas the project manager and was responsible for general oversight of the project,including review and approval of all work products.Consultants to the project included LimnoTech of Ann Arbor, Michigan andEnvironment 1, Inc. of Greenville, North Carolina. The YPDRBA was responsiblefor management and oversight of the consultants, as well as development of theQAPP. LimnoTech was primarily responsible for technical support, guidance, andcoordination of the watershed monitoring program during high flow conditions.Environment 1, Inc. was responsible for laboratory analytical testing associated withthe monitoring program (with the exception of some special analyses that wereperformed by other laboratories) and they performed ambient monitoring at six (6)watershed sites on behalf of the YPDRBA and high flow (focused flow) monitoringat fourteen (14) watershed stations on behalf of the YPDRBA.The NCDWQ was responsible for the routine lake sampling at ten (10) locations,continuous temperature monitoring at three (3) lake locations, specialized sampling atLimnoTechPage 10
High Rock Lake TMDL Water Quality MonitoringJuly 31, 2010Final Reportselect lake locations, ambient monitoring in the watershed at eight (8) locations andlaboratory analysis for the ambient samples they collected and for split lake samplesanalyzed for chlorophyll-a. Alcoa Power Generating Inc. was responsible forproviding supplemental ambient lake monitoring during the summer months.Purposeand GoalsThe TMDLs for High Rock Lake will provide allowable nutrient loads associatedwith attainment of the chlorophyll-a standard and the allowable sediment loadassociated with the turbidity standard. Completion of the TMDLs for High RockLake will require the development of water quality models for nutrient response andwatershed loading. The objective of this project was to collect the necessary data todevelop, calibrate, confirm and apply a linked watershed-lake model aimed atquantifying the relationship between land use and activities in the watershed, nutrientand sediment loading from watershed to the lake, and the lake quality response interms of turbidity and nutrient driven trophic conditions.In 2007, NCDWQ and the project management team, after consultation with Region 4EPA, decided upon using HSPF to model the watershed and WASP7 linked to EFDCto model the hydrodynamic and nutrient responses in the lake. The project teamverified that the database developed as part of this project would support the chosenmodels.2.4 PROJECT G
Laura Spell - North Carolina Division of Water Quality Intensive Survey Unit Alcoa Power Generating, Inc. . High Rock Lake TMDL Water Quality Monitoring July 31, 2010 Final Report LimnoTech Page 2 2. Estimate the relative point and non-point source contributions to nutrient