Transcription
PENSynthesis of clathrate cerium superhydride CeH9at 80-100 GPa with atomic hydrogen sublattice1234567890():,;Nilesh P. Salke1, M. Mahdi Davari Esfahani2, Youjun Zhang3, Ivan A. Kruglov4,5, Jianshi Zhou6, Yaguo Wang6,Eran Greenberg 7, Vitali B. Prakapenka7, Jin Liu 1, Artem R. Oganov 8,4,9* & Jung-Fu Lin 10*Hydrogen-rich superhydrides are believed to be very promising high-Tc superconductors.Recent experiments discovered superhydrides at very high pressures, e.g. FeH5 at 130 GPaand LaH10 at 170 GPa. With the motivation of discovering new hydrogen-rich high-Tcsuperconductors at lowest possible pressure, here we report the prediction and experimentalsynthesis of cerium superhydride CeH9 at 80–100 GPa in the laser-heated diamond anvilcell coupled with synchrotron X-ray diffraction. Ab initio calculations were carried out toevaluate the detailed chemistry of the Ce-H system and to understand the structure, stabilityand superconductivity of CeH9. CeH9 crystallizes in a P63/mmc clathrate structure with avery dense 3-dimensional atomic hydrogen sublattice at 100 GPa. These findings shed asignificant light on the search for superhydrides in close similarity with atomic hydrogenwithin a feasible pressure range. Discovery of superhydride CeH9 provides a practical platform to further investigate and understand conventional superconductivity in hydrogen richsuperhydrides.1 Center for High Pressure Science & Technology Advanced Research (HPSTAR), 100094 Beijing, China. 2 Department of Geosciences, Center for Materialsby Design, and Institute for Advanced Computational Science, State University of New York, Stony Brook, New York, NY 11794-2100, USA. 3 Institute ofAtomic and Molecular Physics, Sichuan University, 610065 Chengdu, China. 4 Department of Problems of Physics and Energetics, Moscow Institute ofPhysics and Technology, 9 Institutskiy Lane, Dolgoprudny City, Moscow Region 141700, Russia. 5 Dukhov Research Institute of Automatics (VNIIA), Moscow127055, Russia. 6 Department of Mechanical Engineering, The University of Texas at Austin, Austin, TX 78712, USA. 7 Center for Advanced RadiationSources, University of Chicago, Chicago 60637 IL, USA. 8 Skolkovo Institute of Science and Technology, Skolkovo Innovation Center, 3 Nobel Street, Moscow143026, Russia. 9 International Center for Materials Design, Northwestern Polytechnical University, 710072 Xi’an, China. 10 Department of GeologicalSciences, The University of Texas at Austin, Austin, TX 78712, USA. *email: artem.oganov@stonybrook.edu; afu@jsg.utexas.eduNATURE COMMUNICATIONS (2019)10:4453 https://doi.org/10.1038/s41467-019-12326-y www.nature.com/naturecommunications1
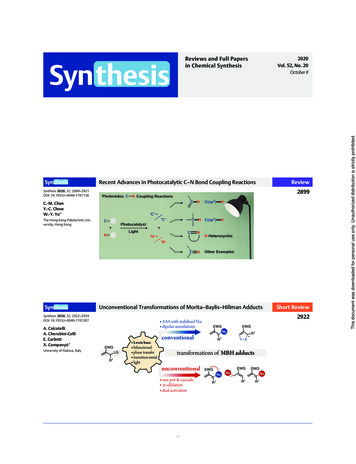
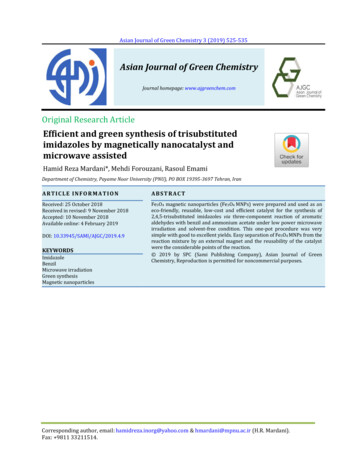
ARTICLEMNATURE COMMUNICATIONS tion of hydrogen under high pressure has been atopic of great scientific interest in the past few decadesmainly due to expectations of room-temperaturesuperconductivity1–7. Hydrogen is expected to become metallicunder high pressure above 400 GPa7–9. But achieving such pressures and verifying superconductivity are very challenging indiamond anvil cell (DAC) experiments, mainly due to diamondfailure and lack of a reliable probe on the tiny sample volumes atsuch high pressures. Alternatively, hydrogen-rich hydrides canalso be expected to achieve high-Tc superconductivity perhaps at amuch lower pressure than that of required for metallic hydrogen10–12. Both hydrides and metallic hydrogen are expected to beconventional superconductors. High phonon frequency, strongelectron–phonon coupling, and high density of states at the Fermilevel are the essential conditions for superconductivity withCooper pairs mediated by electron–phonon interaction13.Hydrides may satisfy all these conditions as the low mass ofhydrogen results in high phonon frequency; covalent bonding isfavourable for strong electron–phonon coupling; metallizationunder high pressure can result in high electronic density of statesat the Fermi level10. Within this view the remarkable predictionand experimental confirmation of superconductivity at a recordhigh Tc of 203 K under pressure of 150 GPa in H3S makessense14,15. The discovery of superconductivity in H3S gave hopesto achieve room-temperature superconductivity in hydrogen-richsystems under high pressure. Recently superconductivity with Tcof 260 K at 180 GPa and 250 K at 170 GPa were reported forLaH10 by two different research groups by electrical conductivitymeasurement16,17. Detecting Meissner effect to confirm thesuperconductivity has been difficult because signal from extremelysmall sample could be too weak to be picked up by the state-ofthe-art techniques. At such pressure the verification of Tc becomesa challenging task. A recent study by Drozdov et al. reported Tc of250 K in LaH10, which decreases with the application of magneticfield, and the isotope effect was also observed17. The discovery ofsuperconductivity in LaH10 is a milestone in the search of roomtemperature superconductivity.Hydrogen readily reacts with most elements to form binaryhydrides18,19. Several hydrogenic motifs such as Hδ , H2δ , H3 ,H3 , H4 , and H5 , and infinite chains, layers, frameworks werepredicted to occur in high-pressure hydrides20–22. Onedimensional hydrogen chains and three-dimensional clathratestructures with hydrogen cage were predicted and found to begood candidates for high Tc superconductivity20. Recent theoretical predictions have reported several systems with unusuallyhigh hydrogen content, termed as polyhydrides/superhydrides, tobecome stable under high pressure and to exhibit significantlyhigh Tc under pressure22–29. Notably CaH624, MgH626, YH627,YH923, YH1023,28, LaH1028, ThH1030, AcH10, and AcH1629 werepredicted to have Tc above 235 K. Most of the phases with Tcclose to room temperature are predicted to have a clathratestructure with hydrogen forming a cage around metal atom (M).In MH6, MH9, and MH10 compounds, metal atoms are locatedwithin H24, H29, and H32 cages, respectively23,24,27,28. However, itis essential to know the experimental pressure–temperaturecondition to stabilize a hydride before carrying out the furtherelectrical or magnetic measurement to verify the superconductivity. Recently, a handful of experiments were reported tosynthesize new superhydrides under pressure, particularly FeH5at 130 GPa31, LaH10 at 170 GPa32, UH7, UH8, and UH9 above 37GPa33. There were also experimental reports about synthesis ofnew and unusual hydrides under pressure, such as LiH634,NaH735, Xe(H2)736, and HI(H2)1337 with H2-like molecular units.Hydrides possessing H2-molecular units are not prone to havehigher Tc as they tend to have low densities of states at the Fermilevel23. Synthesis of FeH5 and LaH10 without any H2-like unit is2very intriguing. Interestingly, FeH5 crystallized in layered structure consists two-dimensional atomic hydrogen slabs. LaH10 hasthree-dimensional clathrate structure in which La atoms surrounded by hydrogen cage. H3S has body-centered cubic structure which can also be visualized as sulfur atom surrounded bythree-dimensional hydrogen cage. Nearest H–H distance in FeH5was reported to be 1.336 Å at 100 GPa31, whereas for LaH10 itwas 1.196 Å at 120 GPa32. LaH10 was claimed as a closestanalogue to solid atomic metallic hydrogen based on nearest H–Hdistance32. However, the pressure required to stabilize FeH5 andLaH10 phases was 130 and 170 GPa, respectively31,32. Synthesis ofsuperhydrides at lower pressures would give an opportunity tofurther investigate superconductivity in these hydrides with awide range of probes. Studies on the synthesis path and structureof superhydrides also help to build a deeper understanding ofhydride chemistry. Besides superconductivity, hydrides are alsovery important as hydrogen storage materials for next-generationenergy-related applications38. Recently, Peng et al.23 predictedthat hydrogen-rich CeH9 with P63/mmc structure becomes stableat a relatively low pressure of 100 GPa, which by itself is veryinteresting although their estimated superconducting Tc wasrelatively low, 56 K.We have carefully studied the Ce–H system in order tounderstand the crystal chemistry and to seek for superconductivity with, possibly, much higher Tc values. Here wereport the successful synthesis of cerium superhydride CeH9 at80-100 GPa with laser heating up to 2000 K. Using evolutionaryvariable-composition searches, the whole compositional space ofthe Ce–H system explored in a single simulation. We predictedphase stability and superconducting properties of high-pressurecerium superhydrides. Rich chemistry of cerium hydrides manifests itself in numerous stable compounds, including theexperimentally synthesized CeH3 and superhydrides CeH9. Wehave carried out a direct elemental reaction between cerium andhydrogen using a laser-heated DAC coupled with synchrotron Xray diffraction (XRD). It is found that heating plays an essentialrole in the formation of Ce–H phases at high pressures. Analysisof XRD results in combination with ab initio calculations showsthat CeH9 crystallizes in a clathrate structure with space groupP63/mmc at 80-100 GPa after laser heating. Each cerium atom isenclosed within a cage of H29 in which hydrogen atoms arebonded covalently. Besides this, a previously unknown Pm 3nstructured CeH3 (β-UH3 type39) was synthesized at 36 GPa withlaser heating. The detailed first-principles investigation of stability, structural, electronic, and superconducting properties ofexperimentally synthesized hydrogen-rich phase was carried out.We studied, specifically electron–phonon interaction of P63/mmcCeH9 and predicted that the CeH9 is a high temperature superconductor with Tc 105–117 K at 200 GPa.ResultsSynthesis of various Ce–H phases. In our experiment, variousphases of the Ce–H system such as CeHx (x 2, 2.5, 3, and 9)were synthesized successfully at high pressures. Initially, thecerium sample and hydrogen gas were loaded into the samplechamber of the DAC and were kept at 9 GPa. A small piece ofgold also was loaded along with sample to calibrate pressure. At 9GPa and ambient temperature, we found that cerium andhydrogen reacted, which resulted in the formation of a ceriumhydride compound as shown by the XRD pattern in Fig. 1a. Thecorresponding XRD image is shown in Supplementary Fig. 1a. Allthe peaks observed at 9 GPa could be indexed with the Fm 3mphase of CeH2 (see Supplementary Note 1). The Fm 3m phase ofCeH2 persisted up to 33 GPa (Supplementary Fig. 1b). Lebailrefinements were carried to extract lattice parameters of the CeH2NATURE COMMUNICATIONS (2019)10:4453 https://doi.org/10.1038/s41467-019-12326-y www.nature.com/naturecommunications
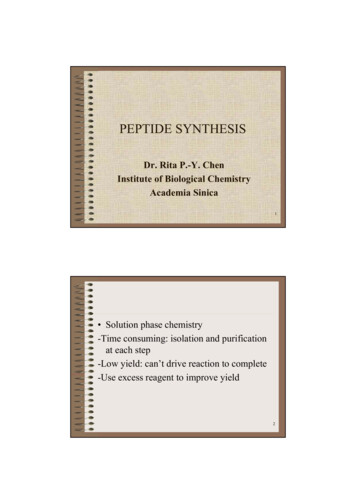
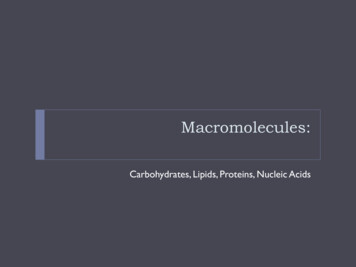
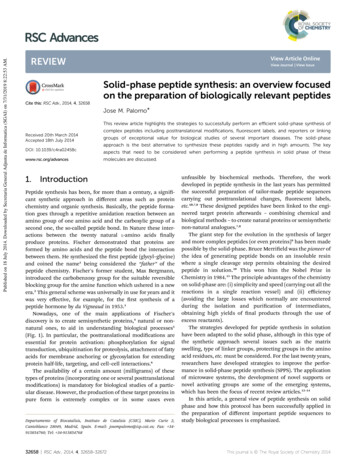
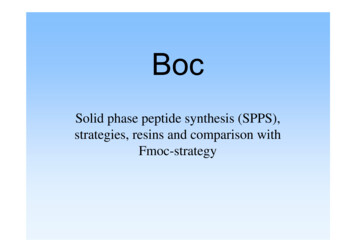
101002NATURE COMMUNICATIONS https://doi.org/10.1038/s41467-019-12326-ycλ 0.3344 Å104210 203211012#100 GPa202 004#b– -Pm3n-CeH3112Intensity (arbitrary units)200 103201 112110102100P63 /mmc -CeH946025 2341250440241242330048101214162241330240049 GPa222220311–Fm 3m-CeH2200a11122202300212336 GPa182θ ( )Fig. 1 Representative integrated XRD patterns of high-pressure phases inCe–H system up to 100 GPa. Typical XRD patterns of a CeH2, b CeH3, andc CeH9 obtained at 9, 36, and 100 GPa of pressure respectively. Verticallines indicate the indexing with calculated intensity for respective crystal Pm3n structure. CeH2, CeH3, and CeH9 crystallize in space group Fm3m,(β-UH3 type) and P63/mmc, respectively. Unidentified weak peaks in b andc are marked with black asterik and blue hash symbols, respectively. Theseadditional peaks could not be identified or indexed with any of the known orpredicted phases of Ce68 or CeHx23, as well as cerium oxides69,70phase (Supplementary Fig. 1c). The lattice parameters of CeH2 at9 and 33 GPa were determined as a 5.370(1) and a 5.011(2)Å respectively. Pressure dependence of the unit cell volume ofCeH2 was fitted with a third-order Birch–Murnaghan equation ofstate (EOS) which yielded the fitting parameters such as unit cellvolume at zero pressure V0 44(1) Å3 per f.u., bulk modulusK0 45(6) GPa and first pressure derivative of bulk modulusK0′ 4 (fixed) (Supplementary Fig. 1d). Pressurization of CeH2up to 33 GPa did not result in any changes in crystal structure.However, microsecond pulsed laser heating of 2000 K carried at33 GPa resulted in obvious structural changes (SupplementaryFig. 2a). The XRD pattern at 36 GPa obtained after laser heatingis shown in Fig. 1b, and the corresponding XRD image is shownin Supplementary Fig. 2b. The integrated XRD pattern at 36 GPawas found to be of cubic CeH3 with Pm 3n isomorphous to β-UH3ðβ Pm 3nÞ39. This high-pressure phase of CeH3 with β Pm 3nstructure has also been predicted in our evolutionary searchesto be the energetically favourable phase below 10 GPa and is32 meV/atom higher in enthalpy than the most favourable CeH3ARTICLEat the synthesized pressure of 36 GPa (Supplementary Fig. 3).However, inclusion of spin–orbit coupling (SOC) and magnetismchanges the enthalpy difference of CeH3 phases by some 0.09 eVper atom. While these calculations affect predicted phase stabilityrange, our experimental results confirm the existence of thepredicted phase. To the best of our knowledge, β-UH3 typePm 3n CeH3 is being reported for the first time here. Theexperimental lattice parameters of the β Pm 3n phase at 36 GPaare a 6.2788(3) Å. In β Pm 3n structure of CeH3, cerium atomsoccupy 2a (0, 0, 0) and 6c (1/4, 0, 1/2) Wyckoff positions39.Unfortunately, very low X-ray scattering factor of hydrogen atomdid not allow us to determine the exact position of hydrogenatoms in CeH3 unit cell from the experimental XRD data. Theoretical calculations yielded the Wyckoff position for the hydrogen atoms as 24 K (0, 0.1580, 0.6935) at 35 GPa with latticeparameter a 6.2471 Å, which is highly consistent with theexperimental value of β Pm 3n CeH3 observed at 36 GPa. Theβ Pm 3n phase of CeH3 proved stable with further compressionup to 80 GPa and also sustained laser heating at an intermediatepressure of 60 GPa (Supplementary Fig. 2a), which agrees withour predictions. A third-order Birch–Murnaghan EOS was usedto fit the P–V data of CeH3 (see Supplementary Fig. 2d), fittingparameters are V0 39.7(4) Å3 per f.u., K0 86(4) GPa andK0′ 4 (fixed).Several cycles of pulse laser heating with 1 µs pulse width at arepetition rate of 10 kHz for a total heating duration of a fewseconds each cycle was used to laser heat the sample assemblage toapproximately 1700 K at 80 GPa that resulted in the emergence ofnew peaks (Supplementary Fig. 4). These new diffraction peakswere indexed to be (101) and (002) of clathrate hexagonal phase ofCeH9 (Figs. 1c and 2, also see in Supplementary Fig. 4) as found byour evolutionary search. With further pressurization the relativeintensity of the (101) and (002) peaks of CeH9 phase increased(Supplementary Fig. 4). Although most of the peaks of CeH3 phasewere present, the intensity of the CeH9 peaks became prominentand increased with pressure (Supplementary Fig. 4). Several furthercycles of laser heating at 88 GPa (Supplementary Fig. 4) and 98 GPaimproved the intensity of the hexagonal CeH9 phase, as shown inFig. 1c. A Rietveld refinement plot for the CeH9 phase at 100 GPa isshown in Fig. 2a with the corresponding XRD image as an inset.CeH9 crystallizes in the P63/mmc space group with latticeparameters a 3.7110(3) and c 5.5429(7) Å at 100 GPa. Ceriumatoms occupy the Wyckoff position 2d (2/3, 1/3, 1/4) in a hexagonalunit cell. Theoretical calculations established positions of hydrogensto be 2b (0, 0, 1/4), 4f (1/3, 2/3, 0.1499), and 12k (0.1565, 0.8435,0.4404) at 100 GPa. The crystal structure of CeH9 is shown inFig. 2b. The experimentally observed P63/mmc CeH9 phase and itsstructural parameters are perfectly consistent with our calculations.Calculated EOS parameters for CeH9 phase are V0 53.4(2) Å3 perf.u., K0 80.5(13) GPa and K0′ 4 (fixed). Synthesis of the P63/mmc-CeH9 phase has been confirmed in two independentexperimental runs.During the decompression cycle, the CeH9 phase was observed tostart to become unstable at pressures below 93 GPa and ambienttemperature (supplementary Fig. 5). Laser heating was also carriedout during the decompression cycle at 79 and 54 GPa. Laser heatingin decompression cycle did not result in any changes in XRDpattern. Upon further decompression, the β Pm 3n CeH3 phasereappeared below 50 GPa (supplementary Fig. 5). Finally, aftercomplete decompression, the β Pm 3n CeH3 phase was recoveredat ambient conditions along with tetragonal Ce2H5 (SupplementaryFig. 5). The P-T path for the formation and stability of variousCe–H phases, observed in our experiments, can be seen in Fig. 3. Allthese findings are repeatable as demonstrated in a separate run ofexperiment (see Supplementary Note 2 and Supplementary Fig. 6).NATURE COMMUNICATIONS (2019)10:4453 https://doi.org/10.1038/s41467-019-12326-y www.nature.com/naturecommunications3
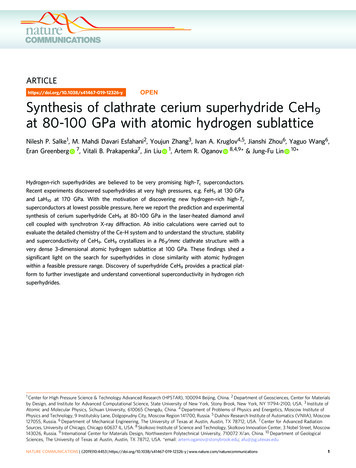
ARTICLENATURE COMMUNICATIONS https://doi.org/10.1038/s41467-019-12326-yabλ 0.3344 Å18016014012080604020Azimuth ( )Intensity (arbitrary units)100a 3.7110(3) Åc 5.5429(7) 18024681012141618202224262830322θ ( )P63 /mmc structure of CeH9 at 100 GPacb#a#Cerium68101214Hydrogen162θ ( )Fig. 2 XRD pattern and the result of Rietveld refinement for the hexagonal CeH9 in P63/mmc structure. a Rietveld refinement plot of powder XRD data at100 GPa. Red open circles: experimental data of CeH9 in P63/mmc structure at 100 GPa; black line: simulated XRD based on the structural model; greenvertical lines: Bragg diffraction positions of the structure; blue line: the difference between the simulated and the original XRD. Reliability parameters for theRietveld refinement are as follows (in %): Rp 14.5, Rwp 18.4, RBragg 8.05. Blue hash symbols represent unidentified weak peaks. Inset shows thePilatus XRD image of corresponding powder XRD pattern with the incident X-ray wavelength of 0.3344 Å. b Crystal structure model of P63/mmc structuredCeH9. Red and black spheres represent cerium and hydrogen atoms, respectively80 to 100 0 GPa&1400–1700 K33 to 80GPacbba– -Pm3n-CeH333 GPa&2000 KAt 9 GPacaabccCerium–Fm3m-CeH2Hydrogenbdab– -Pm3n-CeH3I41md-Ce2H5Recovered at ambient conditionsFig. 3 Pressure temperature path for the synthesis and stability of variousCe–H phases. a Starting at 9 GPa, cerium reacts with hydrogen to form Fm3m CeH2 , which remained stable up to 33 GPa. b At 33 GPa with laser heating, Fm3m CeH2 in H2 medium reacted to form β Pm3n CeH3 . β Pm3n CeH3 remained stable up to 80 GPa. c Laser heating of β Pm3n CeH3 in H2 medium at 80-100 GPa resulted in the occurrence ofthe P63/mmc-CeH9 superhydride. The superhydride phase was found to bestable up to the maximum pressure reached in our studies i.e. 100 GPa. d After complete decompression, β Pm3n CeH3 and I41 md Ce2 H5 wererecovered at ambient conditionsTheoretical calculations and prediction of cerium hydrides.First-principles calculations were carried out to understand thedetailed chemistry of the Ce–H system, dynamical stability, andstructural and electronic band structures of experimentally synthesized superhydride phases. We performed variablecomposition evolutionary searches at 0, 50, 100, 150, 200, and250 GPa. The thermodynamic convex hull at different pressures isdepicted in Fig. 4. The predicted stable cerium hydrides areshown in the pressure–composition phase diagram in Fig. 5.Several compounds such as I4/mmm-CeH4, P63mc-CeH6, P63mcCeH8, P63/mmc-CeH9. and Fm 3m CeH10 , were predicted, inaddition to finding three known compounds CeH2, Ce2H5, andCeH3. High-pressure phase of the CeH3 was also predicted with4space group Pm 3n, as shown in Fig. 5. Because of high concentration of hydrogen in hydrogen-rich hydrides, zero-pointenergy (ZPE) might be important in determining the relativestability of hydrogen-rich phases; however, in our previous studies22,40, we showed that this quantum effect does not change thetopology of the phase diagram, and quantitative effects are justmoderate shifts in transition pressures. For example, for GeH4 theinclusion of ZPE shifts the transition pressure Ama2 C2/mfrom 300 to 278 GPa40. Among the stable phases predicted, wehave synthesized Fm 3m CeH2 , I41 md Ce2 H5 β Pm 3n CeH3 ,and P63 mmc CeH9 . Our pressure–composition phase diagramshows pressure ranges of stability for all the predicted phasesalong with experimentally known compounds. It clearly showsthat higher pressures favour higher hydrogen content compounds, which is consistent with our experiment done at differentpressure conditions. Previously known compounds Fm 3m CeH2and I41 md Ce2 H5 are predicted to be stable only below 8 and1.5 GPa, respectively. Increase of pressure leads to the formationof I4/mmm-CeH4 above 32 GPa. CeH6 and CeH8 are stable inrelatively narrow pressure ranges from 26 to 68 GPa, and 55 to 95GPa, respectively and that is probably why they are not observedin our experiment. P63/mmc-CeH9 becomes stable at pressuresabove 78 GPa, which agrees with our high-pressure experimentswhere it was synthesized at 80-100 GPa after laser heating.Detailed structural information on the predicted phases can befound in Supplementary Table 1. Among the predicted stablecerium hydrides, we focus on modelling of hydrogen-rich CeH9,since a higher hydrogen to metal ratio in hydrides is expected tocorrelate with higher Tc superconductivity in hydrogen-richhydrides11.DiscussionAddition of hydrogen in metallic sublattice expands the unit cellvolume. In most cases, an increase in volume is proportional tohydrogen content in hydride. In hydrides, expansion of the cellvolume with respect to pure metal volume was frequently used toestablish the hydrogen content and stoichiometry32. In order toascertain the stoichiometry of high pressure superhydride phaseobserved at 80-100 GPa after laser heating, we have compared theideal mixture of Ce–H2 solution with experimental volume performula unit of CeH3, CeH9, and with theoretical EOS (seeFig. 6a). The curve representing ideal mixture of Ce and (7/2) H2lies well below the theoretical and experimental EOS of P63/mmcCeH9 in the pressure range 80–100 GPa, whereas mixture of Ceand (8/2) H2 partially overlaps with theoretical and experimentalNATURE COMMUNICATIONS (2019)10:4453 https://doi.org/10.1038/s41467-019-12326-y www.nature.com/naturecommunications
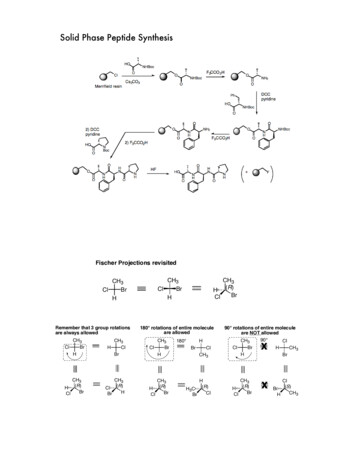
ARTICLENATURE COMMUNICATIONS 100 GPa–0.1P63/mmc-CeH9–0.2P63mc-CeH8–0.1ΔΗ (eV/atom)ΔΗ (eV/atom)50 mm-CeH40.00.20.40.6H/(Ce H) ratio0.8–0.61.0c0.00.40.6H/(Ce H) ratio0.81.0d0.00.0150 GPa–0.1200 GPa–0.1–0.2ΔΗ (eV/atom)ΔΗ /(Ce H) ratio0.80.01.00.20.40.6H/(Ce H) ratio0.8P63/mmc-CeH9P63mc-CeH8P63 /mmc-CeH9–0.4Fm-3m-CeH10–0.21.0Fig. 4 Convex hull diagram of Ce–H system. Predicted formation enthalpy of Ce1 x Hx as a function of H concentration at selected pressures. Open circlesabove the convex hull show unstable compounds with respect to decomposition into the two adjacent phases on the convex hull, while solid circles showthermodynamically stable compoundsEOS of CeH9. This indicates that the hexagonal phase observed at80-100 GPa after laser heating does not favour energetically CeHXwith x 8 and can decompose into its elemental constituents orhydride with x 8 and hydrogen. On the other hand, the curverepresenting an ideal mixture of Ce and (9/2) H2 lies well abovethe theoretical and experimental EOS of CeH9 in the pressurerange 80–100 GPa. This observation clearly indicated that CeH9can be stabilized in the pressure range mentioned. From ourtheoretical calculations and energetic considerations, it clearlysignifies that the hexagonal phase observed at 80-100 GPa withlaser heating has the CeH9 stoichiometry. We can also see thatthere is a fair agreement between experimental volume and theoretical EOS results (Fig. 6a) for P63 mmc CeH9 as well asβ Pm 3n CeH3 .In hydrides, hydrogen is pre-compressed by interaction withmetal atoms. Hydrogen sublattice in hydrides might be expectedto be identical with atomic metallic hydrogen. So, we comparedthe volume expansion (ΔVH) per hydrogen atom and nearestH–H distance in CeH9 with simulated atomic metallic hydrogenphase extrapolated to lower pressure31 and also with otherreported hydrides as shown in Fig. 6b, c, respectively31,32,41,42.The nearest Ce–H distance in P63 mmc CeH9 is plotted inFig. 6d. The inset of Fig. 6d shows the Ce–H29 clathrate cagestructure in which the H29 cage is encapsulating a cerium atom.ΔVH per H atom for CeH9 is 2.09 Å3 at 100 GPa, which is lowerthan that for a hydrogen atom, but larger by 8% with respect toΔVH per H atom of layered FeH5. ΔVH per H atom for CeH9matches with volume of atomic metallic hydrogen around 100GPa. Formation of CeH9 can also be understood in terms ofP63 mcI4/mmm––Pm3n- -UH3 type Pressure (GPa)200250Fig. 5 Pressure–composition phase diagram of theoretically predictedstable phases in the Ce–H system at high pressures. Red horizontal barsshow the range of stability of each phase; this phase diagram was createdon the basis of the evolutionary structure prediction method USPEX. Theexperimentally discovered P63/mmc-CeH9 is predicted to be stable from 78GPa up to at least 250 GPa.mixing of Ce and dense atomic metallic hydrogen. This indicatesthat hydrogen framework surrounding Ce atom is identical todense atomic metallic hydrogen at a lower pressure. Nearest H–Hdistance in clathrate CeH9 is 1.116 Å at 100 GPa, which isNATURE COMMUNICATIONS (2019)10:4453 https://doi.org/10.1038/s41467-019-12326-y www.nature.com/naturecommunications5
ARTICLENATURE COMMUNICATIONS e 9/2H2Ce 7/2H2CeH930CeH320theorytheo3ΔVH per H atom (Å )3Volume per formula unit (Å )Ce 0FeH51.8CeH3101.6507525Pressure (GPa)100cAtomic H100150Pressure aH101.22.24Nearest Ce-H distance (Å)Nearest H-H distance (Å)3.22.202.122.08CeH92.041.0Atomic H2.0050100150Pressure (GPa)200b2.161.10a100120140Pressure (GPa)160Fig. 6 Effect of hydrogen on unit cell volume and nearest neighbour distances in various hydrides at different pressures. a Experimentally obtained volumeper formula unit for CeH3 and CeH9 plotted as a function of pressure. Blue open squares and red solid tringles represent experimental data for CeH3 andCeH9 respectively. Errors in the fitting are also plotted. Theoretical EOS of CeH3 and CeH9 is plotted as blue and red lines, respectively. Black dashed linerepresents EOS of cerium metal68. Red, purple and green dashed curves represent ideal mixtures of Ce (9/2)H2, Ce (8/2)H2, and Ce (7/2)H2,respectively68,71. b Volume expansion (ΔVH) per hydrogen atom plotted against pressure for CeH9, FeH531, H3S14, LaH1032, H71, and atomic H31 forcomparison. Dark yellow, purple, black, and orange open triangle symbol-line represents H3S, LaH10, atomic H, and FeH5, respectively. Red solid trianglesymbols represent CeH9. Black solid line represents hydrogen. c Comparison of the pressure dependence of the nearest H–H distances for CeH9, FeH341,FeH531, AlH342, H3S14, LaH1032, and atomic H31. Magenta, blue, dark yellow, orange, purple, and black open triangle symbol line represents FeH3, AlH3, H3S,FeH5, LaH10, and atomic H, respectively. Red solid triangle symbol line represents CeH9. d Nearest Ce–H distance for CeH9 as a function of pressure. Insetshows CeH29 clathrate cage in P63/mmc structure. [Pressure-dependent experimental data is at 300 K, whereas theoretical data is at 0 K]significantly longer than the H–H bond length (0.74 Å) in H2 gasmolecules but is significantly lower than other hydrides such asAlH3, FeH3, FeH5, H3S, and LaH10 as can be seen in Fig. 6c.Surprisingly, the nearest H–H distance in CeH9 almost overlapswith the H–H distance in atomic hydrogen and decreases veryslowly with pressure. Among all the superhydrides, the nearestH–H distance observed in CeH9 is among the shortest at 100GPa and coincides with H–H distance of atomic metallichydrogen. Among the reported hydrides, nearest H–H distance ofCeH9 is only second to the H–H distance (0.98 Å)23 for atomicmetallic hydrogen at 500 GPa at which hydrogen is in a superconducting metallic state43. Judging from the H–H distances,CeH9 is closer to monatomic metallic hydrogen than otherhydrides, yet its predicted Tc is not as high as that of hydrogen orof LaH10. The shortest H-H distance is not the only thing that6matters for high Tc; the electronic structure of the metalatom plays a crucial role, as shown by Semenok et al.29. In Fig. 6c,we can also see that non-superconducting FeH5 has shorter H–Hdistance than H3S compound well known for very high Tc. Presence of strongly coupled hydrogen-dominant libration andstretch vibrations are the signatures of high-Tc in hydrogen-richmaterials44. Weak H–H interactions with preferred bond distances between 1.2 and 1.3 Å, the stretching and bending vibrations becomes indistinguishable, due to which all H vibrationscontribute in the strong electron–phonon coupling process,eventually contributing to enhance the Tc in hydrides44. At100 GPa the nearest Ce–H distance is 2.07 Å and it decreaseswith pressure. It is noteworthy that the clathrate structures predicted in the literature for rare earth (RE) hydrides REH6, REH9,and REH10 have H24, H29, and H30 cages surrounding the RENATURE COMMUNICATIONS (2019)10:4453 https://doi.org/10.1038/s41467-019-12326-y www.nature.com/naturecommunications
ARTICLENAT
CeH 9and predicted that the CeH is a high temperature super-conductor with T c 105-117K at 200GPa. Results Synthesis of various Ce-H phases. In our experiment, various phases of the Ce-H system such as CeH x (x 2, 2.5, 3, and 9) were synthesized successfully at high pressures. Initially, the cerium sample and hydrogen gas were loaded .