Transcription
Monthly Mutual Fund Field GuideTalking Points for Client ConversationsJuly 2022Did You Know?The Current State of SPACsSpecial purposeacquisition companies(SPACs) gained newfoundfame among investors in2020, but how has theSPAC market fared since,and what has that meantfor SPAC investors?AcademicPerspectiveMarket Nosedives andConsumer MisstepsBy Prof. Hal HershfieldWhen we react to marketdownturns by selling riskyassets, are we acting inour long-term bestinterest? It may be that weare pacifying our anxietyby giving ourselves asense of control.Market Review Despite still-highinflation and weakereconomic data, broadstock indices, led by theU.S., rebounded.Portfolio Updates Portfolio characteristicsand compositionAppendix Standardizedperformance Glossary Disclosures The Fed hiked ratesanother 75 bps asinflation rose to 9.1%. Recession fears pushedTreasury yields lower,and bonds postedwidespread gains.This information is not authorized for distribution unless preceded or accompanied by a current prospectus or summary prospectus.Please visit Avantis Investors for more information.
Did You Know?2
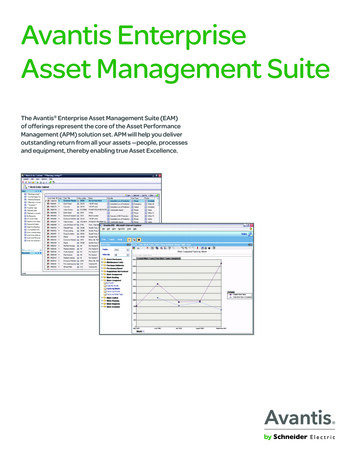
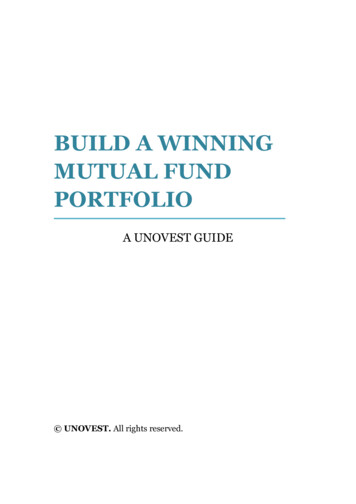
The Current State of SPACsAs SPAC IPOs began to rise in 2020 amid the broader demand for publiccapital and the eye-catching headlines of SPACs merging with flashystartups like flying taxi services, investor interest soared as well. Butlooking at the SPAC market today provides a sobering reminder of whywe think investors should approach investment fads with caution.The number of new SPAC IPOs and the amount of capital they raised setrecords in 2020 and 2021.1 SPAC IPOs peaked in the first quarter of2021 with nearly 100 billion in raised capital from around 300 IPOs.Since then, we’ve seen the pace drop off significantly. SPAC IPOs over thefirst two quarters of 2022 raised just over 12 billion.Figure 1 SPAC IPO Proceeds Have Trended Downward Since Early 202198.6100IPO Proceeds ( B)Back in 2020, special purpose acquisition companies, known as SPACsand sometimes referred to as blank-check companies, gained newfoundfame among investors. SPACs are investment vehicles that undergo aninitial public offering (IPO) to raise capital for the purpose of lateridentifying a private company and forming a merger agreement to takethe company public.SPAC IPOs peaked inthe first quarter of Q4Q1Q2Q3Q4Q1Q22020 2020 2020 2020 2021 2021 2021 2021 2022 2022An investment in SPACs presents different risks depending on what point in the SPAC life cycle shares are purchased including the risk that the acquisition may not occuror that the customer's investment may decline in value even if the acquisition is completed. Investors who purchase in the secondary market after an acquisitionannouncement may suffer a loss if the value of the shares subsequently declines. There is also the risk that SPAC managers are inexperienced or unqualified and this riskcan be made more pronounced by lack of any operating history or past performance of the SPAC.Source: Bloomberg Finance L.P., Global IPO Watch Q21 2022 Overview,” PwC Global.3
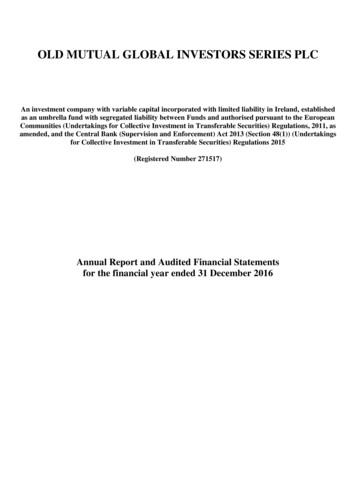
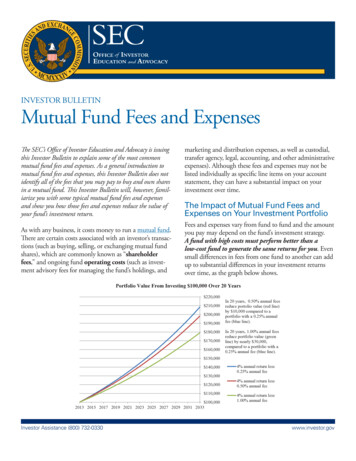
The Current State of SPACsAs SPAC and traditional IPO proceeds are down in 2022, a more tellinginsight may come from the shifting balance between them. SPACs madeup well over half of the assets raised through all IPOs in the first quarterof 2021, but traditional IPOs outpaced SPACs in each remaining quarterof the year.2As of the end of July, nearly 600 SPACs were searching for mergertargets, and more than 100 had announced mergers that have not yetbeen completed. The total capital raised by SPACs still seeking a mergeris currently more than 140 billion, with over 30 billion facing deadlinesin 2022.3While SPACs have managed more proceeds than traditional IPOs so far in2022, though at far lower levels than the prior two years, it seems clearthat SPACs have not replaced IPOs as a preferred method for companiesto go public.We’ve already seen high-profile SPACs with well-known sponsors like BillAckman’s Pershing Square Tontine Holdings announce plans to liquidatethis year. To date, the six liquidations from SPACs that went public in2020 are the most for any year since 2010.We don’t know the cause of this decline in SPAC activity, but a fewpotential drivers have been documented. First, the U.S. Securities andExchange Commission (SEC) announced in late 2021 that tighterregulations were likely forthcoming and proposed new rules for SPACs inMarch 2022. If finalized, these new guidelines would appear to reducesome of the differing requirements between SPAC merger IPOs andtraditional IPOs.Figure 2 Many SPACs Are Facing Deadlines to Complete MergersSPAC Activity by IPO Year2020458Another potential driver has been SPAC IPO shareholders’ highredemption rate at the time of mergers, which reduces the capitalavailable to the SPAC for completing a merger.Another interesting finding emerges when we look at SPACs that havegone public over the past few years. Many SPAC sponsors have been leftsearching for target companies. A key feature of SPACs is an 18- to 24month deadline to identify and sign an acquisition agreement with atarget company. If the SPAC sponsor fails to complete a merger by thedeadline, the SPAC must liquidate and return the cash and accruedinterest to shareholders.20212022154597867Searching quidatedData as of 07/31/2022. Source: SPACInsider.4
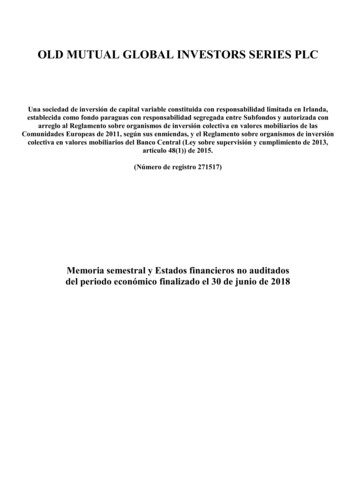
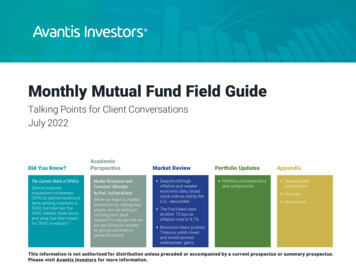
The Current State of SPACsAs SPAC sponsors compete for merger targets during heightened marketuncertainty, SPAC IPO shareholders risk not finding a target company.While SPACs are set up to offer investors protection from losses in theevent of a SPAC liquidation, earning back the initial cash plus interest iseffectively a fixed-income investment and may not align with the goalsinvestors had in mind when they purchased the holding.Figure 3 Post-Merger SPACs Have Underperformed Traditional IPOs andthe Broader Stock MarketAverage One-Year Returns After SPAC Mergers Completed 2010-2020Average Return:SPAC MergersAverage Excess ReturnOver Traditional IPOsAverage Excess ReturnOver US StocksUniversity of Florida and University of South Carolina researchers lookedat SPACs that launched between 2010 and 2020, finding that liquidationsresulted in an average annual return to SPAC shareholders of just 2%.4For those that invest in companies resulting from SPAC mergers,potentially aiming to “get in on the ground floor” of a new publiccompany, the returns have also likely disappointed. Minmo Gahng and hisco-authors found the equal-weighted one-year returns for post-mergerSPAC companies that merged between 2010 and 2020 were negative andfar lower than those of traditional IPOs and the broader U.S. stockmarket.-11.30%It’s worth noting that SPAC IPO investors may receive both shares andwarrants (a right to buy shares of the post-merger company at a specifiedprice). On average, these warrants have earned positive returns aftercompleted mergers. But Gahng, et al., estimate the benefits of thesewarrants are insufficient in overcoming the meaningful losses on postmerger common shares.Source: Minmo Gahng, Jay R. Ritter, and Donghang Zhang, “SPACs” (July 2022). U.S. stocks are represented by CRSP Value-Weighted Index, a valueweighted portfolio built each calendar period using all issues listed on the selected exchanges with available shares outstanding and valid prices in thecurrent and previous periods, excluding American Depositary Receipts. Returns of U.S. stocks are matched to the SPAC Mergers investment periods.Returns through December 31, 2021. Past performance is no guarantee of future results.-25.30%-30.70%5
The Current State of SPACsThe SPAC market’s rise and the bumps in the road that have followedremind us that investment fads come and often go. There’s still much tobe seen regarding how the SPAC market will evolve with pendingregulation or how investors in SPAC IPOs and post-merger SPACcompanies will fare going forward.We believe it remains prudent for investors to maintain commonsenseinvestment principles. Investors that consider SPACs are likely wellserved to understand the terms of each opportunity, the rights ofinvestors and sponsor incentives. Even if all these boxes can be checked,it remains an investment in a single company, so the outcome dependsalmost entirely on the company’s ability to succeed.Diversification is one of the most basic principles of investing, and itsbenefits are always worth remembering. Over the long term, marketreturns have historically demonstrated that diversified investors havebeen rewarded.Endnotes1Preston Brewer, “Analysis: IPOs Fall to Earth; a Requiem for SPACs?” Bloomberg Law, July 8, 2022.2Brewer, “Analysis: IPOs Fall to Earth.”3Stuart Newman, Nadja Picard, and Michael Wisson, “Global IPO Watch: Q2 2022 Overview,” PwCGlobal, June 22, 2022.4Minmo Gahng, Jay R. Ritter, and Donghang Zhang, “SPACs,” July 15, 2022. Available at SSRN.Past performance is no guarantee of future results.6
Academic Perspective7
Market Nosedives and Consumer MisstepsI probably don’t need to spend time painting a vivid macroeconomic picture unless you’verecently been doing your best impression of an ostrich. So, let me briefly spell it out: Notsince Richard Nixon was in the Oval Office have we had a year in which the stock markethad a worse six-month start.1If you’re not up on your presidential chronology, that’s more than 50 years ago. At the timeof this writing, the S&P 500 Index is down about 20% since the start of the year. And asimilar story can be told for other major indices, with the NASDAQ shedding approximately30% and the Dow Jones dropping about 15%.Hal Hershfield, Ph.D.Consultant to Avantis InvestorsTo top things off, it’s not just the markets that have been a little scary. Between ever-risinginflation, a virus that doesn’t seem to want to quit, and continued sociopolitical upheavalworldwide, some (or a lot?) of anxiety is warranted. Yet that anxiety, while normal, can be thesource of painful investment missteps.Hal is a Professor of Marketing andBehavioral Decision Making in theAnderson School of Management at theUniversity of California, Los Angeles and aconsultant to Avantis Investors.To illustrate, let me share a relevant conversation between a financial advisor and ajournalist regarding a recent market crash. It’s an exchange that Gary Belsky and TomGilovich highlighted in their accessible and informative book, Why Smart People Make BigMoney Mistakes and How to Correct Them:2His research asks, “How can we helpmove people from who they are now towho they’ll be in the future in a way thatmaximizes well-being?”Bill: Wrong. 158. Guess how many of them told me to sell some or allof their stocks?Gary: I don’t know, half?Bill: Wrong, 156. Guess how old the other two are?Gary: Huh?Bill: Both of those clients are older than 80. Both told me to buy.You know why? Because they’ve seen this before.““Bill (the advisor): I have 180 clients; guess how many have called meover the last two days?Gary (the journalist): I don’t know, 100?8
Market Nosedives and Consumer MisstepsEven though it sounds like a conversation that could have taken place inthe past few weeks, it occurred in October 1987, two days after BlackMonday. If you weren’t alive then or have forgotten, global markets tookan unexpected nosedive, losing more than 20% of their value in a singleday.There can be times when it makes sense to act like most of Bill’s clients,adjusting our portfolios in response to market downturns. If we have ashorter investment horizon, then selling might be appropriate. (Of course,if we are operating on a short timeline, we probably shouldn’t be in riskyasset classes to start.)But in other cases – like when we hold longer-term investment horizons –selling off our investments might mean we’ll end up hindering our longterm success. If, for instance, you sold investments in the fall of 2008 orMarch of 2020 and failed to get back in the market, you would havemissed out on some of the biggest stock market gains in history.Why do we so often react in this way? Why do we get overly antsy, pullingour money out when we might be better off staying put, and what can wedo about it? I could have written this article at least five other times inrecent memory, but once the markets cycle out of loss territory into thecontext of gains, it can be easy to forget the lessons of past crashes. So,let’s cover two major lessons while the volatility is fresh.AvailabilityMy colleague Craig Fox, who teaches the managerial decision-makingclass at UCLA, is fond of asking his students this question: What’s morecommon – blue cars or orange cars? If you answered “blue,” you’d beright. You didn’t need to consult DMV records or rely on a fancy algorithm.You answered off the top of your head, relying on a mental shortcutknown as the availability heuristic. The gist is that it’s easier to rememberhaving seen blue cars, so we correctly conclude that blue cars are morecommon.Trouble arises, however, when we rely on biased or faulty memories intrying to make predictions about future states of the world. That’s whenthe availability heuristic turns into an availability bias. Applied in thecontext of investing, when markets seem to be in a freefall, it can be easyto assume they will continue to travel that path for months or years tocome. And indeed, markets may continue to trend downward for quitesome time. But if we hold a long investment horizon, history suggeststhat market performance will eventually trend upward.Past performance is no guarantee of future results.9
Market Nosedives and Consumer MisstepsTwo solutions are readily apparent here. First, let’s redefine “recent.” Sure, things will appear to have been extravolatile and perhaps scary if we pay attention to returns of the last sixmonths. But if we can zoom further out – perhaps considerably so – itmay be easy to see how downturns aren’t forever. Painful as recentlosses have been, let me remind you that the markets skyrocketed in2021, and their current value is still higher than their pre-pandemic S&P500 levels of early 2020.3 Second, if you hold a long-term investment goal and know you’d bebetter off not making major adjustments – or if you’ve already madesome – then it may make sense to dial back your news consumption.Reading regular coverage of market volatility is like adding oxygen tothe burning fire. But shying away from this coverage may lessen theprominence of recent market events in our mind’s eye, leading us torely on them a little less when making important decisions about ournext investing steps.Protection for Whom?In a previous column, I touched on the relationships we have with ourfuture selves, noting that we often feel a disconnect between who we arenow and the people we will be in the years to come. Consider it this way:Our future selves may at times seem like different people altogether,almost as if they are strangers to us.So, let me ask you: When we react to market downturns by selling riskyassets, in whose best interest are we acting? I suspect the easy, knee-jerkresponse to this question is something like “Me in the future!”“After all,” you might tell me, “If things continue to go south, wouldn’t I bewise to play it safe?”If things continued to go south from now until you retired, then yes, itwould probably make sense to play it safe. But that’s a mighty big “if.”My argument is that reacting suddenly to volatility might be a case inwhich we think we are doing something for ourselves in the long run.In reality, though, the chief function of taking immediate action may beto give ourselves a sense of control – pacifying our current anxietyabout the prospect of losing more money now.By way of solutions, let me offer two more. First, before reacting, think carefully about your future self. Who arethey? And how will they feel if you’ve stayed in the market? How willthey feel if you’ve gotten out? Second, if you’re unsure of what the best course of action may be,consider consulting an outside party, like an advisor. An independent,objective voice can allow the opportunity to voice your concerns, getfeedback, and perhaps hear an alternate perspective.Endnotes1 Hamza Shabanand Aaron Gregg, “Stocks slide, with Wall Street closing out its worst first half since1970,” The Washington Post, June 30, 2022.2 GaryBelsky and Thomas Gilovich, Why Some People Make Big Money Mistakes — And How to CorrectThem (New York: Simon and Schuster, 1999), 61.3 Data asof 6/30/2022. Source: FactSet.10
Market Review11
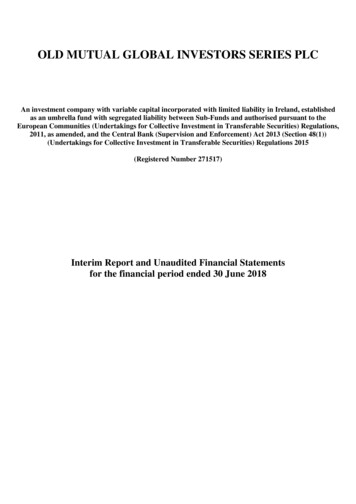
As of 7/31/2022Global Yield CurvesU.S. Treasury Yield Curve Over TimeCountry/Region Yield Curves as of Latest Month4.04.03.06/30/20223.07/31/20222.012/31/2021 .U.3M5Y10Y20Y30YAAA U.S. Municipal Yield Curve Over TimeA-Rated U.S. Corporate Credit Yield Curve Over a as of 7/31/202210Y20Y30Y0.03M5Y10Y20Y30YSource: Bloomberg.Yield is a rate of return for bonds and other fixed-income securities. A yield curve is a line graph that shows yields of fixed-income securitiesfrom a single sector (e.g., Treasuries) over various maturities (e.g., five and 10 years) at a single point in time (e.g., 12/31/2020).12
Portfolio Updates13
As of 7/31/2022Performance Overview Equity FundsReturns as of Month-End (%)SINCEINCEPTIONINCEPTIONDATEFUND AND BENCHMARK1 MOQTDYTD1 YRAvantis U.S. Equity - Inst9.039.03-11.54-5.1913.25Russell 3000 Index9.389.38-13.70-7.3512.29Avantis U.S. Small Cap Value - Inst10.9310.93-4.134.3618.22Russell 2000 Value Index9.689.68-9.30-4.779.41Avantis International Equity - Inst4.874.87-14.27-13.283.25MSCI World ex USA IMI Index5.255.25-15.32-14.102.55Avantis International Small Cap Value - Inst6.136.13-11.39-10.815.07MSCI World ex U.S. Small Cap Index6.836.83-18.67-18.992.35Avantis Emerging Markets - Inst0.000.00-17.71-19.342.77MSCI Emerging Markets IMI Index0.130.13-17.83-19.771.65Data as of 7/31/2022. Performance in USD, net of fees. Periods greater than one year have been annualized. Source: 019AVUSXU.S. Equity Inst.0.15Expense Ratio (%)345.44Total Assets ( M)AVUVXU.S. Small Cap Value Inst.Expense Ratio (%)0.25380.43Total Assets ( M)AVDEXInternational Equity Inst.Expense Ratio (%)0.23Total Assets ( M)120.74AVDVXInternational Small Cap Value Inst.Expense Ratio (%)0.36156.31Total Assets ( M)Emerging Markets Inst.AVEEXExpense Ratio (%)0.33236.12Total Assets ( M)Expense ratio as of the most recent prospectus. Assets as of7/31/2022.For standardized quarterly performance, please see Appendix. Performance data quoted represents past performance and is no guarantee of future results. Extraordinaryperformance is attributable in part due to unusually favorable market conditions and may not be repeated or consistently achieved in the future. Current performance may be loweror higher than the performance data quoted. Investment return and principal value will fluctuate so that an investor's shares, when redeemed, may be worth more or less than theoriginal cost. Returns less than one year are not annualized. Index performance does not represent the fund's performance. It is not possible to invest directly in an index.14
As of 7/31/2022U.S. Equity Portfolio CompositionKey CharacteristicsSector Allocation (%)Benchmark: Russell 3000 IndexFUNDBENCHMARK 349.3 B 480.5 BWeighted Average Book/Market0.23Weighted Average Profits/Book0.56Number of Holdings2,089Weighted Average Market CapFUNDBENCHMARKInformation alth Care12.9214.182,998Consumer .174.48Communication Services6.287.69Consumer eal Estate0.223.63Data as of 7/31/2022. Source: FactSet.Size and Style Allocation (%)FUNDBOOK-TO-MARKET AND EMIDBOOK-TO-MARKET AND D10.8515.256.131.822.681.01SMALL/MICROData as of 7/31/2022. Source: FactSet.Data as of 7/31/2022. Charts show weights in various book/market and profitability buckets(highest 25%, middle 50%, and lowest 25%) across market capitalizations. Excludes REITs.Source: FactSet.15
As of 7/31/2022U.S. Small Cap Value Portfolio CompositionKey CharacteristicsSector Allocation (%)Benchmark: Russell 2000 Value IndexFUNDBENCHMARKWeighted Average Market CapFUNDBENCHMARK 2.9 B 2.4 BFinancials28.4928.31Weighted Average Book/Market0.620.52Industrials17.2213.05Weighted Average Profits/Book0.420.13Consumer Discretionary15.789.85Number of alth Care5.3111.07Information Technology5.016.21Consumer Staples2.792.69Data as of 7/31/2022. Source: FactSet.Size and Style Allocation (%)FUNDBOOK-TO-MARKET AND n Services1.573.18Real Estate0.8111.55Utilities0.175.09Data as of 7/31/2022. Source: FactSet.BOOK-TO-MARKET AND SMALL/MICRO9.6637.8428.23MEGASIZEMIDData as of 7/31/2022. Charts show weights in various book/market and profitability buckets(highest 25%, middle 50%, and lowest 25%) across market capitalizations. Excludes REITs.Source: FactSet.16
As of 7/31/2022International Equity Portfolio CompositionKey CharacteristicsSector Allocation (%)Benchmark: MSCI World ex USA IMI IndexFUNDBENCHMARK 44.4 B 62.0 BWeighted Average Book/Market0.590.46Weighted Average Profits/Book0.340.32Number of Holdings3,0063,466Weighted Average Market CapData as of 7/31/2022. Source: FactSet.Size and Style Allocation (%)FUNDBOOK-TO-MARKET AND EMIDBOOK-TO-MARKET AND Consumer Discretionary10.1210.71Health Care8.6011.12FinancialsEnergy8.096.06Consumer Staples7.249.60Information Technology6.738.13Communication Services5.084.51Utilities4.213.58Real Estate2.334.03FUNDBENCHMARKJapan20.7320.89United tzerland8.668.51Data as of 7/31/2022. Source: FactSet.Top 5 Country Allocations (%)Data as of 7/31/2022. Source: FactSet.Data as of 7/31/2022. Charts show weights in various book/market and profitability buckets(highest 25%, middle 50%, and lowest 25%) across market capitalizations. Excludes REITs.Source: FactSet.17
As of 7/31/2022International Small Cap Value Portfolio CompositionKey CharacteristicsSector Allocation (%)Benchmark: MSCI World ex U.S. Small Cap IndexFUNDBENCHMARK 2.2 B 2.6 BWeighted Average Book/Market0.920.60Financials19.4810.74Weighte Average Profits/Book0.350.24Materials17.0510.82Number of Holdings1,1232,576Consumer Discretionary12.9211.16Energy10.864.57Weighted Average Market CapData as of 7/31/2022. Source: FactSet.Size and Style Allocation (%)FUNDBOOK-TO-MARKET AND NDBENCHMARK21.5121.51Consumer Staples4.616.02Information Technology3.839.07Real Estate3.3911.93Communication Services2.453.92Health Care2.176.52Utilities1.733.74FUNDBENCHMARKData as of 7/31/2022. Source: FactSet.Top 5 Country Allocations (%)BENCHMARKBOOK-TO-MARKET AND HJapan26.2926.9015.1115.120.400.520.05United 2816.1533.2216.35Sweden5.295.35Data as of 7/31/2022. Source: FactSet.Data as of 7/31/2022. Charts show weights in various book/market and profitability buckets(highest 25%, middle 50%, and lowest 25%) across market capitalizations. Excludes REITs.Source: FactSet.18
As of 7/31/2022Emerging Markets Equity Portfolio CompositionKey CharacteristicsSector Allocation (%)FUNDBENCHMARK 50.2 B 91.1 BWeighted Average Book/Market0.720.56Information Technology18.0919.70Weighted Average Profits/Book0.270.24Consumer Discretionary13.3913.60Number of 07.01Benchmark: MSCI Emerging Markets IMI IndexWeighted Average Market CapData as of 7/31/2022. Source: FactSet.Size and Style Allocation (%)FUNDBOOK-TO-MARKET AND alsFUNDBENCHMARK18.3320.11Communication Services7.009.20Consumer Staples5.786.28Energy5.334.79Health Care4.424.64Utilities3.643.11Real .5615.55India16.7715.10Data as of 7/31/2022. Source: FactSet.Top 5 Country Allocations (%)BENCHMARKBOOK-TO-MARKET AND H9.3330.5812.7610.1912.917.16South Korea13.7212.34Brazil6.165.304.316.114.51Data as of 7/31/2022. Source: FactSet.Data as of 7/31/2022. Charts show weights in various book/market and profitability buckets(highest 25%, middle 50%, and lowest 25%) across market capitalizations. Excludes REITs.Source: FactSet.19
As of 7/31/2022Performance Overview Fixed Income FundsReturns as of Month-End (%)FUND AND BENCHMARK1 MOQTDYTD1 YRSINCEINCEPTIONINCEPTIONDATEAvantis Core Fixed Income - Inst2.642.64-9.20-10.66-6.382/24/2021Bloomberg U.S. Aggregate Bond Index2.442.44-8.16-9.12-5.34Avantis Short Term Fixed Income - Inst1.041.04-3.79-4.81-3.20Bloomberg U.S. 1-5 Year Gov/Credit Index0.970.97-3.63-4.64-3.10Avantis Core Municipal Fixed Income - Inst2.572.57-5.76-6.31-2.80S&P National AMT-Free Municipal Bond Index2.602.60-6.18-6.39-2.782/24/20212/24/2021Core Fixed Income Inst.AVIGXExpense Ratio (%)0.15Total Assets ( M)4.18AVSFXShort Term Fixed Income Inst.Expense Ratio (%)0.15Total Assets ( M)10.70Core Municipal Fixed Income Inst.AMUXExpense Ratio (%)0.15Total Assets ( M)10.66Expense ratio as of the most recent prospectus. Assets as of7/31/2022.Data as of 7/31/2022. Performance in USD, net of fees. Periods greater than one year have been annualized. Source: FactSet.For standardized quarterly performance, please see Appendix. Performance data quoted represents past performance and is no guarantee of future results. Current performancemay be lower or higher than the performance data quoted. Investment return and principal value will fluctuate so that an investor's shares, when redeemed, may be worth more orless than original cost. Returns less than one year are not annualized. Index performance does not represent the fund's performance. It is not possible to invest directly in an index.20
As of 7/31/2022Core Fixed Income Portfolio CompositionKey CharacteristicsSector AllocationBenchmark: Barclays U.S. Aggregate Bond IndexFUNDBENCHMARKEffective Duration (years)6.476.51GovernmentYield to Maturity (%)3.683.40Agencies2.14%1.24%SEC Yield (%) Emerging Markets0.08%1.28%Cash and Cash Equivalents-9.54%0.00%OAS (bps)8246Holdings31012,597Data as of 7/31/2022 Source: American Century Investments, Bloomberg Index Services Ltd., StateStreet. *Data is preliminary and subject to change.FUNDBENCHMARK24.59%40.34%** Institutional ClassData as of 7/31/2022 Source: American Century Investments, Bloomberg Index Services Ltd.*Data is preliminary and subject to change.Credit QualityDuration BreakdownFUNDBENCHMARKU.S. %15 1.86%8.50%Cash and Cash Equivalents-9.54%0.00%Data as of 7/31/2022 Source: American Century Investments, Bloomberg Index Services Ltd.*Data is preliminary and subject to change.Data as of 7/31/2022 Source: American Century Investments, Bloomberg Index Services Ltd.*Data is preliminary and subject to change.Find the prospectus at AvantisInvestors.comYEARS21
As of 7/31/2022Short-Term Fixed Income Portfolio CompositionKey CharacteristicsSector AllocationBenchmark: Barclays 1-5 Year US Gov/Credit IndexFUNDBENCHMARKEffective Duration (years)2.652.68Yield to Maturity (%)3.32SEC Yield 3%31.05%Emerging Markets0.00%0.94%Cash and Cash Equivalents1.18%0.00%OAS (bps)4025Holdings1723,218Data as of 7/31/2022 Source: American Century Investments, Bloomberg Index Services Ltd., StateStreet. *Data is preliminary and subject to change.Credit QualityU.S. GovernmentAAAAAABBBBBNRCash and Cash EquivalentsData as of 7/31/2022 Source: American Century Investments, Bloomberg Index Services Ltd.*Data is preliminary and subject to change.Duration 50.86%4-64.88%16.21%Data as of 7/31/2022 Source: American Century Investments, Bloomberg Index Services Ltd.*Data is preliminary and subject to change.Data as of 7/31/2022 Source: American Century Investments, Bloomberg Index Services Ltd.*Data is preliminary and subject to change.Find the prospectus at AvantisInvestors.com22
As of 7/31/2022Core Municipal Fixed Income Portfolio CompositionKey CharacteristicsCredit QualityBenchmark: S&P AMT-Free Municipal Bond IndexFUNDBENCHMARKEffective Duration (years)4.976.43Yield to Maturity (%)2.873.31SEC Yield (%)**2.36N/AHoldings28913,007Data as of 7/31/2022 Source: American Century Investments, S&P Dow Jones Indices LLC, StateStreet. *Data is preliminary and subject to change.Top 5 SectorsFUNDBENCHMARKSpecial Tax23.93%23.44%State GO18.11%18.65%Local GO13.26%13.13%Public Power8.51%5.43%Water & Sewer6.59%9.22%Data as of 7/31/2022 Source: American Century Investments, S&P
Avantis Investors for more information. 2. Did You Know? 3 The Current State of SPACs. Back in 2020, special purpose acquisition companies, known as SPACs and sometimes referred to as blank-check companies, gained newfound fame among investors. SPACs are investment vehicles that undergo an