Transcription
Electric Power Distribution in the World: Todayand TomorrowEPRG Working Paper1826Cambridge Working Paper in Economics1846Sinan Küfeoğlu, Michael Pollitt & Karim AnayaAbstract In light of the increasing importance of distributed energy resources (DERs) in theelectricity system, there is an ongoing need to understand the current status of electric powerdistribution across the world. This review paper compiles key information about thedistribution systems in 175 countries worldwide. The findings for each country include thenumber, legal structure and ownership of distribution system operators, the access to electricitythey provide, distribution level voltages, electric power frequency and the significance ofrenewable electricity generation. This study covers 99.4% of the world’s population. As ofJune 2018, there are around 7600 distribution system operators in these 175 countries. Afterreviewing today’s distribution system status, this paper also reviews the various discussionsand proposals for tomorrow’s electric power distribution. The discussion covers both systemoperation and market platform roles as well as data management options for DSOs in the nearfuture.Keywordsdistribution system operator; DSO; market platform; transmissionsystem operator; TSOJEL ClassificationL94ContactPublicationFinancial Supports.kufeoglu@jbs.cam.ac.ukAugust 2018Nonewww.eprg.group.cam.ac.uk
Electric Power Distribution in the World: Today and TomorrowSinan Küfeoğlu1Michael G. PollittKarim AnayaEnergy Policy Research GroupUniversity of CambridgeEnergy Policy Research GroupUniversity of CambridgeEnergy Policy Research GroupUniversity of CambridgeAbstract In light of the increasing importance of distributed energy resources (DERs) in the electricity system,there is an ongoing need to understand the current status of electric power distribution across the world. Thisreview paper compiles key information about the distribution systems in 175 countries worldwide. The findingsfor each country include the number, legal structure and ownership of distribution system operators, the accessto electricity they provide, distribution level voltages, electric power frequency and the significance of renewableelectricity generation. This study covers 99.4% of the world’s population. As of June 2018, there are around7600 distribution system operators in these 175 countries. After reviewing today’s distribution system status,we also review the various discussions and proposals for tomorrow’s electric power distribution. The discussioncovers both system operation and market platform roles as well as data management options for DSOs in thenear future.Keywords: distribution, system, operator, regulation1. IntroductionIn 2000 the United States (US) National Academy of Engineering chose electrification through vastnetworks of the electricity grid as the best engineering achievement of the 20th century 2. It is nosurprise that the US Homeland Security defines the energy sector as uniquely critical due to itsenabling function across all critical infrastructure sectors (White House, 2013), while Center for theStudy of the Presidency & Congress emphasizes the significance of the electric power grid as the mostcritical of critical infrastructure (Center for the Study of the Presidency & Congress, 2014). Indeveloped countries, we might say that the traditional power systems have served societies well forthe last one hundred years. The North American Electricity Reliability Corporation assumes a loss ofload expectation to be one day in ten years, which corresponds to an annual average continuity ofelectricity supply of 99.97% in US (NERC, 2011) and Council of European Energy Regulators reportan average of 3 hours of interruption per year which again corresponds to a reliability level of 99.97%in Europe (CEER, 2015a). Electric power systems have been going through a radical transformationdue to renewable energy sources, distributed generation, demand-driven planning ambitions, smartgrids and smart energy technologies, climate change related pressures and increasing consumerpreferences. It is often argued that yesterday’s power systems paradigm might not meet the demands1Corresponding author. S. Küfeoğlu. e-mail: s,kufeoglu@jbs.cam.ac.uk. The authors acknowledge the help and contributions ofCEER (Council of European Energy Regulators), EURELECTRIC (The Union of the Electricity Industry) and IRENA(International Renewable Energy Agency) in completing this paper. We also acknowledge the help of Ji Tianyao on China.2See r/4/024/Feb22Release.pdf1
of the future. Traditional design of the power systems which puts distinct (and varying acrosscountries) boundaries between generation (G), transmission (T), distribution (D) and retail (R) mightbe regarded as inefficient and incapable of meeting the challenges of the transition to a low carbonelectricity system transformation. In the past electricity systems have been built around movingpower from large central power plants directly connected to the transmission system to passive loadsconnected to the distribution system. Increasingly, across the OECD, the system has shifted to a worldwhere most of new generation is connected directly to the distribution system and loads arebecoming more active in both importing and exporting power and maintaining power quality. Insuch a world, distribution systems move from passive networks, often quietly integrated withtransmission or retail to being active networks whose role in shaping the system is the subject ofincreased commercial and regulatory interest.This review paper compiles some of the significant information about the distribution systems in 175countries worldwide in order to characterise the current situation of the distribution system as wemove to a world where these entities are a focus of interest. The findings for each country include thenumber, legal structure and ownership of distribution system operators, the access to electricity theyprovide, distribution level voltages, electric power frequency and the significance of renewableelectricity generation. This study covers 99.4% of the world’s population. As of June 2018, there arearound 7600 distribution system operators in these 175 countries. After reviewing today’s distributionsystem status, this paper also reviews the various discussions and proposals for tomorrow’s electricpower distribution. This paper also highlights the concept of Distribution System Platforms (DSPs)which are proposed to be a better option in terms of facilitating the shift from passive to activedistribution network operation. In addition to active management of two-way power flows, DSPs alsoprovide market mechanisms to trade power products (e.g. reactive power, reserve, frequencysupport) at a distribution level. The European Commission’s directive 2009/72/EC, Article 2(5) definesdistribution as (EC, Directive 2009/72):“distribution means the transport of electricity on high-voltage, medium-voltage and low-voltagedistribution systems with a view to its delivery to customers but does not include supply.” At thesame directive, Article 2(6) defines a Distribution System Operator (DSO) as:“Distribution System Operator means a natural or legal person responsible for operating, ensuringthe maintenance of and, if necessary, developing the distribution system in a given area and, whereapplicable, its interconnections with other systems and for ensuring the long-term ability of thesystem to meet reasonable demands for the distribution of electricity.” This definition remains thesame after the 'Winter Energy Package' proposed by the European Commission in December 2016. Inline with the European Commission we use the term DSO to cover both network ownership andsystem operation, as these are currently integrated for almost all (proper) distribution entities in theworld (i.e. beyond small network extensions built and owned by third parties to the incumbent DSOin an area).When we talk about DSOs, we should mention unbundling of distribution from generation,transmission and retailing as well. After the privatization and liberalization waves of 80s that startedin Chile and Britain, in many parts of the world vertically integrated undertakings have gone throughunbundling. The EC defines a Vertically Integrated Undertaking (VIU) at Directive 2009/72/EC,Article 2(21) as:2
‘Vertically integrated undertaking’ in the European Union Internal Electricity Market means anelectricity undertaking or a group of electricity undertakings where the same person or the samepersons are entitled, directly or indirectly, to exercise control, and where the undertaking or group ofundertakings perform at least one of the functions of transmission or distribution, and at least one ofthe functions of generation or supply of electricity.’The definition of a VIU is clear and straightforward. However, the definition of an unbundledundertaking is more complex. Unbundling means separation of the distribution from the rest of theVIU. The DSO separation can take various forms. The EC acknowledges four main types ofunbundling. These are ownership, legal, functional and accounting unbundling. EC Staff WorkingDocument (EC Evaluation Report, 2016) defines the unbundling rules as:“- Full ownership unbundling (ownership separation) is where the DSO is a separate company to anyinterests in generation or supply (not required by the Electricity Directive).- Legal unbundling is where the DSO is a legally separate entity with its own independent decisionmaking board, but remains within the umbrella of a Vertically-Integrated Undertaking (VIU).- Functional or management unbundling is where the operational, management and accountingactivities of a DSO are separated from other activities in the VIU; and- Accounting unbundling is where the DSO business unit must keep separate accounts for itsactivities to prevent cross subsidisation, from the rest of the VIU.”According to Directive 2009/72/EC, Article 26(4) legal and functional unbundling is binding howeverit can be exempted for European DSOs with customers less than 100,000. However, in some countriesthis threshold is lower (50,000 for Austria and Finland, 90,000 for Czech Republic and 1,000 forSlovenia). Moreover, Malta is exempted from EC unbundling rules. Among the Council of EuropeanEnergy Regulators (CEER) member countries, about 100 DSOs have more than 100,000 customers. Weshould remind ourselves that as of 2015 only 189 DSOs out of around 2400 were legally unbundled inEurope (CEER, 2015b). Ownership unbundling is a complicated and challenging process. NewZealand is the first country that achieved this in 1998 (Nillesen & Pollitt, 2011). In Europe, only inNetherlands full-ownership unbundling of DSOs is required by law (CEER, 2016).From the rest of the paper and in line with the European Commission we use the term DSO to coverboth network ownership and system operation, as these are currently integrated for almost all(proper) distribution entities in the world (i.e. beyond small network extensions built and owned bythird parties to the incumbent DSO in an area).Section 2 introduces today’s electric power distribution by summarizing the findings of ourcharacterisation of DSOs from 175 countries. Section 3 presents some of the proposals and ideas aboutthe structure of the DSOs in the future. Section 4 includes a brief conclusion and discussion about thepaper.3
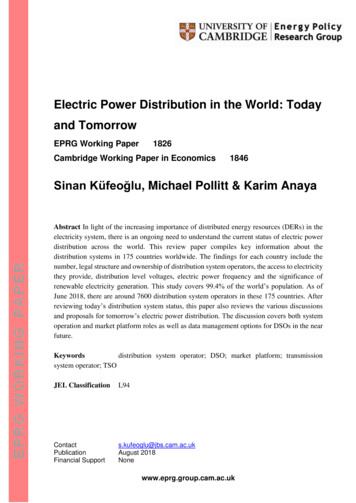
2. Electric Power Distribution of TodayTo better present the results of this comprehensive review, we would like to illustrate some of thefindings as maps. Figure 1 shows the electric power frequencies used in countries. Figure 2 presentsthe access to electricity worldwide (World Bank, 2014 and International Energy Agency, 2017). Figure3 summarizes the renewable electricity generation as a share of the renewable electricity output in thetotal electricity generation output (EIA, 2015; IRENA, 2015). Figure 4 is about the DSO intensity bysimply showing number of connected people served by one DSO in each country (World Bank, 2016).Figure 5 presents the ownership of the DSOs worldwide. In addition to distinguishing public andprivate ownership, we defined a third classification as mixed ownership. Mixed ownership coversDSOs that have public and private shareholders. Table 1 shows the details of DSO ownership in theUS, Australia, Canada, Brazil, India and New Zealand. Finally, Table 2 and Table 3 include all thedistribution system information that we gathered for this paper. The DSO structure information pereach country is presented with four functions of electricity system, where;G: GenerationT: TransmissionD: DistributionR: RetailThe ownership/legal structure of DSOs is a challenging subject on which to make decisive conclusions(e.g. knowing all the shareholders and ultimate parent companies of a given distribution entity isdifficult to trace and present, especially when there might be foreign owners). We therefore focus onlegal structure of DSOs within the country of interest. Unbundling of the power sector is a grey areafor many countries we reviewed. In addition, due to privatization, renationalization, company splitsor due to company mergers, the number of DSOs may vary as well3. For example, there were 8 DSOsin the Netherlands in 2015, however in 2018, this number is 7. Similarly, number of German DSOsdropped from 884 to 875 in these years.3We welcome contributions from the readers, especially from industry, to update our Tables 2 & 3.4
Figure 1. Electric power frequency50 Hz and 60 Hz are the two AC frequencies used in the world. Africa, Europe, Oceania and majorityof Asia use 50 Hz, where North America, Latin America and the majority of South America have 60Hz power systems. Liberia is on a transition from 60 Hz to 50 Hz. Moreover, Easter Japan runs at 50Hz whereas western Japan runs at 60 Hz.Figure 2. Access to electricityAccess to continuous electric power is a problem in various parts of the world. While developedcountries are going through a rapid technological transition by adapting smart grids, around 1.06billion people lack access to electricity still in 2017 (IEA, 2017; World Bank, 2014). This corresponds to14.8% of the world’s population. The challenge is to succeed in the sustainable energy transitiontogether while urgently extending electricity provision to these large populations.5
Figure 3. Renewable electricity generationRenewable electricity generation is on the rise in almost all countries in the world. According to theEIA and IRENA statistics, this output ranges from around 0% (Kuwait, Libya, Saudi Arabia) to 100%(Paraguay, mainly hydropower) in 2015 (EIA, 2015; IRENA, 2015). In 2015, total electricity generationwas around 23,254 TWh and the renewable electricity generation was approximately 5,601TWh. Thecorresponding renewable electricity generation in the world was 24% in the same year.Figure 4. Population per DSOWe prepared Figure 4 to illustrate the average number of people in a country served by one DSO. It isquite notable that there are 900 DSOs in Switzerland serving a total population of 8.3 million, there6
are only 2 large DSOs (SGCC and CSG) and a relatively small one in China4, a country with apopulation of almost 1.4 billion (World Bank, 2016). Arriving at the number of DSOs in a country ischallenging as there may be very small network extensions or microgrids not captured by ourstatistics, but in line with the discussion above a ‘proper DSO’ is one with area monopoly responsibleboth the distribution network and its operation and for connecting new customers within its area andphysically interconnected with transmission.Figure 5. Ownership of the DSOsFigure 5 is an attempt to summarise DSO ownership. Do private or public DSOs provide higherquality services to customers? Does privatization guarantee lower distribution and energy bills? Isinnovation better supported at private DSOs? These matters are still discussed in the electricitycommunity. The answers are out of scope of this paper. However, we see that there are only a fewcountries in the world that have only fully private DSOs. Mixed ownership means that some DSOsare privately owned and some are publicly owned, or there are both private and public shareholdersin the same distribution company. The DSOs with more than 50% ownership by state or other publicentities are assumed as publicly owned. Table 1 gives detailed information about 6 countries thathave mixed DSO ownership.We identify the Inner Mongolia Power Company as the small one. The covers a large area of western Inner Mongolia. Webelieve there may be at least 11 others with exclusive distribution service territories and rights to connect new customers (e.g.in part of the megacity of Shenzhen), but their exact relationship and nature to SGCC and CSG is less clear (indeed at least onepreviously separate company was recently acquired by SGCC). In China, as in all other countries in this paper, we ignoreindependent distribution network operators who largely manage customer assets associated within strictly limited areas suchas housing estate or a port.47
Table 1Percentage of public ownership(% number of publicly owned DSOs among all anada3IndiaNew Zealand41There are Investor owned, cooperative and municipal utilities in the US. Majority of the utilities aresmall-scaled municipal utilities (about 2000).2As of 2007, about 64% of Brazilian distribution assets were controlled by private sector companies.3There are about 364 smaller utilities across Canada, of which 87% are located in Ontario.4There are 29 trust-owned and non-trust-owned utilities in New Zealand. 18 trust-owned utilities arefully owned by community or consumer trusts. The remaining 11 electricity distribution utilities arenon-trust-owned companies. They have various owners, including a mix of community or consumertrusts that own some but not all shares, local authorities, other electricity distribution businesses,private interests, and the public.Here we should note that in the US, Canada and New Zealand, even though the number of publiclyowned DSOs is higher, the number of customers served by these DSOs is much less than those ofprivately owned ones. Especially in the US and Canada investor owned utilities (or private utilities) arebigger entities serving more customers in aggregate than the municipal or cooperative utilities. In 2016,out of around 138 million electricity customers in US, 90 million of those (65%) were served by theinvestor owned utilities (EIA, 2017).Some of the countries we listed in Table 2 with G, T, D, R or with other combinations with at least twofunctions are specified as “unbundled” countries. However, the definition of unbundling may varyfrom region to region. A label of legal structure of D only refers to the normal situation in EUcountries, where distribution is legally and functionally unbundled from G, T and R. However, a labelof D, R implies the distribution activity is in a legal structure which combines D and R. In this study,by unbundling we assume legal and functional unbundling. And we adopt the unbundling rules tobe in line with the definition of the EC. Therefore, in an unbundled undertaking the same person orthe same persons should not be entitled, directly or indirectly, to exercise control of at least one of thefunctions of transmission or distribution, and at least one of the functions of generation or supply ofelectricity. For example, in Egypt the electricity sector is officially unbundled. However, EgyptianElectricity Holding Company owns distribution and transmission and also owns almost 90% of thegeneration in Egypt. We can say that the unbundling rules are not in line with the definition of theEC. Therefore, we reported the structure of Egyptian power sector as G, T, D, R (vertically integrated)meaning that the same legal body, person or persons directly or indirectly have control over theseoperations. Another example of confusing legal structure is the power sector in Brazil. Electricity8
sector in Brazil is legally unbundled. However, in some regions there are companies responsible forgeneration, transmission and distribution of electricity. The legal structures of small scale municipaland cooperative distribution companies in South and Central America might be different than thoseof large DSOs (Argentina, Bolivia, Peru for example). Therefore, we did not include these companiesinto account in Table 2. Moreover, Independent Power Producers (IPPs) exist in many of the G, T, D,R countries. Therefore, G, T, D, R or other combinations of at least two functions such as G, T or G, Ddo not necessarily mean that all generation is being run by the same entity that has control over thedistribution operation.9
Table 2Electric Power Distribution review tricityconnection(thousand)ConnectedPopulationper DSO(thousand)34,656.033,638.8831,017.15No ofDSOsLegalStructureOwnershipAccess toelectricity(%)Afghanistan1G, T, D, lgeria4G, T, D, Rpublic10040,606.050.0010,151.51Angola3G, T, D, ixed99.643,847.43175.391,559.72Armenia1T, .0063.399,762.270.009,762.27CountryAzerbaijan1G, T, D, Rpublic100Bahamas, The2G, T, D, Rmixed100391.230.00195.62Bahrain1G, T, D, Rpublic1001,425.170.001,425.17Bangladesh6G, Dpublic75162,951.5640,737.8920,368.95Barbados1G, D, Rprivate100285.000.00285.00Belarus1G, T, D, 1,348.160.001,418.52Belize1G, T, D, Rmixed92.5366.9527.52339.43Benin1G, T, D, Rpublic31.910,872.307,404.043,468.26Bhutan1G, T, D, Rpublic100797.760.00797.76Bolivia7T, Dmixed91.510,887.88925.471,660.40Bosnia & Herzegovina3G, T, D, Rpublic1003,516.820.001,172.27Botswana1G, T, D, Rpublic54.82,250.261,017.121,233.14Brazil60G, T, Dmixed99.6207,652.86830.613,282.89Brunei2G, T, D, 7.820.001,018.26Burkina Faso1G, T, D, Rpublic20.318,646.4314,861.203,785.23Burundi1G, T, D, Rpublic1010,524.129,471.711,052.41Cambodia1G, T, D, Rpublic59.715,762.376,352.249,410.13Cameroon1G, T, D, Rpublic63.323,439.198,602.1814,837.01Canada34G, D, Rmixed10036,286.430.001,067.25Central African Rep.1G, T, D, Rpublic2.64,594.624,475.16119.46Chad1G, T, D, e10017,909.750.00716.39China (mainland)3T, D, Rpublic1001,378,665.000.00689,332.50China - Macau1T, D, Rpublic100612.170.00612.17China - Hong Kong2G, D, Rmixed1007,346.700.003,673.35Colombia28G, T, D, Rmixed97.848,653.421,070.381,640.79Comoros2G, Dpublic71.2795.60229.13283.23Congo, Dem. Rep.1G, T, D, Rpublic15.278,736.1566,768.2611,967.8910
nnection(thousand)ConnectedPopulationper DSO(thousand)No ofDSOsLegalStructureOwnershipAccess toelectricity(%)Costa Rica1G, T, D, Rpublic99.24,857.2738.864,818.41Croatia1G, T, D, Rpublic1004,170.600.004,170.60Cuba1G, T, D, Rpublic10011,475.980.0011,475.98Cyprus1G, T, D, Rpublic1001,170.130.001,170.13CountryCzech xed1005,731.120.00116.96Djibouti1G, T, D, Rpublic42.3942.33543.72398.61Dominican Republic3G, T, .216,385.07294.93804.51Egypt9G, T, D, Rpublic99.995,688.6895.6910,621.44El , T, D, Rpublic32.95,152.703,457.461,695.24Estonia37G, T, D, Rmixed1001,316.480.0035.58Ethiopia1G, T, D, .00898.761G, T, D, e148Dmixed10066,896.110.00452.00Gabon1G, T, D, Rmixed90.11,979.79196.001,783.79Gambia1T, 93Greece10,746.740.005,373.372G, T, D, Rpublic100Grenada1G, T, D, 82.471,011.53819.52Guinea1G, T, D, G, T, D, Rpublic12.61,815.701,586.92228.78Guyana1G, T, D, Rpublic86.9773.30101.30672.00Haiti1G, T, D, Rpublic32.710,847.337,300.253,547.08Honduras1G, T, D, 0.001,636.336D, G, T, , D, Rpublic91.2261,115.4622,978.16238,137.30Iran42G, T, D, Rpublic99.280,277.43642.221,896.08Iraq7G, T, D, 004,773.100.004,773.10Israel1G, T, D, 600.590.00448.89Ivory Coast1G, T, D, Rpublic62.523,695.928,885.9714,809.95Jamaica1G, T, D, Rmixed99.52,881.3614.412,866.9511
nnection(thousand)ConnectedPopulationper DSO(thousand)No ofDSOsLegalStructureOwnershipAccess toelectricity(%)Japan10G, T, D, 00889.85Kenya1T, D, Rmixed64.548,461.5717,203.8631,257.71Kiribati1G, T, D, Rpublic48.1114.3959.3755.02Kuwait1G, T, D, Rpublic1004,052.580.004,052.58KyrgyzstanCountry4G, T, D, Rpublic99.86,082.7012.171,517.63Laos1G, T, D, 1,960.420.00178.22Lebanon1G, T, D, Rpublic1006,006.670.006,006.67Lesotho1G, T, D, Rpublic34.42,203.821,445.71758.11Liberia1G, T, D, Rpublic12.24,613.824,050.93562.89Libya1G, T, D, ,872.300.00410.33Luxembourg6T, .210.002,081.21Madagascar1G, T, D, Rpublic22.924,894.5519,193.705,700.85Malawi1G, T, D, Rpublic11.318,091.5816,047.232,044.35Malaysia3G, T, D, Rpublic98.631,187.26436.6210,250.21Maldives35G, D, Rpublic100417.490.0011.93Mali1G, T, D, Rpublic40.517,994.8410,706.937,287.91Malta1G, T, D, Rmixed100436.950.00436.95Mauritania1G, T, D, Rpublic31.34,301.022,954.801,346.22Mauritius1G, T, D, Rpublic99.91,263.471.261,262.21Mexico1G, T, D, .40272.47229.58Morocco11T, Dmixed9935,276.79352.773,174.91Mozambique1G, T, D, Rpublic28.628,829.4820,584.258,245.23Myanmar2G, T, D, Rpublic58.852,885.2221,788.7115,548.25Namibia3G, D, Rpublic55.92,479.711,093.55462.05Nepal1G, T, D, mixed10017,018.410.002,431.20New xed896,149.93676.49547.34Niger1G, T, D, ed60.6185,989.6473,279.9210,246.34North Korea1G, T, D, 1,101.77Pakistan11G, Dmixed73.6193,203.4851,005.7212,927.0712
CountryNo ofDSOsLegalStructureOwnershipAccess ionper 4.19Papua New Guinea1G, T, D, Rpublic20.38,084.996,443.741,641.25Paraguay1G, T, D, Rpublic99.36,725.3147.086,678.23Peru22D, mixed89.6103,320.2210,745.30661.25Poland169G, D, 324.610.00794.20Qatar1G, T, D, Rpublic1002,569.800.002,569.80Republic of Congo1G, T, D, Rpublic43.25,125.822,911.472,214.35Romania48G, D, Rmixed10019,705.300.00410.53Russia15G, T, D, Rpublic100144,342.400.009,622.83Rwanda1G, T, D, Rpublic3011,917.518,342.263,575.25Sao Tome & Principe1G, T, D, Rpublic59.4199.9181.16118.75Saudi Arabia1G, T, D, Rpublic10032,275.690.0032,275.69Senegal1G, T, D, Rpublic6415,411.615,548.189,863.43Serbia1G, T, D, Rpublic1007,057.410.007,057.41Seychelles1G, T, D, Rpublic99.594.680.4794.21Sierra Leone1G, Dpublic13.17,396.196,427.29968.90Singapore1G, T, D, Rpublic1005,607.280.005,607.28Slovakia3G, T, D, 064.840.002,064.84Somalia1G, T, D, Rpublic19.114,318.0011,583.262,734.74South Africa1G, T, D, Rpublic8655,908.867,827.2448,081.62South Korea1T, D, Rpublic10051,245.710.0051,245.71South Sudan1G, T, D, 960.00136.60Spain340Sri Lanka2T, Dpublic10021,203.000.0010,601.50Sudan1G, D, Rpublic46.239,578.8321,293.4118,285.42Suriname1G, T, D, Rpublic100558.370.00558.37Swaziland1G, T, D, 5Sweden170DmixedSwitzerland900G, D, Rmixed1008,372.100.009.30Syria14G, T, D, Rpublic95.718,430.45792.511,259.85Taiwan1T, Dpublic10023,557.460.0023,557.46Tajikistan1G, T, D, Rpublic1008,734.950.008,734.95Tanzania1G, T, D, Rpublic32.755,572.2037,400.0918,172.11Thailand2G, T, D, Rpublic10068,863.510.0034,431.76Togo1G, T, Dpublic45.77,606.374,130.263,476.11Trinidad & Tobagopublic98.61,364.9619.111,345.851T, DTunisia1G, T, D, Rpublic10011,403.250.0011,403.25Turkey21D, Rprivate10079,512.430.003,786.3113
nnection(thousand)ConnectedPopulationper DSO(thousand)No ofDSOsLegalStructureOwnershipAccess toelectricity(%)Turkmenistan1G, T, D, ,487.9633,024.428,463.54Ukraine44G, D, Rmixed10045,004.640.001,022.83United Arab Emirates4G, T, D, Rpublic1009,269.610.002,317.40United Kingdom, GB14Dprivate10064,612.240.004,615.16United Kingdom, NI1T, Dprivate1001,851.600.001,851.60G, D, Rmixed100323,127.510.00103.83CountryUnited States3112Uruguay1G, T, D, Rpublic99.93,444.013.443,440.57Uzbekistan1G, T, D, Rpublic10031,848.200.0031,848.20Venezuela1G, T, D, Rpublic99.531,568.18157.8431,410.34Vietnam1G, T, D, Rpublic98.392,701.101,575.9291,125.18Yemen1G, T, D, Rpublic48.227,584.2
7600 distribution system operators in these 175 countries. After reviewing today’s distribution system status, we also review the various discussions and proposals for tomorrow’s electric power distribution. The discussion covers both system operation and market platform roles as wel