Transcription
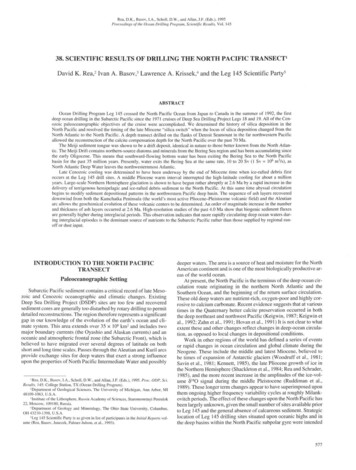
An Example of a Scientific LogbookScientific logbooks are bound so that the pages can not be lost or removed. The pages are numbered also, so that ifthe book is photocopied, it is easy to reassemble the copies in the right order. The paper is of high quality so thatthis record will last for many years. There have actually been cases where patent rights of considerable commercialvalue have been assigned in court on the basis of logbook records. Here I will track out for you a series of inquiriesabout a certain feature in a specific kind of plot.Page 56, Thursday, April 17, 1997The plot on the bottom of the page is the result of a theoretical calculation. As described in the second paragraph, Iexpected what we call a flat distribution, like in the plot.Page 58, Thursday, April 17, 1997My beautiful theory has been viciously murdered by callous and uncaring observed fact. The distribution is not flat.It is sloped, and there is a sharp peak at the left side. My first thought is that the computer program making the plot(the code) is wrong; that theory doesn't live very long. Didn’t even live long enough to make it to the bottom of thepage.Page 59, Thursday, April 17, 1997I have a new and beautiful theory about the peak at the left. I looked at it really close up and find 160 events whichare at the left which have a certain property, called “zero planes hit.” So I have a new hypothesis: “The peak at theleft is due to zero planes hit.” I know that when no planes are hit, the result is meaningless. So I get rid of the zeroplanes-hit cases, and my spike goes away. At the bottom of the page, I believe I know what causes the spike, andstop thrashing away at this problem.Page 76, Thursday, April 24, 1997The peak at the left is back. See it there, on the second plot, labeled “data?” Darn. I thought I knew what that was,but I don’t.Page 85, Wednesday, April 30, 1997On the bottom of the page, I make a new construction. I think that maybe the peak is from electrons. You see, thisplot is made from a bunch of measurements on a bunch of particles. The assumption was “All the particles are pions”—but then I realized that if the assumption is wrong, and there are a few electrons in the bunch by mistake, thenit would make a peak at the left-hand side of the plot.Page 87, Wednesday, April 30, 1997Here is my first test of the “Maybe some electrons snuck in” theory. If the theory is right, then the peak should bevery close to zero. It should be all in that one “bin” on the very left side. Ha! It is! OK, second test . . . I think Iknow how many electrons could have snuck in there, dead max. Could that number of electrons make this peak?Page 88, Wednesday, April 30, 1997Yes! I think that no more than 0.1% of the bunch of particles I call pions could actually be electrons that snuck in.And a peak of that size on the left-hand side corresponds to 0.1% contamination rate. . . . So now I think I knowwhat causes that peak at the left.Final note . . .I spent two years quite certain that this peak at the left side was due to electrons passing themselves off as pions. OnJuly 23, 1999, while working on some other thing, I saw my peak disappear . . . and I wasn’t doing anything involving electrons at the time. I was playing around with some totally different thing, called (ironically enough) “accidentals.” I have to wonder, “Why did I think that peak was due to electrons?” Going back over my notebooksfrom two years ago answers the question.
An Example of a Scientific Logbook Scientific logbooks are bound so that the pages can not be lost or removed. The pages are numbered also, so that if