Transcription
Institute for International Research6th Annual Investment Performance Measurement,Risk and Attribution Analysis ConferenceFixed IncomeAttribution AnalysisAndrew Frongellofrongello@yahoo.comSydney, AustraliaFebruary 25th & 26th, 20041
Purpose of Performance AttributionInternalzExplain portfolio total return relative to a benchmarkzAnalyze effects of key predetermined factors on returnzRelate performance results to investment strategies and changes in marketconditions¾ Provides evidence regarding investment strategy bets¾ Shows how changes in market conditions impact total returns¾ Reveals unintended bets and their contribution to relative performanceExternalzClient support & RFPs2
Desirable Characteristics of an Attribution ModelSimple and ConsistentzConsistent methodology applied to portfolio and indexFlexiblezAccommodates new products/asset typesDynamiczCaptures all trades and revisionsMulti-dimensionalzComputations occur from the bottom up; interpretation from the top downAccuratezExplains relative performance, consistent with market conditions, key risk factors, andinvestment strategy3
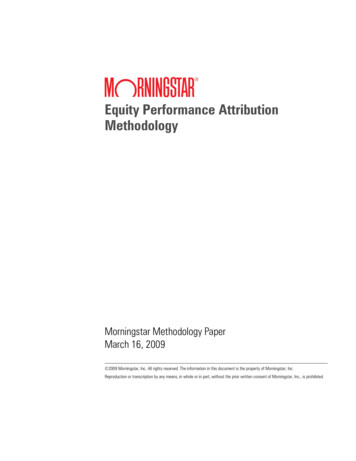
Role of Attribution in the Investment ProcessPerformance Summary of Strategy, Trading & Markets:Provides feedback on management decisions & portfolio riskAttributionStrategy eTrading4
Attribution Factors used in Equity & Fixed IncomeYield Curve & Duration Effect Measures impact of duration and yield curve posture over measurement period Duration return broken out into shift and twist componentsAllocation Effect Measures pay-off due to over-weights / under-weights Bucketed by sector, industry, quality, coupon & maturity or other dimensionsSelection Effect Measures ability to choose desirable securities and avoid blow-ups Defined relative to chosen bucketsCurrency EffectManagement style determines relevance and priority of each factor5
Fixed Income Attribution ModelzEach security’s total return consists of a duration return and an excess returnzPortfolio and index returns are a weighted average of constituent issue returnsTotal ReturnDuration/Curve ReturnExcess ionStrategyVariablesDurationYield FixedEquity6
Duration ReturnPortion of Total Return due to duration and curvezCreate synthetic Duration-Matched-Treasury (DMT) from yield curvezAll portfolio holdings are assigned equivalent DMTszDMT measures price return due to changes in the yield curveTotal ReturnDuration/Curve tDuration Yield CurveDistribution7Excess ReturnAllocationSelection
Excess ReturnPortion of Total Return due to OAS and other “Spread Factors”zCompute excess return over DMT¾ Excess Return total return - duration returnzDifference between portfolio and benchmark total excess returns is explainedby allocation and selectionTotal ReturnDuration/Curve ReturnShiftTwist8Excess llocationSecuritySelectionStrategyVariables
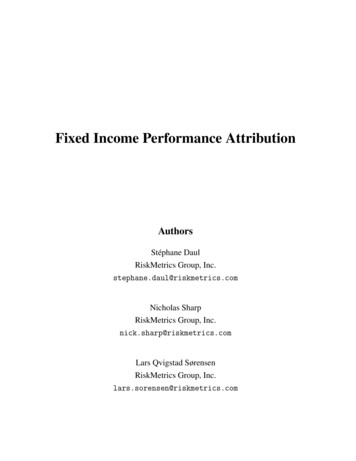
Yield Curve Shifts (referenced to 5yr Treasury)6.0%5.0% Y5 yr YDMTYield4.0%( Y3.0%DMT Y5 yr )2.0%BegEndShift0.0%Change-1.0%930 Yr.10 Yr.5 Yr.-2.0%2 Yr.Spread1.0%
Attribution Equations: Shift and TwistTotal Return Duration Return Excess Return D YDMTTwistShift D ( YDMT Y5 yr ) D Y5 yr10
Duration Return Example (December 2002)Issue Name First Energy 6.45% 11/15/11Duration 6.87Total return 3.79%Change 5yr -0.513%Change 6.87yr -0.408%Duration Return Shift Return D YDMT -6.87 x -.408% 2.80% D Y5 yr -6.87 x -.513% 3.52%(Twist Return D YDMT Y5 yr) -6.87 x .105% -0.72%Excess Return Total Ret – Duration Ret 3.79% - 2.80% 0.99%11
Aggregate to Higher Dimensions (Sector Example)By computing duration and excess return at the cusip level, the data can beaggregated to any higher dimension-sector, quality, coupon, etc.SectorTotalWeight100.00%Duration3.90Total Return2.23%Shift Return2.00%Twist Return-0.28%Excess 12%0.02%0.22%1.16%-0.72%12
Attribution Equations: Allocation & SelectionR R S AEquity InputsA [(W i W i )( R i R ) ]WeightsiS [W i (R i R i ) ]R Total ReturnsiR Return of portfolioFixed Income InputsR Return of benchmarkA Allocation effect of all sectors iWeightsS Selection effect of all sectors iR Excess ReturnsR i Return of sector i in portfolioR i Return of sector i in benchmarkW i Weight of sector i in portfolioW i Weight of sector i in benchmark13
Portfolio vs. Benchmark: Consolidated AttributionWhich bets paid off: Shift, Twist, Allocation, Security ORP:HY:PortfolioWeightDurationTotal ReturnShift ReturnTwist ReturnExcess .50%0.27%0.30%1.03%0.22%IndexWeightDurationTotal ReturnShift ReturnTwist ReturnExcess 34%0.30%0.25%0.51%-0.92%14
Variations/Enhancements Around this Simple ModelzTimeEffects on DMT IncomezTimeEffects on DMT PricezKey Rate DurationszCash Flow DecompositionzPrinciple ComponentszDaily Calculations15
Time Effects on DMT IncomeThe simple method only captures the dirty price return of the DMT anddoes not capture physical cash flows. D YDMTSome incorporate an income approximation for the DMT by adding theproduct of:the portion of the year elapsed during the measurement periodandthe yield of the DMT. D YDMT T YDMT16
Time Effects on DMT PriceRolldown EffectAs a bond matures, its DMT reference point on the yield curve will rolldown to theleft.In a steep yield curve environment, bond prices will increase as the bonds age andfall into portion of the yield curve with lower yields.Accretion Effect (often though of as income)As a bond reaches maturity, its price will move towards par.This results in accretion for discount bonds or amortization for premium bonds.17
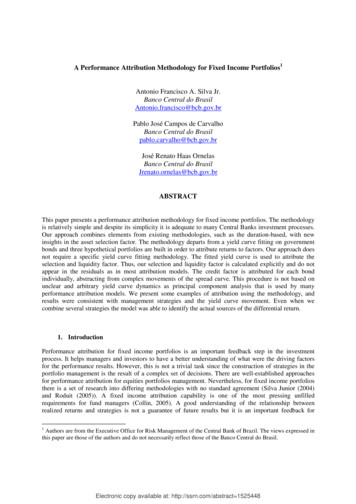
Key Rate DurationsThe simple method does not capture the issue’s cash flow distribution alongthe yield curve. It treats every security as a bullet cash flow security.Why is this a limitation?Even with identical durations, a barbell cash flow distribution will outperform a ladderedor bullet distribution in a flattening environment. Vice versa for steepening.Key rate durations capture the issue’s sensitivity to movements at key rates.DMTTotalDuration5Shift-0.30Duration Return1.50KRD1 YR.5 YR.10 YR.30 0.40Duration Return0.150.960.320.121.55Compute duration return at each key rate with shift at corresponding point on curve. Totalduration return is simply the sum at each point.Shift can be defined as in the simple method with twist backed out from the total.18
Cash Flow DecompositionIdentical to the simple method exceptall cash flows are broken out of each issue and treated as bullet bonds!ProsIdeal. Most accurate measure of duration return attainable.ConsData intensive. Doesn’t add much value over KRD approach.19
Principal ComponentsIn the simple model the yield curve is described by shift & twist.Popular principal components include Shift - The parallel component of the yield curve movement Twist – The movement of the ends defined around a static pivot. Butterfly – The movement of the ends relative to the center movement.Other principal components include Snake – Large sine curve to model other curve movement Worm – Smaller sine curve and/or other residual to explain rest of curve.Be careful not to model things you can’t actively manage or manage against.20
Daily CalculationsEquity and Fixed Income attribution both benefit from daily calculations.However, this benefit is greater in the fixed income world!Why?Duration statistics change everyday.A fresh measure of duration will lead to accurate duration returns.A stale measure of duration will lead to erroneous duration returns.Capture a fresh duration every day to avoid this problem.Questions?21
5 Attribution Factors used in Equity & Fixed Income Yield Curve & Duration Effect Measures impact of duration and yield curve posture over measurement period Duration return broken out into shift and twist components Allocation Effect Measures pay-off due to over-weights / under-weights Bucketed by sector, industry, quality, coupon & maturity or other dimensions