Transcription
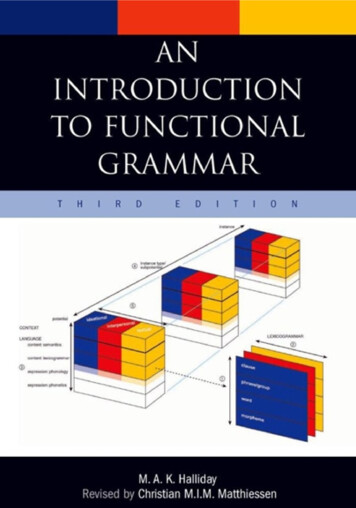
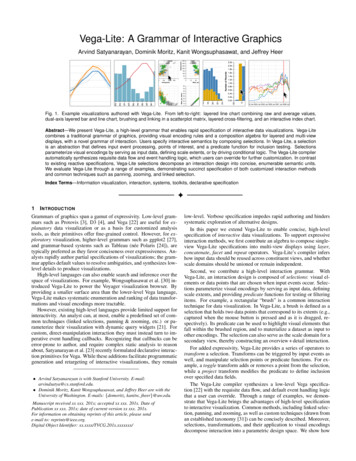
Vega-Lite: A Grammar of Interactive GraphicsArvind Satyanarayan, Dominik Moritz, Kanit Wongsuphasawat, and Jeffrey HeerFig. 1. Example visualizations authored with Vega-Lite. From left-to-right: layered line chart combining raw and average values,dual-axis layered bar and line chart, brushing and linking in a scatterplot matrix, layered cross-filtering, and an interactive index chart.Abstract—We present Vega-Lite, a high-level grammar that enables rapid specification of interactive data visualizations. Vega-Litecombines a traditional grammar of graphics, providing visual encoding rules and a composition algebra for layered and multi-viewdisplays, with a novel grammar of interaction. Users specify interactive semantics by composing selections. In Vega-Lite, a selectionis an abstraction that defines input event processing, points of interest, and a predicate function for inclusion testing. Selectionsparameterize visual encodings by serving as input data, defining scale extents, or by driving conditional logic. The Vega-Lite compilerautomatically synthesizes requisite data flow and event handling logic, which users can override for further customization. In contrastto existing reactive specifications, Vega-Lite selections decompose an interaction design into concise, enumerable semantic units.We evaluate Vega-Lite through a range of examples, demonstrating succinct specification of both customized interaction methodsand common techniques such as panning, zooming, and linked selection.Index Terms—Information visualization, interaction, systems, toolkits, declarative specification1I NTRODUCTIONGrammars of graphics span a gamut of expressivity. Low-level grammars such as Protovis [3], D3 [4], and Vega [22] are useful for explanatory data visualization or as a basis for customized analysistools, as their primitives offer fine-grained control. However, for exploratory visualization, higher-level grammars such as ggplot2 [27],and grammar-based systems such as Tableau (née Polaris [24]), aretypically preferred as they favor conciseness over expressiveness. Analysts rapidly author partial specifications of visualizations; the grammar applies default values to resolve ambiguities, and synthesizes lowlevel details to produce visualizations.High-level languages can also enable search and inference over thespace of visualizations. For example, Wongsuphasawat et al. [30] introduced Vega-Lite to power the Voyager visualization browser. Byproviding a smaller surface area than the lower-level Vega language,Vega-Lite makes systematic enumeration and ranking of data transformations and visual encodings more tractable.However, existing high-level languages provide limited support forinteractivity. An analyst can, at most, enable a predefined set of common techniques (linked selections, panning & zooming, etc.) or parameterize their visualization with dynamic query widgets [21]. Forcustom, direct-manipulation interaction they must instead turn to imperative event handling callbacks. Recognizing that callbacks can beerror-prone to author, and require complex static analysis to reasonabout, Satyanarayan et al. [23] recently formulated declarative interaction primitives for Vega. While these additions facilitate programmaticgeneration and retargeting of interactive visualizations, they remain Arvind Satyanarayan is with Stanford University. E-mail:arvindsatya@cs.stanford.edu. Dominik Moritz, Kanit Wongsuphasawat, and Jeffrey Heer are with theUniversity of Washington. E-mails: {domoritz, kanitw, jheer}@uw.edu.Manuscript received xx xxx. 201x; accepted xx xxx. 201x. Date ofPublication xx xxx. 201x; date of current version xx xxx. 201x.For information on obtaining reprints of this article, please sende-mail to: reprints@ieee.org.Digital Object Identifier: xx.xxxx/TVCG.201x.xxxxxxx/low-level. Verbose specification impedes rapid authoring and hinderssystematic exploration of alternative designs.In this paper we extend Vega-Lite to enable concise, high-levelspecification of interactive data visualizations. To support expressiveinteraction methods, we first contribute an algebra to compose singleview Vega-Lite specifications into multi-view displays using layer,concatenate, facet and repeat operators. Vega-Lite’s compiler infershow input data should be reused across constituent views, and whetherscale domains should be unioned or remain independent.Second, we contribute a high-level interaction grammar. WithVega-Lite, an interaction design is composed of selections: visual elements or data points that are chosen when input events occur. Selections parameterize visual encodings by serving as input data, definingscale extents, and providing predicate functions for testing or filteringitems. For example, a rectangular “brush” is a common interactiontechnique for data visualization. In Vega-Lite, a brush is defined as aselection that holds two data points that correspond to its extents (e.g.,captured when the mouse button is pressed and as it is dragged, respectively). Its predicate can be used to highlight visual elements thatfall within the brushed region, and to materialize a dataset as input toother encodings. The selection can also serve as the scale domain for asecondary view, thereby constructing an overview detail interaction.For added expressivity, Vega-Lite provides a series of operators totransform a selection. Transforms can be triggered by input events aswell, and manipulate selection points or predicate functions. For example, a toggle transform adds or removes a point from the selection,while a project transform modifies the predicate to define inclusionover specified data fields.The Vega-Lite compiler synthesizes a low-level Vega specification [22] with the requisite data flow, and default event handling logicthat a user can override. Through a range of examples, we demonstrate that Vega-Lite brings the advantages of high-level specificationto interactive visualization. Common methods, including linked selection, panning, and zooming, as well as custom techniques (drawn froman established taxonomy [31]) can be concisely described. Moreover,selections, transformations, and their application to visual encodingsdecompose interaction into a parametric design space. We show how
each of these parameters can be systematically varied to generate alternate interaction techniques for a given set of visual encodings. Suchenumeration can be useful to explore alternative designs, and can aidhigher-level reasoning about interaction — for example, recommending suitable interaction techniques as part of a design tool.2 R ELATED W ORKVega-Lite builds on prior work on grammars of graphics, visualizationsystems, and techniques for interactive selection and querying.2.1 Grammar-Based Visual EncodingSince the initial publication of Wilkinson’s The Grammar of Graphics [29] in 1999, formal grammars for statistical graphics have grownincreasingly popular as a way to succinctly specify visualizations.Wilkinson’s work was quickly followed by the Stanford Polaris system [24], later commercialized as Tableau. Hadley Wickham’s popularggplot2 [27] and ggvis [20] packages implement variants of Wilkinson’s model in the R statistical language. These tools eschew charttemplates, which offer limited means of customization, in favor ofcombinatorial building blocks. Abstracting data models, graphicalmarks, visual encoding channels, scales and guides (i.e., axes and legends) yields a more expressive design space, and allows analysts torapidly construct graphics for exploratory analysis [13]. Concise specification is achieved in part through ambiguity: users may omit detailssuch as scale transforms (e.g., linear or log) or color palettes, whichare then filled in using a rule-based system of smart defaults. Moreexpressive lower-level (and thus more verbose) grammars, includingthose of Protovis [3], D3 [4], and Vega [22], have been widely usedfor creating explanatory and highly-customized graphics.The design of Vega-Lite is heavily influenced by these works.Drawing from Wilkinson’s grammar and Polaris/Tableau, Vega-Litesimilarly represents basic plots using a set of encoding definitions thatmap data attributes to visual channels such as position, color, shape,and size, and may include common data transformations such as binning, aggregation, sorting, and filtering. Drawing from Vega, VegaLite uses a portable JSON (JavaScript Object Notation) syntax thatpermits generation from a variety of programming languages. VegaLite specifications are compiled to full Vega specifications, hence theexpressive gamut of Vega-Lite is a strict subset of that of Vega. As wewill later demonstrate, Vega-Lite sacrifices some expressiveness fordramatic gains in the conciseness and clarity of specification.In terms of visual encoding, Vega-Lite differs most from other highlevel grammars in its approach to multiple view displays. Each ofthese grammars supports faceting (or nesting) to construct trellis plotsin which each cell similarly visualizes a different partition of the data.Both Wilkinson’s grammar and Polaris/Tableau achieve this through atable algebra over data fields, which in turn determines spatial subdivisions. Tableau additionally supports the construction of multiview dashboards via a different mechanism, with each view backedby a separate specification. In contrast, we contribute a view algebra: starting with unit specifications that define a single plot, VegaLite expresses composite views using operators for layering, horizontal or vertical concatenation, faceting, and parameterized repetition.When applicable, these operators will merge scale domains and properly align constituent views. Disparate views can also be combinedinto arbitrary dashboards, all within a unified algebraic model.2.2 Specifying Interactions in Visualization SystemsDespite the central role of interaction in effective data visualization[13, 19], little work has been done to develop a grammar for specifying interaction techniques. Wilkinson’s grammar includes no notionof interaction. Tableau supports common interaction techniques, butrelies on mechanisms external to the visual encoding grammar. Earlysystems like GGobi [25] support common techniques as well, and provide imperative APIs for custom methods. However, such APIs makeeasy tasks needlessly complex, burdening developers with learninglow-level execution details. More recent systems, including Protovis,D3, and VisDock [7], offer a typology of common techniques that canbe applied to a visualization. Such top-down approaches, however,limit customization and composition. For example, D3’s interactorsencapsulate event processing, making it difficult to combine them iftheir events conflict (e.g., if dragging triggers brushing and panning).The prior work perhaps most closely related to Vega-Lite is the Reactive Vega language [23]. Reactive Vega draws on Functional Reactive Programming techniques to formulate composable, declarative interaction primitives for data visualization. Reactive Vega models inputevents as continuous data streams. To succinctly define event streamsof interest, Vega employs an event selector syntax, which Vega-Litealso uses for customized event logic. Event streams, in turn, drivedynamic variables called signals. Signals parameterize the remainderof the visualization specification, endowing it with reactive semantics.When a new event fires, it propagates to dependent signals; visual encodings that use them are automatically re-evaluated and re-rendered.This reactive approach is not only capable of expressing a diverse setof interactions [23], it is performant as well [22], with interactive performance at least twice as fast as the equivalent D3 program.However, the resulting reactive specifications are low-level and verbose. Specifying common techniques can be time-consuming, requiring tens of lines of JSON, and it is difficult to know how to adapttechniques in pursuit of alternative designs. In contrast, Vega-Lite isa higher-level specification language, with primitives that decomposeinteraction design into a parametric space. Common methods requiretypically 1-2 lines of code, and design variations can be explored bysystematically enumerating defined properties. Nevertheless, Reactive Vega provides a performant runtime and an “assembly language”to which Vega-Lite specifications are compiled.2.3Interactive Selection and QueryingSelection, often in the form of users clicking or lassoing visual itemsof interest, is a fundamental operation in user interfaces and hasbeen well-studied in the context of data visualization. For example,in Snap-Together Visualization [17], multiple views are coordinatedvia “primary-” and “foreign-key actions,” which propagate selecteddata tuples from one view to the others. Wilhelm [28] describes theneed for such “indirect object manipulation” methods as an axiomof interactive data displays. Chen’s compound brushing [6] providesa visual dataflow language for specifying a rich space of transformations of brush selections. More recently, Brunel [5] provides aspecial #selection data field that is dynamically populated withthe elements a user interacts with, and can be used to link multiple views or filter input data. Similarly, RStudio’s Shiny [21], animperative web application layer, provides brushedPoints andnearestPoints functions which can be used throughout an Rscript to operate on selected elements.Other systems have studied formally representing selections as dataqueries [28]. For example, brushing interactions in VQE [9] generateextensional queries that enumerate all items of interest; a form-basedinterface enables specification of intensional (declarative) queries. Individual point and brush selections in DEVise [15], known as visualqueries, map to a declarative structure and are used to link togethermultiple views. With VIQING [18], rectangular “rubber band” selections are modeled as range extents, and views can be dropped on topof each other to join their underlying datasets. Heer et al. [12] demonstrate that by modeling a selection as a declarative query, interactive“query relaxation” can successively capture more items of interest.Vega-Lite builds on this work by richly integrating an interactiveselection abstraction with the primitives of visual encoding grammars.Vega-Lite selections are populated with one or more points of interest,in response to user interaction. Extensible predicate functions map selections to declarative queries, and allow a minimal set of “backing”points to represent the full space of selected points. Additional operators can transform a selection’s predicate or backing points (e.g.,offseting them to translate a brush selection or perform panning). Selections then parameterize visual encodings by serving as input data,defining scale extents, or using predicates to test or filter items. Theend result is an enumerable, combinatorial design space of interactive statistical graphics, with concise specification of not only linkinginteractions, but panning, zooming, and custom techniques as well.
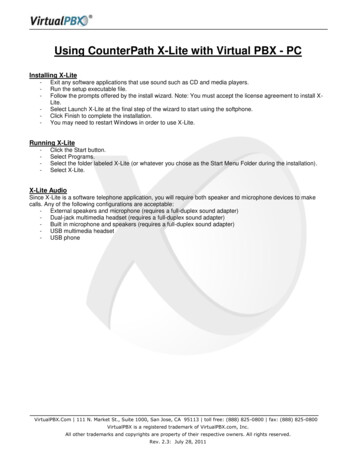
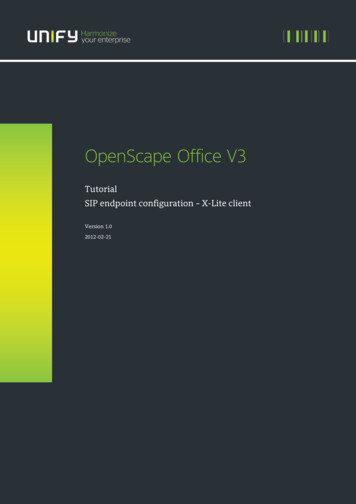
(a) Line chart with aggregation{(b) Correlation between wind and temperature{"data": {"url": "data/weather.csv","formatType": "csv" },"mark": "line","encoding": {"x": {"field": "date","type": "temporal","timeUnit": "month" },"y": {"field": "temp max","type": "quantitative","aggregate": "mean" },"color": {"field": "location","type": "nominal" }}}(c) Stacked bar chart of weather types{"data": {"url": "data/weather.csv","formatType": "csv" },"mark": "point","encoding": {"x": {"field": "temp max","type": "quantitative","bin": true },"y": {"field": "wind","type": "quantitative","bin": true },"size": {"field": "*","aggregate": "count" },"color": {"field": "location","type": "nominal" }} }"data": {"url": "data/weather.csv","formatType": "csv" },"mark": "bar","encoding": {"x": {"field": "location","type": "nominal"},"y": {"field": "*","type": "quantitative","aggregate": "count"},"color": {"field": "weather","type": "nominal"}}}Fig. 2. Vega-Lite unit specifications visualizing weather data. These examples demonstrate varied mark types and data transformations.3 T HE V EGA -L ITE G RAMMAR OF G RAPHICSVega-Lite combines a grammar of graphics with a novel grammar ofinteraction. In this section, we describe Vega-Lite’s basic visual encoding constructs and an algebra for view composition. In prior work,Wongsuphasawat et al. [30] introduced the simplest Vega-Lite specification — here referred to as a unit specification — that defines a single Cartesian plot with a specific mark type to encode data (e.g., bars,lines, plotting symbols). Given multiple unit plots, we introduce layer,concat, facet, and repeat operators to provide an algebra for constructing composite views. This algebra can express layered plots, trellisplots, and arbitrary multiple view displays. Each operator is responsible for combining or aligning underlying scales and axes as needed.3.1 Unit SpecificationA unit specification describes a single Cartesian plot, with a backingdata set, a given mark-type, and a set of one or more encoding definitions for visual channels such as position (x, y), color, size, etc.Formally, a unit view consists of a four-tuple:unit : (data, transforms, mark-type, encodings)The data definition identifies a data source, a relational table consisting of records (rows) with named attributes (columns). This data table can be subject to a set of transforms, including filtering and addingderived fields via formulas. The mark-type specifies the geometric object used to visually encode the data records. Legal values include bar,line, area, text, rule for reference lines, and plotting symbols (point &tick). The encodings determine how data attributes map to the properties of visual marks. Formally, an encoding is a seven-tuple:encoding : (channel, field, data-type, value, functions, scale, guide)Available visual encoding channels include spatial position (x, y),color, shape, size, and text. An order channel controls sorting ofstacked elements (e.g., for stacked bar charts and the layering order ofline charts). A path order channel determines the sequence in whichpoints of a line or area mark are connected to each other. A detailchannel includes additional group-by fields in aggregate plots.The field string denotes a data attribute to visualize, along with agiven data-type (one of nominal, ordinal, quantitative or temporal).Alternatively, one can specify a constant literal value to serve as thedata field. The data field can additionally be transformed using functions such as binning, aggregation (sum, average, etc.), and sorting.(a) Dual axis layered chart{"layers": [{"data": {"url": "data/weather.csv","formatType": "csv"},"transform": {"filter": "datum.location 'Seattle'"},"mark": "bar","encoding": {"x": {"field": "date", "type": "temporal","timeUnit": "month" },"y": {"field": "precipitation", "type": "quantitative","aggregate": "mean", "axis": {"grid": false} },"color": {"value": "#77b2c7"} }}, {"data": {"url": "data/weather.csv","formatType": "csv"},"transform": {"filter": "datum.location 'Seattle'"},"mark": "line","encoding": {"x": {"field": "date", "type": "temporal","timeUnit": "month" },"y": {"field": "temp max", "type": "quantitative","aggregate": "mean", "axis": {"grid": false} },"color": {"value": "#ce323c"} }} ],"resolve": {"y": {"scale": "independent"}} }An encoding may also specify properties of a scale that maps fromthe data domain to a visual range, and a guide (axis or legend) forvisualizing the scale. If not specified, Vega-Lite will automaticallypopulate default properties based on the channel and data-type. For xand y channels, either a linear scale (for quantitative data) or an ordinalscale (for ordinal and nominal data) is instantiated, along with an axis.For color, size, and shape channels, suitable palettes and legends aregenerated. For example, quantitative color encodings use a singlehue luminance ramp, while nominal color encodings use a categoricalpalette with varied hues. Our default assignments largely follow themodel of prior systems [24, 30].Unit specifications are capable of expressing a variety of common, useful plots of both raw and aggregated data. Examples includebar charts, histograms, dot plots, scatter plots, line graphs, and areagraphs. Our formal definitions are instantiated in a JSON (JavaScriptObject Notation) syntax, as shown in Fig. 2.3.2 View Composition AlgebraGiven multiple unit specifications, composite views can be created using a set of composition operators. Here we describe the set of supported operators. We use the term view to refer to any Vega-Lite specification, whether it is a unit or composite specification.3.2.1 LayerThe layer operator accepts multiple unit specifications to produce aview in which subsequent charts are plotted on top of each other. Forexample, a layered view could consist of one layer showing a histogram of a full data set, and another overlaying a histogram of a filtered subset (Fig. 11). The signature of the operator is:layer([unit1 , unit2 , .], resolve)To create a layered view, we produce shared scales (if their typesmatch) and merge guides by default. For example, we compute theunion of the data domains for the x or y channel, for which we thengenerate a single scale. We believe this is a useful default for producing coherent and comparable layers. However, Vega-Lite can notenforce that a unioned domain is semantically meaningful. To prohibitlayering of composite views with incongruent internal structures, thelayer operator restricts its operands to be unit views.To override the default behavior, users can specify strategies to resolve scales and guides using tuples of the form (channel, scale guide,(b) Vertical concatenation of two charts{"vconcat": [{ . },{"data": {"url": "data/weather.csv","formatType": "csv"},"transform": {"filter": "datum.precipitation 0"},"mark": "point","encoding": {"y": {"field": "location","type": "nominal"},"x": {"field": "*","type": "quantitative","aggregate": "count"},"color": {"field": "date","type": "temporal","timeUnit": "year"}}}]}Fig. 3. (a) A dual axis chart that layers lines for temperature on top of bars for precipitation; each layer uses an independent y-scale. (b) Thetemperature line chart from Fig. 2(a) concatenated with rainy day counts in New York and Seattle; scales and guides for each plot are independent.
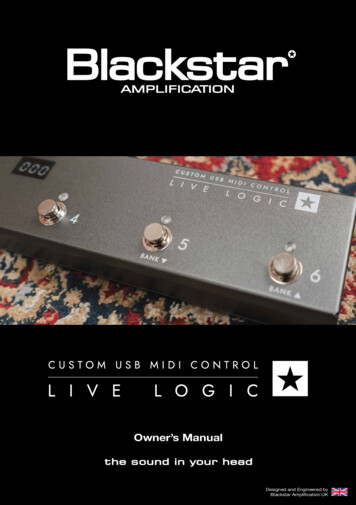
(a) Faceted charts{(b) Repeated charts{"data": {"url": "data/weather.csv","formatType": "csv"},"facet": {"column": {"field": "location","type": "nominal"}},"spec": {"mark": "line","encoding": {"x": { . },"y": { . },"color": { . }}}}"repeat": {"column": ["temp max","precipitation"]},"spec": {"data": {"url": "data/weather.csv","formatType": "csv"},"mark": "line","encoding": {"x": { . }"y": {"field": {"repeat": "column"},"type": "quantitative","aggregate": "mean"},"color": { . }}} }Fig. 4. (a) Weather data faceted by location; the y-axis is shared, and the underlying scale domains unioned, to enable easier comparison.(b) Repetition of different measures across columns; the y channel references the column template parameter to vary the encoding.resolution), where resolution is one of independent or union. Independent scales and guides for each layer produce a dual-axis view, asshown in the layered plots in Fig. 3(a).facet, the scale and axis components allow users to override defaultsfor how sub-plots are positioned and labeled, while resolve controlsresolution of scales and guides within the plots themselves.3.2.23.3 Nested ViewsComposition operators can be combined to create more complexnested views or dashboards, with the output of one operator serving asinput to a subsequent operator. For instance, a layer of two unit viewsmight be repeated, and then concatenated with a different unit view.The one exception is the layer operator, which, as previously noted,only accepts unit views to ensure consistent plots. For concision, twodimensional faceted or repeated layouts can be achieved by applyingthe operators to the row and column channels simultaneously. Whenfaceting a composite view, only the dataset targeted by the operator ispartitioned; any other datasets specified in sub-views are replicated.ConcatenationTo place views side-by-side, Vega-Lite provides operators for horizontal and vertical concatenation. The signatures for these operators are:hconcat([view1 , view2 , .], resolve)vconcat([view1 , view2 , .], resolve)If aligned spatial channels have matching data fields (e.g., the ychannels in an hconcat use the same field), a shared scale and axisare used. Axis composition facilitates comparison across views andoptimizes the underlying implementation. Fig. 3(b) concatenates theline chart from Fig. 2(a) with a dot plot, using independent scales.3.2.3FacetWhile concatenation allows composition of arbitrary views, one oftenwants to set up multiple views in a parameterized fashion. The facetoperator produces a trellis plot [1] by subsetting the data by the distinctvalues of a field. The signature of the facet operator is:facet(channel, data, field, view, scale, axis, resolve)The channel indicates if sub-plots should be laid out vertically (row)or horizontally (column). The given data source is partitioned usingdistinct values of the field. The view specification provides a templatefor the sub-plots, inheriting the backing data for each partition fromthe operator. The scale and axis parameters specify how sub-plots arepositioned and labeled. Fig. 4(a) demonstrates faceting into columns.To facilitate comparison, scales and guides for quantitative fieldsare shared by default. This ensures that each facet visualizes the samedata domain. However, for ordinal scales we generate independentscales by default to avoid unnecessary inclusion of empty categories,akin to Polaris’ nest operator. When faceting by fiscal quarter andvisualizing per-month data in each cell, one likely wishes to see threemonths per quarter, not twelve months of which nine are empty. Userscan override the default behavior via the resolve component.3.2.4RepeatThe repeat operator generates multiple plots, but unlike facet allowsfull replication of a data set in each cell. For example, repeat can beused to create a scatterplot matrix (SPLOM), where each cell shows adifferent 2D projection of the same data table. The signature is:repeat(channel, values, scale, axis, view, resolve)Similar to facet, the channel parameter indicates if plots should divide by row or column. Rather than partition data according to a field,this operator generates one plot for each entry in a list of values. Encodings within the repeated view specification can refer to this provided value to parameterize the plot1 . By default, scales and axes areindependent, but legends are shared when data fields coincide. Like1 As the repeat operator requires parameterization of the inner view, it isnot strictly algebraic. It is possible to achieve algebraic “purity” via explicit repeated concatenation or by reformulating the repeat operator (e.g., by includingrewrite rules that apply to the inner view specification). However, we believethe current syntax to be more usable and concise than these alternatives.4 T HE V EGA -L ITE G RAMMAR OF I NTERACTIONTo support specification of interaction techniques, Vega-Lite extendsthe definition of unit specifications to also include a set of selections.Selections identify the set of points a user is interested in manipulating. In this section, we define the components of a selection, describea series of transforms for modifying selections, and detail how selections can parameterize visual encodings to make them interactive.4.1 Selection ComponentsWe formally define a selection as an eight-tuple:selection : (name, type, predicate, domain range,event, init, transforms, resolve)When an input event occurs, the selection is populated with backingpoints of interest. These points are the minimal set needed to identifyall selected points. The selection type determines how many backingvalues are stored, and how the predicate function uses them to determine the set of selected points. Supported types include a single point,a list of points, or an interval of points.A point selection is backed by a single datum, and its predicate testsfor an exact match against properties of this datum. It can also functionlike a dynamic variable (or signal in Vega [23]), and can be invokedas such. For example, it can be referenced by name within a filter expression, or its values used directly for particular encoding channels.List selections, on the other hand, are backed by datasets into whichpoints are inserted, modified or removed as events fire. Lists expressdiscrete selections, as their predicates test for an exact match with atleast one value in the backing dataset. The order of points in a listselection can be semantically meaningful, for example when a list selection serves as an ordinal scale domain. Fig. 5 illustrates how pointsare highlighted in a scatterplot using point and list selections.Intervals are similar to list selections. They are backed by datasets,but their predicates determine whether an argument falls within theminimum and maximum extent defined by the backing points. Thus,they express continuous selections. The compiler automatically addsa rectangle mark, as shown in Fig. 6(a), to depict the selected interval. Users can customize the appearance of this mark via the brushkeyword, or disable it altogether when defining the selection.Predicate functions enable a minimal set of backing points to represent the full space of selected points. For example, with predicates,
(a) Highlight a single point on click(b) Highlight a list of individual points{"id": {"type": "list", "toggle": true}"data": {"url": "data/cars.json"},"mark": "circle","select": {"id": {"type": "point"}},"encoding": {"x": {"field": "Ho
2.1 Grammar-Based Visual Encoding Since the initial publication of Wilkinson's The Grammar of Graph-ics [29] in 1999, formal grammars for statistical graphics have grown increasingly popular as a way to succinctly specify visualizations. Wilkinson's work was quickly followed by the Stanford Polaris sys-tem [24], later commercialized as Tableau.