Transcription
Saurabh Jha1, Archit Patke1, Jim Brandt2, AnnGentile2, Benjamin Lim1, Mike Showerman1,3, GregBauer1,3, Larry Kaplan4, Zbigniew T. Kalbarczyk1 andWilliam T. Kramer1,3, Ravishankar K. Iyer1,31University3Nationalof Illinois at Urbana-Champaign2SandiaCenter for Supercomputing ApplicationsMeasuring Congestion in High-PerformanceDatacenter InterconnectsNational Laboratories4CrayInc.
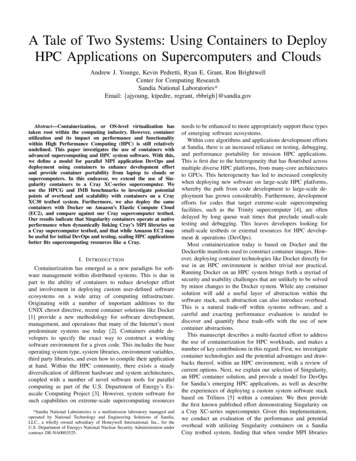
High-Performance Computing (HPC)HPC solves critical science, finance, AI, and other problemsWRF: Largest Weatherforecast simulationHurricane detector using AI(Courtesy: Nvidia)1
High-Performance Computing (HPC)HPC solves critical science, finance, AI, and other problemsWRF: Largest Weatherforecast simulationHPC on CloudHurricane detector using AI(Courtesy: Nvidia)HPC in Academic and National LabsNCSA (UIUC)Oakridge National Lab2
High-Performance Computing (HPC)High-speed Networks(HSN) Low per-hop latency [1][2] Low tail-latency variation High bisection bandwidth[1] [2] ed-azure-cloud-efficiency/3
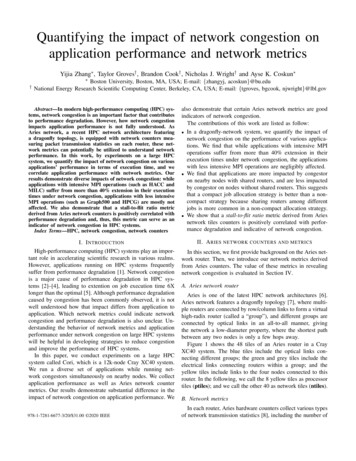
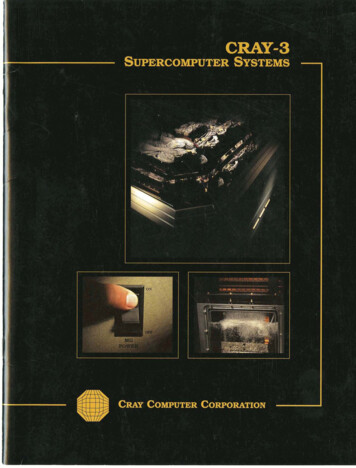
Networking and Performance VariationDespite the low-latency, high-speed networks (HSN) are susceptible to high congestionSuch congestion can cause up to 2-4X application performance variation in production settings1000-node production moleculardynamics code.256-node benchmark app(AMR)Runtime (min)Up to 𝟏. 𝟖𝟗 slowdown comparedto median runtime of 282 minutesUp to 4 slowdown compared to themedian loop iteration time of 2.5 sec55050045040035030025020015002468101214Run Number4
Networking and Performance VariationDespite low-latency, high-speed networks (HSN) susceptible to high congestionSuch congestion can lead to up to 2-3X application performance variation in production settingsQuestions: How often system/applications are experiencing congestion ? [Characterization] What are the culprits behind congestion? [Diagnostics] How to avoid and mitigate effects of congestion ? [Network and System Design]5
Highlights Created data mining and ML-driven methodology and associated framework for Characterizing network design and congestion problems using empirical data Identifying factors leading to the congestion on a live system Checking if the application slowdown was indeed due to congestion Empirical evaluation of a real-world large-scale supercomputer: Blue Waters at NCSA Largest 3D Torus network in the world5 months of operational data815,006 unique application runs70 PB of data injected into the network Largest dataset on congestion (first on HPC networks) Dataset (51 downloads and counting!) and code released6
Key Findingscongestion region HSN congestion is the biggest contributor to app performance variation Continuous presence of high congestion regions Long lived congestion (may persist for 23 hours) Default congestion mitigation mechanism have limited efficacy Only 8 % (261 of 3390 cases) of high congestion cases found using our framework were detected andacted by default congestion mitigation algorithm In 30% of the cases the default congestion mitigation algorithm was unable to alleviate congestion Congestion patterns and their tracking enables identification of culprits behindcongestion critical to system and application performance improvements E.g., intra-app congestion can be fixed by changing allocation and mapping strategies7
Congestion in credit-based flow control Network Focus on evaluation of credit-based flow control transmission protocol Flit is the smallest unit of datum that can be transferred Flits are not dropped during congestion Backpressure (credits) provides congestion controlAvailable Credits: 1023FLITFLITFLITFLITlinkSwitch 1Switch 2If credit 0, flit cancannotbe sentbe sent8
Measuring CongestionlinkSwitch 112 cyclesSwitch 2Congestion measured using Percent time stalled (𝑃!" )𝑻𝒊𝒔5 𝟏𝟎𝟎 𝒊 100 41.67 %𝑻12𝑻𝒊 : # network cycles in 𝑖 % measurement interval (fixedvalue)𝑻𝒊𝒔 : # total cycles the link was stalled in 𝑇 & (i.e., flit wasready to be sent but no credits available.)𝑷𝒊𝑻𝒔TimeIndicates flit waiting(no credit available,allocated buffer full)Indicates link is transmitting9
Congestion in credit-based flow control NetworkInsight: Congestion spreads locally (i.e., fansout from an origin point to other senders).FLITAvailable Credits: 0Switch 3link 2FLITFLITlink 3link 1Switch 1Switch 4Switch 2If credit 0, flit cannot be sent10
Congestion in credit-based flow control NetworkPTS (%)Insight: Congestion spreads locally (i.e., fansout from an origin point to other senders).FLITAvailable Credits: 0Switch 3link 2FLITFLITlink 3link 1Switch 1Switch 4Congestion VisualizationSwitch 2If credit 0, flit cannot be sent11
New unit for measuring congestionMeasure congestion in terms ofregions, their size and severityPTS (%)Unsupervised clusteringRaw Congestion VisualizationNeg: 0% 𝑃!" 5%distance is small:dδ(x,y) δstall difference is small:dλ(xs ys) θpLow: 5% 𝑃!" 15%Med: 15% 𝑃!" 25%High: 25% 𝑃!"12
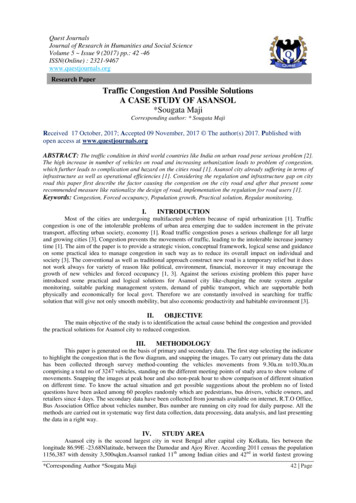
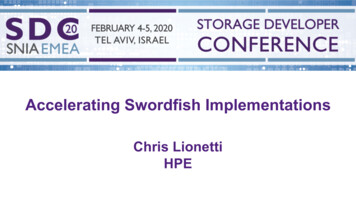
Congestion Regions Proxy for Performance EvaluationCongestion Regions (CRs) captures relation between congestion severity and applicationslowdown and therefore can be used for live forensics and debugging!(details in paper)550E ex cution Time (mins)1000-node production moleculardynamics (NAMD) m400Low: 5% 𝑃'( 15%Med: 15% 𝑃'( 25%350300200150High: 25% 𝑃'(NegLowMedHigh25005101520253035Max of average PTS across all regionsoverlapping the application topology13
Object StorageServers (OSS)System, Monitors, and DatasetsInfiniband network (IB)Networks3-DBlueTorusWatersCray GeminiNetwork Cray Gemini SwitchCourtesy: Cray Inc. (HP)Topology: 3D Torus (24x24x24)Compute nodes : 28K nodesAvg. Bisection Bandwidth: 17550 GB/secPer hop latency: 105 ns [1][1] -whitepaper.pdf14
Object StorageServers (OSS)System, Monitors, and DatasetsInfiniband network (IB)Monitoring logsNetworks3-DBlueTorusWatersCray GeminiNetwork Cray Gemini SwitchCourtesy: Cray Inc. (HP)Topology: 3D Torus (24x24x24)Compute nodes : 28K nodesAvg. Bisection Bandwidth: 17550 GB/secPer hop latency: 105 ns [1][1] -whitepaper.pdfCray edMetric service(LDMS) [2]SchedulerCharacterization(5 months)Live Analytics(60 seconds)100 GB Performancecounters15 TB40 MBWorkload8 GB55 MB[2] A. Agelastos et al. Lightweight Distributed Metric Service: A Scalable Infrastructure for Continuous Monitoring of Large-scale Computing Systemsand Applications. In SC14: International Conference for High Performance Computing, Networking, Storage and Analysis, pages 154–165, 2014.15
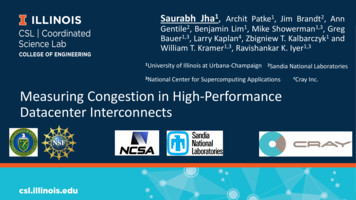
1. Congestion is the biggest contributor to app performance variationCR Duration (mins)Low: 5% 𝑃)* 15%Med: 15% 𝑃)* 25%High: 25% 𝑃)*1616001400800600400200200001200Congestion Region count decreases withincreasing duration400001000 LowMedHigh0Long-lived congestion Congestion Region can persist up to 24hours(median: 9.7 hours)#CRs60000
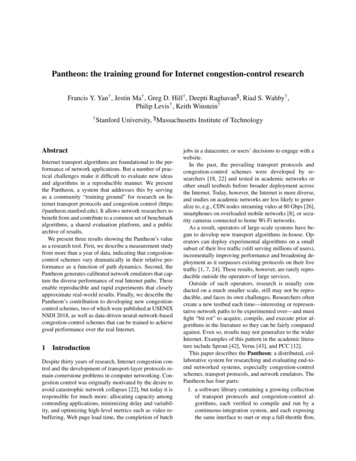
2. Limited efficacy of default congestion detection and mitigationmechanismsMedian: 7 hours #congestion mitigating triggered : 261 Median time between events: 7 hours Failed to alleviate congestion in 29.8% casesDefault system congestiondetection and mitigationDefault mitigation throttles all NICs such thataggregate traffic injection bandwidth across allnodes single node bandwidth ejectionBefore congestion mitigation17After congestion mitigation
2. Limited efficacy of default congestion detection and mitigationalgorithmsMedian: 7 hours, #events: 261 Default congestion mitigating triggered : 261 Median time between events: 7 hours Failed to alleviate congestion in 29.8% of thecasesDefault system congestiondetection and mitigationMedian: 58 minutes, #events: 3390Monet detectionOnly 8 % (261 of 3390 cases) of high congestioncases found by Monet were detected and acted bydefault congestion mitigation algorithm18
3. Congestion patterns and their tracking enables identification of culpritsbehind congestion Network design and congestionaware schedulingSystem loadchangesApp trafficpatternchangesLink failureE.g., topology-aware scheduling[1] improved system throughputby 56% by tuning resourceallocation strategies[1] J Enos et al. Topology-aware job scheduling strategies for torus networks. In Proc. Cray User Group, 2014.19
3. Congestion patterns and their tracking enables identification of culpritsbehind congestion Node mapping within theallocation reduces intra-appcongestionSystem loadchangesApp trafficpatternchangesLink failureE.g., TopoMapping [2] for findingoptimal process rank mappingfor the allocated resource[2] Galvez et al. Automatic topology mapping of diverse large-scale parallel applications. In Proceedings of the International Conference on Supercomputing, ICS ’17, pages 17:1–17:10, New York, NY, USA, 2017. ACM.20
Conclusion Developed and validated the proposed methodology on production datasets Code and dataset online (51 downloads and counting!) https://databank.illinois.edu/datasets/IDB-2921318 https://github.com/CSLDepend/monet21
Future WorkCongestion avoidance and mitigation is anongoing problem !Developing workload-aware high-speed networks Inferring and meeting application demands Optimizing congestion control and routingstrategiesMeet us at the postersession!Wednesday 6:30 PM - 8:00 PMCypress RoomCongestion Visualization on a productionCray Aries (DragonFly Network)22
Questions?23
HPC solves critical science, finance, AI, and other problems Hurricane detector using AI (Courtesy: Nvidia) High-Performance Computing (HPC) HPC on Cloud HPC in Academic and National Labs NCSA (UIUC) Oakridge National Lab. 3 High-Performance Computing (HPC) High-speed Networks (HSN)