Transcription
HYPERSPECTRAL IMAGE ANALYSIS FOR OIL SPILL DETECTIONFoudan Salem,1 Menas Kafatos,1 Tarek El-Ghazawi,2 Richard Gomez,1 and Ruixin Yang11Center for Earth Observing and Space ResearchGeorge Mason University, Fairfax, VA USA.fsalem@scs.gmu.edu2Department of Electrical and Computer EngineeringGeorge Washington University, Washington DC, US1.IntroductionDuring the last several decades, the Chesapeake Bay has suffered from several large oil spill events havethreatened coastal habitats and species. Chesapeake Bay’s marine resources remain vulnerable as they share thecoastal areas with major interstate commerce routes, underground pipelines, extensive development, large industrialfacilities, and heavy shipping traffic to the ports of Norfolk and Baltimore. In order to effectively protectcommunities and species in jeopardy, fast and accurate determination of oil spill hazard areas is needed, particularlyif monitoring large quantities of oil spilled. Where oil-handling infrastructure is aging, this need is amplified. Thisresearch addresses remote sensing, especially hyperspectral image analysis applicable to the Chesapeake Bay.This case study is a prototype of oil spill leaks in Patuxent River in Maryland (Darrell and Brebbia, 1996) andthe associated image analysis for detecting oil spills using hyperspectral imagery and the effect of oil contaminantson soil, water quality, wetland, and vegetation. Hyperspectral airborne images, as an effective survey tool, are amain source for getting real-time data. In the event of an oil spill, this information can be retrieved in a short time tohelp authorities plan the quickest route to the spill and formulate an effective environmental protection plan thatcould be a way to reduce damages. Hyperspectral sensor affords the potential for detailed identification of materialsand better estimates of their abundance. This can eliminate the false alarms of features that have the same color andappearance of oil, such as large algae blooms or jellyfish. These phenomena may be identified by visualinterpretation as a suspected oil spill using some conventional sensors. Some other types of light fuel, such asgasoline and diesel, cannot be identified visually because of their changing appearance with time.Hyperspectral sensing can record over 200 selected wavelengths of reflected and emitted energy. With thisspectral information one can exploit the spectral signature of oil and also distinguish between differentconcentrations of crude oil dispersant. HSI observations with high spectral and spatial resolution can be used todetect oil using the spectral signature matching to identify oil spectra based on chemical composition. Oil signaturescan be extracted for deferent oil concentration to identify the level of oil contamination of polluted areas, which isnecessary for determining proper cleaning processes.In this research, some of the problems of the conventional techniques can be minimized, when using moreadvanced methodology to identify oil spill based on the spectral signature matching not by visual interpretation ofthe image. New techniques such as HSI should be used in order to make the proper distinctions between oil spillsand to properly identify natural phenomena. Preliminary results of this research show that with HSI spectralinformation, the signature of oil can be used to detect minute concentrations of hydrocarbon (crude oil) on the seaand it can distinguish between different levels of oil dispersant on water. The first part of this study also includes themonitoring of oil slicks movements, dispersion in water, and identifying spills on the shoreline. The second partwill emphasize the oil contaminates in wetland, soil, vegetation, and grass in the Patuxent River basin in ChesapeakeBay due to oil pollution.A number of remote sensing systems are available (e.g., side-looking airborne radar, laser fluorescence,microwave radiometer, infrared-ultraviolet line scanner, SAR, ERS 1, 2 and LANDSAT satellite systems).However, problems associated with each of these systems preclude their exclusive use during oil spills. Althoughremote sensing data can be a valuable tool in the response effort, results from different sensors can vary widely(Fingas, 1991). This problem is particularly apparent during major spills, when many interpretative analyses forsatellite images are based on oil color or oil film appearance on water. Many of these analysis techniques have manyproblems identifying and quantifying oil floating on the sea. As the spill progressing, a surprising number of falsepositive sightings may be seen. Ice, internal waves, kelp beds, natural organics, pollen, plankton blooms, cloudshadows, jellyfish, algae, and guano washing off rocks all appear as oil (Pavia and Payton, 1983) (McFarland et al.,1993). Weather conditions are one of the limitations when using some sensors such as radar imagery, wind speedand high waves usually cause difficulties inherent in estimating area of coverage (Payne et. al., 1984). Waves will
increase natural dispersion during the early parts of the spill, break the surface tension that causes the oil to look“slick,” and mix some of the oil into the surface layer temporarily. Observers should note that as the wind speedincreases, the ability to detect the oil decreases (Ministry of Transport 1992). Visual observation of submerged oil isextremely difficult unless the water is very clear and shallow. Spill characteristics appear differently under low lightconditions and under strong winds conditions (Fingas, 1991). Observations in an up-sun direction are typicallydifficult to interpret. Glare due to very low sun angles and sunlight directly overhead can make observationsparticularly difficult due to poor contrast between the oil sheen and water. After oil spends even a short timefloating on the ocean surface, it starts to change its physical characteristics due to various physical, biological, andchemical processes (Schriel, 1987). The false reports obscure knowledge of the actual location and description ofthe spill. In additional to other factors that make some conventional remote sensing techniques unreliable.One of these conventional methods was used for tracking oil spill movements by using space shuttlephotography, the images was taken in sequentional order in the same time of the oil spill even, The visualinterpretation of the four images was based on the shape and the size of the oil spill, and the oil color. Theenlargement of the spill with the time indicated the oil dispersant rate and the spill movement direction towards theshoreline. Also the oil type can be identified as a crude oil based on the slick color and shape.1.1 Space Shuttle PhotographyThe four Space Shuttle images (from mission STS- 41C) were selected for the Saudi Arabia shoreline. Theimages were taken consecutively in a short period of time for the different stages of an oil slick. The oil spill appearsblack in the images; any slick in the image is significantly darker ( 2dB difference) than the surrounding seasurface water. The Space Shuttle photography has the advantage of taking images, with direct human visualization,which is not possible with other satellite techniques (Figure (1) a,b).Figure (1) a, bFigure (2) a, b
The four Space Shuttle images (numbers 2340, 2341, 2342, 2343) were taken consecutively of the same oil spillfrom different angles and locations, show extensive oil slick, in the shallow water surface, close to the shore. Thefirst image shows the initial stage of the spill. The oil slick appeared larger in each image as it is spreading withrespect to time. The dark heavy oil spill seems to be sufficiently thick, which can be identified as crude oil, as therewas no significant gapes exist in the main slick (Figure (2) a,b).Winds and current forces pushed three small oil slicks to the shore. The sea wave patterns show that the wave’sdirection in curved lines paralleled to the shore boundaries and two long oil streaks appear related to wave direction.The upper right line, appears perpendicular on the waves direction, which seams to be traces of a ship track movingaway from the spill, the line seems sharper toward the slick direction and thinner as it go further away from the spilllocation. The wave patterns grow and persist for a long time after a ship passes (Figures 1,2).1.2 AISA Hyperspectral SensorThe AISA Airborne Imaging Spectrometer is a push-broom style, hyperspectral system measuring up to 288bands of continues visible to IR wavelengths. 25 bands were selected for our image processing. The data wasderived from the Pipco oil company project for pollution protection for Patuxent River in Maryland (Figure 3). Forhigh spatial and spectral resolution requirements, the Airborne Imaging Spectro-radiometer for Applications (AISA)sensor system gets more information out of each pixel of data -more detail, finer imagery and faster turnaround thanfrom other multi-spectral systems or traditional methods of monitoring. The use of AISA data for identifyingspectral signatures for oil spill and oil contaminated areas, can be more successful than traditional methods. Timesequence images of the oil can guide efforts in real-time by providing relative concentrations and accurate locations(Galt, 1994). Environmentally sensitive sites such as wetland can be quickly and accurately mapped, measured, andcharacterized. AISA can be used to build a spectral library for oil spill on water and land for areas, whichcontaminated by oil. The Spectral signature can be used for identifying shoreline features specially areas which areenvironmentally sensitive, and determine the level of oil contamination (heavy or moderate) areas onshore. This canbe useful for focusing cleanup processes.Figure (3) shows an AISA hyperspectral image in Patuxent River for an oil spill due to a petroleum pipeline break,and also the contaminated offshore areas (Maryland April 2000)1.3 Hyperspectral DataHyperspectral sensors such as the Airborne Imaging Spectroradiometer for Applications (AISA) enabled theconstruction of an effective, continuous reflectance spectrum for every pixel in the scene. These systems can be usedto discriminate among earth surface features. Hyperspectral sensors afford the potential for detailed identification ofmaterials and better estimates of their abundance. This can eliminate the false alarms of features, which may be
identified by mistake as a suspected oil spill with other conventional sensors (McFarland et. al.,1993).Hyperspectral sensing can record over 200 selected wavelengths of reflected and emitted energy. With this spectralinformation one can exploit the spectral signature of oil to detect minute concentrations of hydrocarbon on the seasurface, and also to distinguish between different crude oil concentrations. Applications of the hyperspectral sensinginclude determination of contaminated soil wetlands, shallow water, sand beaches, and shoreline that enables theidentification of features with high spatial and spectral resolution. HSI can provide high quality data for analyzingthe complex variability of landscape surface cover in different global environments. However, The application oftraditional multispectral data analysis tools to hyperspectral data has not yielded satisfactory results because ofmathematical and practical limitations.2.MethodologyThe Hyperspectral images are used to detect oil spill and determine characteristics of the substance spilled, andto make predictions of the spread or mitigation success. The tasks involved are:1.Predict oil spill spread direction and flow rate characteristics: Hyperspectral image analysis for oilspills must be fast and timely for operational environmental monitoring. The airborne HSI temporal imageprocess predicts how oil spills disseminate within a particular body of water, under current environmentalconditions, and where it might affect sensitive sites, such as coastal wetlands.2.Identify shoreline features and the severity of oil spills: With its high spectral and spatial resolution,HSI can be used to identify shoreline features, and areas damaged due to spilled oil. Areas impacted areenvironmentally sensitive, e.g., wetlands with shallow water, sea-grass, salt marshes, tidal-flats, waterways,or sandy beaches with significant biodiversity therein.3.Determine the pollutant type: The oil characteristics (e.g., oil types and concentration) are important tohelp the cleanup crews identify the best cleanup method, the environmental impacts of burning oil, and themodeling techniques (to predict the flow path, dispersion rates, and time before the slick hits the shoreline)(Jordan and Payne, 1980). For example, an oil type can be crude or light oil and the evaporation rate of thelight fuel is faster than crude oil, but it could be more toxic for the marine species (Massin, 1998).2.1 Spectral Angle Mapper (SAM) MethodThe Spectral Angle Mapper (SAM) is a signature matching method is used for identifying oil spills and oildispersant in water and shoreline. Real time analysis of the images allows field checks in the rapidly changing waterconditions due to wind, current and tides. HSI is used to extract specific spectral signatures in order to build aspectral library for different oil types on water, wetland, and vegetation contaminated by oil spills. It can also beused to determine the level of oil contamination onshore (Figure 4). Spectral Angle Mapper (SAM) classification isa physically based spectral classification that uses the N-dimensional angle to match pixels to reference spectra. Thealgorithm determines the spectral similarity of two spectra by calculating the angle between them. The advancedimage processing software, ENVI, is used for image analysis.2.2 Information Extraction of Hyperspectral DataThe basic approach has been to seek a more fundamental understanding of high dimensional signal spaces in thecontext of multispectral remote sensing, and then to use this knowledge to extend the methods of conventionalmultispectral analysis to the hyperspectral domain in an optimal or near optimal fashion. The introduction ofhyperspectral sensors that produce much more detailed spectral data than those previously provide much enhancedabilities to extract useful information from the data stream that they produce. In theory, it is possible to discriminatesuccessfully between any specified set of classes of data by increasing the dimensionality of the data far enough. Infact, current hyperspectral data, which may have from a few 10’s to several hundreds of bands, essentially make thispossible (Landgrebe, 1998). However, it is also the case that this more detailed data requires more sophisticateddata analysis procedures if their full potential is to be achieved. Much of what has been learned about the necessaryprocedures is not particularly intuitive, and indeed, in many cases is counter-intuitive. In this paper, we shall attemptnot only to illuminate some of these counter-intuitive aspects, but also to point the direction for practical methods tomake optimal analysis procedures possible.
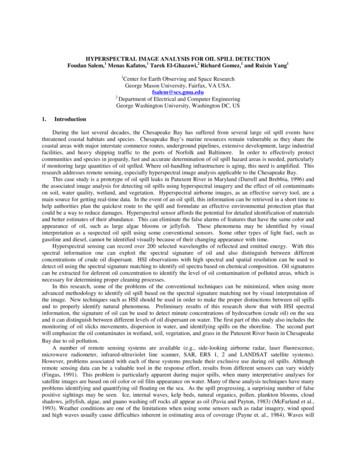
Extracting Oil SpectrumFigure (4) shows the oil on water spectra in red, oil on land spectra in green, polluted water spectra in gray and clearwater spectra in cyan. The oil and water spectra extracted from the image create the spectral library; the spectra areused as an endmember collection to train the Spectral Angle Mapper classifier.Figure (5) Oil dispersant spectra appeared in red, cyan and green shows that high absorption at 670 nm indicatedhigh oil concentrations compared with the turbid water spectra (appeared in brown, light green, and blue) whichshows high reflectance at 580 nm.
As shown in Figure (5) that high oil concentration increases the absorption of light and decrease the reflectancein the visible bands. In the opposite of turbid water have higher reflectance in the visible bands and less absorptionin the near IR bands. The water reflectance range is between the two other types.2.3 Ground TruthPhotography of locations of all zones of sampling and measurement from the air, were used to familiarize theanalyst with the materials that exist within the imaged boundaries. In order to successfully identify classes fromunsupervised classification results or to create appropriate representative classes (or training sites). Such efforts alsoallow us to narrow the processing, and analysis focus to a smaller region of the imagery. For extracting theendmembers signatures, the identification and distribution of materials in the field is suggested. In addition, groundtruth information that corresponds with the day of data acquisition allows the developing of quantitativerelationships between materials on the ground and that which is measured by the remote sensing instrument. Theserelationships may allow for actual estimates of material densities and amounts.2.4 Oil Spectra Features AnalysisThere are a number of interesting features in the oil spectral which will enable algorithms to be formed for thisoil type (Salisbury, 1993). There is a specific peak at 580 – 600 mµ represent the absorption of the dispersant oil,increasing concentration of oil causes a linear dip in the peak at 675-685 mµ (Figure 5). At increasing theconcentration of oil on water the dip levels out so that it will be used a good marker for high and low concentrationof oil. The dispersant oil give very strong reflectance at 580 mµ and 700 mµ in the visible and near IR . In the blueband there is a reflectance for water at 800 mµ and there is the water absorption at 670 mµ which providesinformation about the total concentration of oil and water turbidity near shore line.3.ResultsIt was demonstrated from our results that by using Spectral Angle Mapper classification technique, thesignatures for different concentrations of crude oil and oil dispersant can be matched as long as the sample has highconcentration of hydrocarbons as shown in Figure (6) and may not match for light oils such as diesel or gasoline.The model is reliable for distinguishing between different concentrations of crude oil based on the oil spectra foreach type of oil spills as shown in Figure (7). Using oil spectra on land allows us to identify the contaminated areaswith oil spill on the shoreline (Figure 8). The classified image also indicated that features similar to oil wasappeared in areas used for storing coal inside the Maryland Power station, the results confirmed that materials whichhave the same chemical composition such as coal (carbon), have the same signature as oil (hydrocarbons). Finally,ground truth information (Figure 9) provides the basis for post-processing accuracy assessments.Figure (6) The class image shows heavy oil slicksappeared in red color on the river and the small streamsFigure (7) One of the rule images shows dispersed oiland polluted water appeared in black
Class ImageFigure (8)Figure (9)Figure (8) shows two classes, white indicted heavy oil slicks on water, it appear close to the shore outline, andred color represents oil spills on land and on the river edges due to the pipeline break.Figure (9) shows picture was taken on the same time of oil spill event is used as ground truth for comparingresults.4.Summary and Conclusions1.2.3.4.5.6.5.Using hyperspectral imagery as an advanced remote sensing technology is more reliable to minimize thelimitations of conventional remote sensing techniques for detecting oil spill.The visual interpretation of the space shuttle images shows many limitations such as changing in oilappearance with time, image glare due to sun angle, and other natural phenomena would result in the sameappearance as oil spill due to weather difficulties.The results of this research show that the signature matching method is more accurate than the conventionaltechniques, which base on the visual interpretation of oil color and the appearance in the space shuttleimages.HSI spectral information is used to distinguish between different concentrations of oil dispersant fordifferent levels of oil pollution. The signature of oil is used to detect minute concentrations of hydrocarbon(crude oil).For oil spill image analysis, Spectral Angle Mapper classification is more accurate than other supervisedclassification techniques. When the training samples are selected from the image based on the pixels color,the classification may be misled. Signatures matching technique can distinguish between materials basedon its chemical composition not by visual appearance. This allows more confidence in the classificationresults.Hyperspectral imagery is fast and timely for operational environmental monitoring for oil compared withspace-borne systems. The airborne HSI temporal image processes predicts how oil spills disseminate withina particular body of water, under current environmental conditions, and where it might affect sensitivesites, such as coastal wetlands.Future work1- Accuracy assessment will be applied on the classification results for several techniques, and evaluation for eachclassification performance will show the accuracy level for each method.2- The linear un-mixing signature method will be used to identify contaminated coastal features, to distinguishbetween mixed signatures for different materials such as grass, water, and soil contaminated with oil.
6.ReferencesDarrell, L., Majedi, B., Lizárraga, J., and Blomquist, J. (1996). Nutrient and suspended-sediment concentrations,trends, loads, and yields from the non tidal part of the Susquehanna, Potomac, Patuxent, and Chop tank rivers, 198596 By USGS Water-Resources Report 98-4177Galt, J. A. (1994). Trajectory Analysis for Oil Spills, J.Adv. Mar.T. Conf.11, pp.91-126Fingas, Merv (1991). The Technology of Oil Spill Remote Sensing, U.S. Coast Guard Oil Spill Remote SensingWorkshop, ERIM Report # 213259.Jordan, R. and Payne, J.R. (1980). Fate and Weathering of Petroleum Spills in the Marine Environment. Science.P. 1-12.Landgrebe, D. (1998). Information Extraction Principals and Methods for Multispectral and Hyperspectral ImageData, Information processing for Remote Sensing, World Scientific Publishing Co. Inc., NJ, USA.Massin, J. (1998). Remote Sensing for the control of Marine Pollution. Plevum. P 237-295.McFarland, B., Murphy, J. and D. Simecek-Beatty (1993). Conventions for reporting and Displaying over flightObservations, proceedings from the 1993 Oil Spill Conference, (Prevention, Behavior, Control, Cleanup), Tampa,Florida, Mar. 29-Apr. 1, 1993, pp.789-790Ministry of Transport (1992). Visibility Limits of Oil Discharges: Investigation into the Visibility Limits ofOperational Oil Discharges from Ships, Ministry of Transport. Public Works and Water Management, TheNetherlands, pp. 43.Pavia, R. and D. Payton (1983). An Approach to Observing Oil at Sea, Proceedings from the 1983 Oil SpillConference, (Prevention, Behavior, Control, Cleanup), San Antonio, Texas, Februry.28- Marsh 3, 1983, pp.345-348.Payne, J. and D. Mcnabb, Jr. (1984). Weathering of Petroleum in the marine environment, Marine technicalsociety journal, and 18(3), pp.24-42.Salisbury, John W., Dana M. D'Aria, and Floyd F. Sabins, Jr. (1993). Thermal infrared remote sensing of crudeoil slicks. Remote Sens Environ. 45:225 231.Schriel, R. (1987). Operational Air Surveillance and experiences in the Netherlands, Proceedings from the 1987 OilSpill conference, Tenth Biennial, (Prevention, Behavior, control, Cleanup), Baltimore, Maryland, April 6-9, 1887,pp.129-136.
Foudan Salem,1 Menas Kafatos,1 Tarek El-Ghazawi,2 Richard Gomez,1 and Ruixin Yang1 1Center for Earth Observing and Space Research George Mason University, Fairfax, VA USA. . from other multi-spectral systems or traditional methods of monitoring. The use of AISA data for identifying spectral signatures for oil spill and oil contaminated areas .