Transcription
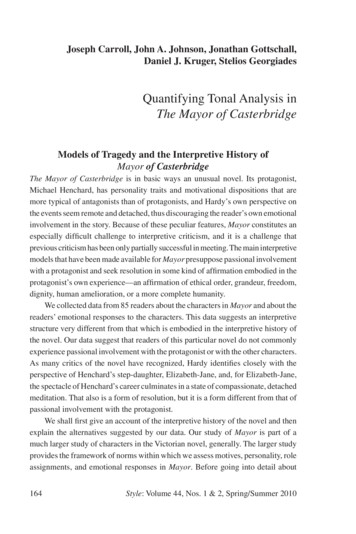
Quantifying the impact of network congestion onapplication performance and network metricsYijia Zhang , Taylor Groves† , Brandon Cook† , Nicholas J. Wright† and Ayse K. Coskun †Boston University, Boston, MA, USA; E-mail: {zhangyj, acoskun}@bu.eduNational Energy Research Scientific Computing Center, Berkeley, CA, USA; E-mail: {tgroves, bgcook, njwright}@lbl.govAbstract—In modern high-performance computing (HPC) systems, network congestion is an important factor that contributesto performance degradation. However, how network congestionimpacts application performance is not fully understood. AsAries network, a recent HPC network architecture featuringa dragonfly topology, is equipped with network counters measuring packet transmission statistics on each router, these network metrics can potentially be utilized to understand networkperformance. In this work, by experiments on a large HPCsystem, we quantify the impact of network congestion on variousapplications’ performance in terms of execution time, and wecorrelate application performance with network metrics. Ourresults demonstrate diverse impacts of network congestion: whileapplications with intensive MPI operations (such as HACC andMILC) suffer from more than 40% extension in their executiontimes under network congestion, applications with less intensiveMPI operations (such as Graph500 and HPCG) are mostly notaffected. We also demonstrate that a stall-to-flit ratio metricderived from Aries network counters is positively correlated withperformance degradation and, thus, this metric can serve as anindicator of network congestion in HPC systems.Index Terms—HPC, network congestion, network countersalso demonstrate that certain Aries network metrics are goodindicators of network congestion.The contributions of this work are listed as follow: In a dragonfly-network system, we quantify the impact ofnetwork congestion on the performance of various applications. We find that while applications with intensive MPIoperations suffer from more than 40% extension in theirexecution times under network congestion, the applicationswith less intensive MPI operations are negligibly affected. We find that applications are more impacted by congestoron nearby nodes with shared routers, and are less impactedby congestor on nodes without shared routers. This suggeststhat a compact job allocation strategy is better than a noncompact strategy because sharing routers among differentjobs is more common in a non-compact allocation strategy. We show that a stall-to-flit ratio metric derived from Ariesnetwork tiles counters is positively correlated with performance degradation and indicative of network congestion.I. I NTRODUCTIONHigh-performance computing (HPC) systems play an important role in accelerating scientific research in various realms.However, applications running on HPC systems frequentlysuffer from performance degradation [1]. Network congestionis a major cause of performance degradation in HPC systems [2]–[4], leading to extention on job execution time 6Xlonger than the optimal [5]. Although performance degradationcaused by congestion has been commonly observed, it is notwell understood how that impact differs from application toapplication. Which network metrics could indicate networkcongestion and performance degradation is also unclear. Understanding the behavior of network metrics and applicationperformance under network congestion on large HPC systemswill be helpful in developing strategies to reduce congestionand improve the performance of HPC systems.In this paper, we conduct experiments on a large HPCsystem called Cori, which is a 12k-node Cray XC40 system.We run a diverse set of applications while running network congestors simultaneously on nearby nodes. We collectapplication performance as well as Aries network countermetrics. Our results demonstrate substantial difference in theimpact of network congestion on application performance. WeII. A RIES NETWORK COUNTERS AND METRICS978-1-7281-6677-3/20/ 31.00 2020 IEEEIn this section, we first provide background on the Aries network router. Then, we introduce our network metrics derivedfrom Aries counters. The value of these metrics in revealingnetwork congestion is evaluated in Section IV.A. Aries network routerAries is one of the latest HPC network architectures [6].Aries network features a dragonfly topology [7], where multiple routers are connected by row/column links to form a virtualhigh-radix router (called a “group”), and different groups areconnected by optical links in an all-to-all manner, givingthe network a low-diameter property, where the shortest pathbetween any two nodes is only a few hops away.Figure 1 shows the 48 tiles of an Aries router in a CrayXC40 system. The blue tiles include the optical links connecting different groups; the green and grey tiles include theelectrical links connecting routers within a group; and theyellow tiles include links to the four nodes connected to thisrouter. In the following, we call the 8 yellow tiles as processortiles (ptiles); and we call the other 40 as network tiles (ntiles).B. Network metricsIn each router, Aries hardware counters collect various typesof network transmission statistics [8], including the number of
TABLE I: Aries network counters used in this work [8].AbbreviationN STALL r cN FLIT r c vP REQ STALL nP REQ FLIT nP RSP STALL nP RSP FLIT nFull counter nameAR RTR r c INQ PRF ROWBUS STALL CNTAR RTR r c INQ PRF INCOMING FLIT VCvAR NL PRF REQ PTILES TO NIC n STALLEDAR NL PRF REQ PTILES TO NIC n FLITSAR NL PRF RSP PTILES TO NIC n STALLEDAR NL PRF RSP PTILES TO NIC n FLITSIII. E XPERIMENTAL METHODOLOGYFig. 1: Aries router architecture in a dragonfly network.flits/packets travelling on links and the number of stalls thatrepresent wasted cycles due to network congestion.In this work, we use a stall-to-flit ratio metric derived fromntile counters. As the number of network stalls represents thenumber of wasted cycles in transmitting flits from one routerto the buffer of another router, we expect the stall/flit ratioto be an indicator of network congestion. For each router, wedefine the ntile stall/flit ratio as:We conduct experiments on Cori, which is a 12k-nodeCray XC40 system located at the Lawrence Berkeley NationalLaboratory, USA. On Cori, network counter data are collectedand managed by the Lightweight Distributed Metric Service (LDMS) tool [9]. LDMS has been continuously runningon Cori and collecting counter data for years for every node.The data collection rate is once per second.To characterize job execution performance, we experimentwith the following real-world and benchmark applications: Ntile Stall/Flit RatioN STALL r cv 0.7 N FLIT r c v Avgr 0.4,c 0.7 PHere, N FLIT r c v is the number of incoming flits persecond to the v-th virtual channel of the r-th row, c-th columnnetwork tile. N STALL r c is the number of stalls per secondin all virtual channels on that ntile. As the stalls and flitscollected from a specific ntile cannot be attributed to a certainnode, we take an average over all the 40 ntiles (representedas “Avg”) and use it as the ntile stall/flit ratio of the router.Because the 40 ntiles are the first 5 rows and all 8 columns inFig. 1, the metric takes the average for r 0.4, and c 0.7.In comparison to ntile counters, we also analyze ptile flitsper second collected by P REQ FLIT n and P RSP FLIT n,which are request and response flits received by a node,respectively. In this paper, we always take the sum of these twometrics when we refer to ptile flit-per-second. Similarly, werefer to the sum of P REQ STALL n and P RSP STALL nas the ptile stalls per second. In these metrics, n 0.3corresponds to the four nodes connected with this router. Thus,ptile counters specify the contribution from a certain node. Thefull names of the counters we mentioned are listed in Table I.The original counters record values cumulatively, so we takea rolling difference to estimate instantaneous values.In addition, when we calculate stall/flit ratio, we ignore thesamples where stall-per-second is smaller than a threshold.This is because when both the stall and the flit number ina second are too small, the stall/flit ratio could occasionallysurge while it does not reflect influential congestion. We setthe threshold as the median stall-per-second value of datataken over a three-month period from the entire system. Forelectrical link ntiles and optical link ntiles, the thresholds are5410794 and 933, respectively. Graph500. We run breadth-first search (BFS) and singlesource shortest path (SSSP) from Graph500, which arerepresentative graph computation kernels [10].HACC. The Hardware Accelerated Cosmology Code framework uses gravitational N-body techniques to simulate theformation of structure in an expanding universe [11].HPCG. The High Performance Conjugate Gradient benchmark models the computational and data access patternsof real-world applications that contain operations such assparse matrix-vector multiplication [12].LAMMPS. The Large-scale Atomic/Molecular MassivelyParallel Simulator is a classical molecular dynamics simulator for modeling solid-state materials and soft matter [13].MILC. The MIMD Lattice Computation performs quantum chromodynamics simulations. Our experiments use thesu3 rmd application from MILC [14].miniAMR. This mini-application applies adaptive meshrefinement on an Eulerian mesh [15].miniMD. This molecular dynamics mini-application is developed for testing new designs on HPC systems [15].QMCPACK. This is a many-body ab initio quantum MonteCarlo code for computing the electronic structure of atoms,molecules, and solids [16].To create network congestion on HPC systems in a controlled way, we use the Global Performance and CongestionNetwork Tests (GPCNeT) [17], which is a new tool to injectnetwork congestion and benchmark communication performance. When launched on a group of nodes, GPCNeT runscongestor kernels on 80% of nodes, and the other 20% runsa canary test in a random-ring or allreduce communicationpattern [17] to evaluate the impact of the congestor kernel.Our experiments run the RMA Broadcast congestor kernel. Bycomparing running the canary test in isolation with runningthe canary test together with congestor kernels, GPCNeTreports the intensity of congestion by the following impactfactor metrics: bandwidth ratio, latency ratio, and allreducebandwidth ratio. For example, bandwidth ratio represents the
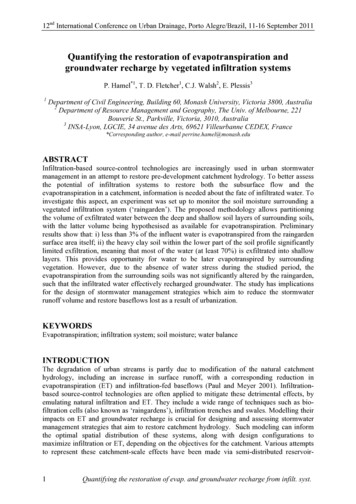
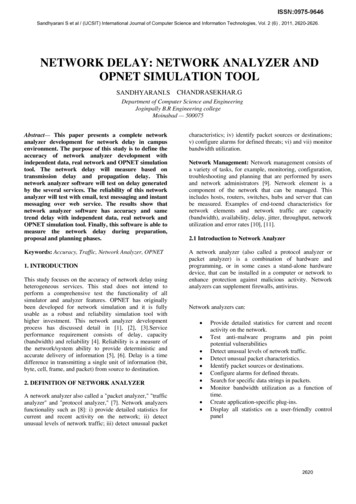
Fig. 2: The four experimental settings. Each square is a node.Blue squares run a parallel application. Grey squares run theGPCNeT congestor. White ones are idle.canary test’s effective bandwidth when running with congestor,divided by the bandwidth when running in isolation.We quantify the impact of network congestion on applications by comparing the execution time of the applicationswhen running them with or without congestors. We also differentiate between endpoint congestion and intermediate congestion. Endpoint congestion refers to the congestion generatedby traffic from other nodes that share the same routers as ourapplication. Intermediate congestion refers to the congestioncaused by traffic not from nodes sharing the same routers butfrom intermediate links. We design experiments as follows.Assume we are going to run an application on N nodes (weuse N 7 in Fig. 2 as an example, and we actually experimentwith N 64), then we reserve 3N nodes from the system.Most of these 3N nodes are groups of consecutive nodes as theSlurm scheduler on Cori is configured to prioritize reservingconsecutive nodes. We have four experimental settings shownin Fig. 2 and described below: In Setting I (“Continuous”), we run the application on Nnodes continuously selected from the list (shown in blue),and the other 2N nodes are left idle. In Setting II (“Spaced”), we run the application on N nodesselected by choosing every other node from the list. In Setting III (“Continuous Congestor”), besides the application in a “continuous” way, we simultaneously runGPCNeT on another N nodes selected in a “spaced” manner(shown in grey). In this case, the application is mostlyaffected by intermediate congestion because the majority ofblue nodes do not share routers with grey nodes. In Setting IV (“Spaced Congestor”), the nodes for theapplication and the nodes for the congestor are interleaved.In this case, the application is also affected by endpointcongestion because sharing router among application nodesand congestor nodes is common. As an example, assumethe dashed line shows the four nodes connected to the samerouter, then, the two grey nodes create endpoint congestionon the other two blue nodes. Although every four nodes arenot always connected to the same router, because Cori’sscheduler prioritizes allocating contiguous nodes for us,nodes sharing the same router are common.Fig. 3: To mitigate variations from background traffic, we repeat experiments with the placement of application/congestorrotationally shifted (first three shifts for Setting III are drawn).In our experiments, we always run an application on 64nodes, and the congestor also occupies 64 nodes. We did notexperiment with larger workloads to avoid too much impacton other users in a production system. All experiments run onHaswell nodes and use all 32 cores of each node. The sameinputs are used during different runs of an application.Since the experiments are done in a production system, network traffic generated by jobs from other users may go throughthe routers we use. To reduce the impact of this backgroundtraffic, we repeat each setting 10 times by rotationally shiftingthe application’s and congestor’s placement, as illustrated inFig 3. Each shift rotates 1/10 of the node list length.In addition to the experiments discussed above, we alsoexperiment with GPCNeT alone without our applications, andthe details are discussed in Section IV-C.IV. R ESULTS AND DISCUSSIONIn this section, we first analyze the impact of networkcongestion on applications in Section IV-A. Next, we show thecorrelation between network metrics and application executiontime in Section IV-B. Then, we show that ntile stall/flit ratio iscorrelated with network congestion intensity in Section IV-C.A. Impact of network congestion on applicationsFigure 4 summarizes the impact of network congestion onapplications. The execution times are normalized separatelyfor each application with regard to the median value in SettingI. Because LAMMPS’s values exceed the range of Fig. 4(a),we also draw them separately in Fig. 4(b).These results demonstrate that network congestion hasdiverse impact on applications. Some applications such asGraph500 and HPCG are negligibly affected by congestion,where the median execution time difference between withand without congestor is less than 10%. On the other hand,applications including HACC, LAMMPS, MILC, miniAMR,and miniMD are significantly affected by congestion, wherethe median performance with endpoint congestion (SettingIV) is 0.4X to 7X higher than the performance withoutcongestion (Setting II). QMCPACK shows a medium-levelimpact from congestion, where endpoint congestion extendsthe median execution time by 11%. The slightly shorter
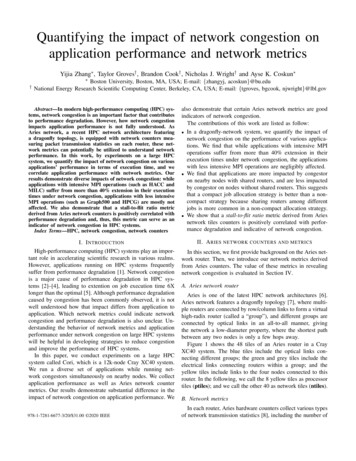
2.5I:ContinuousII:SpacedIII:Continuous CongestorIV:Spaced Congestor12102.01.51.00.5LAMMPS Execution Time (normalized)Normalized Execution Time(separately for each plications in different experiment settings(a)miniMDQMCPACK864210LAMMPSExperiment settings(b)Fig. 4: Normalized application execution time under four experimental settings. Normalization is done separately for eachapplication. Each bar summarizes the 10 runs for an application. Errorbars are min/max; edges of box are the first and thirdquartiles; middle line is the median. Setting IV of LAMMPS exceeds the range and it is separately drawn in (b).execution time in Setting II of HACC and Setting IV of HPCGshould be due to variations caused by background traffic.To understand why applications are impacted differently,we use CrayPat [18] to profile the MPI characteristics ofthe applications (in separate runs without congestor). Table IIshows the percentage of time spent on certain MPI operations,and Table III shows the aggregate bytes transferred per second,average message size, and MPI call counts.From Table II, we see that the applications impactedmore by congestion, including HACC, LAMMPS, MILC,miniAMR, and miniMD, share a common feature of moretime spent on MPI operations. On the contrary, HPCG andQMCPACK have only 3.7% and 6.0% time on MPI operations, respectively. In addition, more MPI collective operations (such as MPI Allreduce, MPI Bcast) implies moreintensive communication, making the application sensitive tocongestion. Therefore, as LAMMPS spends 25.4% time onMPI Allreduce, larger than any other applications, its execution time is extended by more than 7X in Setting IV. Similarly,QMCPACK has 5.4% time on MPI Allreduce, higher thanthe 0.2% from HPCG, which explains why QMCPACK isimpacted more by congestion than HPCG. On the other hand,Graph500 has only 2.3% time on MPI Allreduce, and lessthan 8% time on all other MPI calls except for MPI Test,which explains why it is only slightly affected by congestion.These findings suggest several key criteria for predictingcongestion’s impact on an application. The first is the amountof time an application spends performing MPI operations.Intuitively, an application not spending much time on communication will not be sensitive to congestion. Secondly, thetype of communication matters. In our experiments, when collectives such as MPI Allreduce, MPI Bcast, and MPI Barrieroccupy more than 5% of time, we regard the application ashaving intensive MPI operation and expect it to be sensitive tocongestion. Lastly, MPI Wait(all) is important as they oftenindicate synchronization points where the slowest communication dominates performance (as is the case with MILC).Conversely, though Graph500 performs reasonable amountsof communication, the communications are uncoupled fromeach other as MPI Test(any) calls indicate communicationevents that are completely independent of many other communications. Applying this understanding to Table II, weconsider HACC, LAMMPS, MILC, miniAMR, miniMD, andQMCPACK as having intensive MPI operations.From Table III, we see the relationship between averagemessage size and sensitivity to congestion is not clear. HACC,LAMMPS and MILC use very different message sizes buteach seems sensitive to congestion. Other studies have foundthat small-size, latency-sensitive communications are moresensitive to congestion than bandwidth benchmarks typicallywith large message size [17]. However, this relationship is notas clear cut for real applications.Based on our results, aggregate data transfer rate is notindicative of congestion sensitivity either. For example, although Graph500 transfers data at 50 MB/s, it is less impactedby congestion than LAMMPS and QMCPACK which transferdata at merely 5 MB/s and 600 KB/s, respectively.From Fig. 4, we also notice that the applications aremore impacted by endpoint congestion than by intermediatecongestion. Comparing Setting II with IV, we see HACC,LAMMPS, MILC, miniAMR, miniMD, and QMCPACK areall significantly impacted by endpoint congestion. ComparingSetting I with III, we see only MILC and miniMD are significantly impacted by intermediate congestion. This observationsuggests that a compact job allocation strategy is better than anon-compact one because a non-compact allocation increasesa job’s probability to share routers with other jobs and aremore likely to suffer from endpoint congestion.B. Correlating network metrics with application performanceFrom the same experiments in Section IV-A, we correlateexecution time with ntile stall/flit ratio in Fig. 5. Each crossrepresents the average value of the ten runs in each setting, anderrorbars show their standard error. The ntile stall/flit ratio iscalculated using the formula in Section II-B, and averaged only
TABLE II: Application MPI profiles collected by CrayPat. “MPI Operation” shows the percentage of execution time spent onMPI operations, and the MPI call breakdown is shown in other columns. “MPI (other)” is the sum of other MPI calls notspecified here. Applications with more time spent on MPI operations, especially MPI collective operations (MPI Allreduce,MPI Bcast, MPI Barrier, etc.), are impacted more by network congestion than applications with less intensive MPI operations.ApplicationMPI OperationMPI CPACK31.4%67.1%3.7%47.3%61.9%26.8%83.4%6.0%2.3% 0.1%0.2%25.4%1.9%9.2%0.5%5.4%MPI Sendrecv(or Send, Isend)2.6%0.2%2.1%8.6%0.6%0.5%82.5% 0.1%MPI Bcast0.2%00 0.1% 0.1% 0.1%0 0.1%MPI Test(or Testany)21.3%000000 0.1%MPI Wait(or Waitall) 0.1%66.2%1.2%12.2%58.5%14.2%0 0.1%MPI BarrierMPI (other)4.4%00 0.1% 0.1%00.2%0.5%0.6%0.7%0.2%1.1%0.9%2.9%0.2%0.1%TABLE III: Execution time, aggregate data transfer rate, average message size, and MPI call counts collected by CrayPat.Columns starting with “MPI ” are breakdown of “MPI Call”. Non-dominant MPI call types are not listed. “Exec Time” is themedian of the 10 runs in Setting I. “Agg Data Trans Rate” shows the aggregate bytes of data transferred per second.ApplicationExec TimeAgg Data Trans RateAvg Msg Sz.MPI CallMPI CPACK122 s69 s68 s15 s87 s23 s65 s67 s50 MB/s100 MB/s3 MB/s5 MB/s90 MB/s40 MB/s90 MB/s600 KB/s9 KB6 MB4 KB70 B16 KB22 KB3 KB13 004(a) HACC(b) LAMMPS(c) MILCMPI Sendrecv(or Send, 036390MPI Test(or Testany)43,852,0630000002,697MPI Wait(or Waitall)22,74840,353812,6731,056,15235,5400195(d) miniAMRFig. 5: There are positive correlations between ntile stall/flit ratio and application execution time. A cross represents the averageof 10 runs for each setting. Errorbars are standard errors. The dashed line is a linear fit. These positive correlations suggestthat ntile stall/flit ratio metric is indicative of performance degradation caused by network congestion.over routers that contain nodes running our application. Themetric is also averaged over the duration of the application.In each case, we notice a positive correlation between jobexecution time and ntile stall/flit ratio, which demonstrates thatthis metric is indicative of application performance. Becausethe ntile counters collect not only local communications directly related to the host router but also communications thattravel through the host router as an intermedium, our metric isonly statistically correlated with job performance and suffersfrom variations caused by background traffic.We also show the stall per second values on either ntilesor ptiles in Fig. 6. The stall count is averaged over routersand durations. While ntile stall per second shows a similartrend as ntile stall/flit ratio, the ptile stall per second showsa negative correlation with execution time. Although thisnegative correlation seems counter-intuitive at first thought,it in fact implies that ntile links, instead of the ptile-to-nodelinks, are the communication bottleneck in these experiments.When ntiles are the bottleneck, performance degradationcauses an application to run slower and receive less messagesper second. As a result, there are less flits per second in theptile-to-node links. Less flits per second leads to less stallsper second on ptiles since these ptile-to-node links are not thebottleneck. Another way to explain the phenomenon is thatthe convergence of traffic occurs before the final hop within aswitch. Once traffic makes it past the bottleneck, the rest of thepath is relatively clear. This explains the negative correlationwe see in Fig. 6(c,d). Therefore, we conclude that ntile metricsare better indicators for congestion than ptile metrics sincentiles links, rather than ptiles, are mostly the bottleneck.C. Correlating network metrics with network congestorsWe also conduct experiments that run GPCNeT on either 16,32, 64, 86, 106, or 128 nodes without our applications. We use
(a) miniMD - Ntile Stall(b) QMCPACK - Ntile Stall(c) miniMD - Ptile Stall(d) QMCPACK - Ptile StallFig. 6: There are positive (negative) correlations between ntile (ptile) stalls per second and application execution time,respectively. The negative correlations in (c) and (d) imply that ptile-to-node links are not the bottleneck of the network.50Ntile Stall/Flit oder 2 0.92201005101520GPCNeT Impact Factor (BWAvg)Fig. 7: Correlating ntile stall/flit ratio with GPCNeT congestorimpact factor. Different colors represent experiments where werun GPCNeT on different number of nodes.the impact factor metrics reported by GPCNeT to quantify theintensity of congestion created by GPCNeT. Figure 7 showsthe correlation between impact factor (bandwidth ratio) andntile stall/flit ratio. Each point represents an experiment run.The ntile stall/flit ratio is averaged similarly as before. Wesee a rough correlation between GPCNeT congestion intensity(quantified by impact factor) and ntile stall/flit ratio, whichdemonstrates that ntile stall/flit ratio is indicative of networkcongestion created by GPCNeT.V. R ELATED WORKNetwork contention/congestion is an important topic in HPCresearch. It has been reported that, on HPC systems, inter-jobnetwork contention causes performance variability as high as2X [2], 2.2X [3], 3X [4], or 7X [5]. Analysis has shown thatnetwork contention, rather than other factors such as OS noise,is the dominant reason for performance variability [2]–[4].Some prior works have analyzed the statistics of flit orstall counts on HPC systems. Jha et al. analyzed packet andstall count on a 3d-torus network and provided a visualizationmethod to identify network hot spots [19]. Brandt et al.measured network stall/flit ratio and showed its variationacross links and over time [20]. These works have not analyzedthe relation between network counters and job performance.A few works have explored the relation between networkmetrics and job performance using machine learning. Jainet al. trained tree-based classifiers to predict job executiontime on a 5d-torus system [21], [22]. They found that buffersand injection FIFOs are important metrics and that the hopcount metric is not helpful in predicting performance. OnCori, Groves et al. demonstrated strong correlations betweencommunication latency and Aries network counters [23]. Theybuilt machine learning models to forecast sub-optimal performance and identified network counters related to performancevariability [4]. Machine learning methods in this domain oftenfocus on predicting performance or other outcomes; in contrast, our work’s focus is on providing an analysis on selectednetwork counters’ role in understanding job performance.On dragonfly systems, prior works have also studied various system setup or management factors that affect jobperformance. These factors include job allocation [24]–[27],task mapping [28], [29], routing algorithm [30]–[33], linkbandwidth [34], global link arrangement [35], [36], etc.VI. C ONCLUSIONIn this work, we show that applications demonstrate substantial difference under network congestion. Applicationswith intensive MPI operations suffer from 0.4X to 7X extension in execution times under network congestion, whileapplications with less intensive MPI operations are negligiblyaffected. By analyzing Aries network counters, we observea positive correlation between network-tile stall/flit ratio andapplication execution time, which demonstrates that this metricis indicative of network congestion and job performance. Wealso show that processor-tile metrics are not good indicatorsbecause processor-tile-to-node links are mostly not the bottleneck in our experiments. This work enhances our understanding of application performance under congestion and forms thenecessary basis for rational design of congestion-aware HPCsystem scheduling based on network metrics.ACKNOWLEDGMENTThis research used resources of the National Energy Research Scientific Computing Center, which is supported bythe Office of Science of the U.S. Department of Energy underContract No. DE-AC02-05CH11231.
R EFERENCES[1] D. Skinner and W. Kramer, “Understanding the causes of performancevariability in hpc workloads,” in IEEE International. 2005 Proceedingsof the IEEE Workload Characterization Symposium, 2005., 2005, pp.137–149.[2] A. Bhatele, K. Mohror, S. H. Langer, and K. E. Isaacs, “There goesthe neighborhood: Performance degradation due to nearby jobs,” inProceedings of the International Conference on High PerformanceComputing, Networking, Storage and Analysis, ser. SC ’13. New York,NY, USA: ACM, 2013, pp. 41:1–41:12.[3] S. Smith, D. Lowenthal, A. Bhatele, J. Thiagarajan, P. Bremer, andY. Livnat, “Analyzing inter-job contention in dragonfly networks,”2016. [Online]. Available: https://www2.cs.arizona.edu/ smiths949/dragonfly.pdf[4] A. Bhatele, J. J. Thiagarajan, T. Groves, R. Anirudh, S. A. Smith,B. Cook, and D. K. Lowenthal, “The case of performance variabilityon dragonfly-based systems,” in IEEE International Parallel and Distributed Processing Symposium (IPDPS), 2020.[5] S. Chunduri, K. Harms, S. Parker, V. Morozov, S. Oshin, N. Cherukuri,and K. Kumaran, “Run-to-run variability on xeon phi based cray xcsystems,” in Proceedings of the International Conference for HighPerformance Computing, Networking, Storage and Analysis, ser. SC ’17.New York, NY, USA: ACM, 2017, pp. 52:1–52:13.[6] B. Alverson, E. Froese, L. Kaplan, and D. Roweth, “Crayxc series network,” /CrayXCNetwork.pdf, 2012.[7] J. Kim, W. J. Dally, S. Scott, and D. Abts, “Technology-driven, highlyscalable dra
application. Which network metrics could indicate network congestion and performance degradation is also unclear. Un-derstanding the behavior of network metrics and application performance under network congestion on large HPC systems will be helpful in developing strategies to reduce congestion and improve the performance of HPC systems.