Transcription
Copyright 2017 Teignmouth Science and Technology CentreA Beginners Guide to XPSXPS InstrumentationFigure 1: Schematic of an XPS instrument.Photoemission occurs when photon energy is transferred to electrons within bound-states of atomscausing the electron to gain sufficient kinetic energy to escape into the vacuum chamber.An XPS instrument (Figure 1) includes an1. Vacuum chamber to allow the free movement of electrons emitted from a sample.2. An x-ray source to provide photons of a known energy.3. An energy analyser, the function of which is to allow electrons with a given kinetic energy topass through to a detection system.4. A transfer lens system to gather photoelectrons and focus the electron beam into an energyanalyser.5. A charge compensation mechanism used to prevent a dynamic build-up of negative chargeat the sample position which would result from the photoemission of electrons.6. A stage for positioning the sample beneath the x-ray flux such that photoemission can bemeasured by the detectors after passing through both the lens and analyser components ofthe instrument.An x-ray photoelectron spectrum is a sequence of measurements, where each measurement recordsthe numbers electrons of a given energy for a specific time interval. The objective is to measurecounts per second (CPS) as a function of kinetic energy (eV) of emission for electrons from atoms inthe surface material. Measured in units of CPSeV, variation in intensity for electrons with differingemission energies provides a means for characterising the electronic state of atoms within the1
Copyright 2017 Teignmouth Science and Technology Centresample from which electrons are emitted and offers quantifiable information about the surfacecomposition.Figure 2: Excitation of core-level K-shell electron by photoionisation.XPS instrumentation measures the kinetic energy 𝐸𝑘𝑒 for the photoelectrons. Electrons within atomsare characterised by an internally referenced binding energy 𝐸𝑏𝑒 determined by the chemicalenvironment for an atom. In the case of electrons emitted from bound states of atoms in an idealconducting sample, the kinetic energy, the binding energy 𝐸𝑏𝑒 and the photon energy ℎ𝜈 for aninstrument with work function 𝜙 is given by𝐸𝑘𝑒 ℎ𝜈 𝐸𝑏𝑒 𝜙The key point here is the energy fundamental to excitation by photons measured by XPSinstrumentation is kinetic energy. For photoelectron primary peaks the kinetic energy for thesepeaks, from the perspective of the instrument, changes with photon energy. From the perspective ofthe material analysed, sampling depth (see below) is also dependent on kinetic energy for theelectrons, so changing the photon energy also changes the potential volume of sample from whichprimary photoemission is measured. Nevertheless, the kinetic energy for the photo-emittedelectrons at point of excitation determines the depth from within the sample emission can berecorded. While binding energy is of primary interest to the analyst, understanding the influence ofkinetic energy on instruments and samples is important for a successful measurement.For the case of Auger emission (Figure 2), the relationship between the excitation source and thekinetic energy for the emitted electron is lost. Auger emission due to photoionisation generateselectron emission with kinetic energy determined not by the photon energy, but by the differencebetween two bound electron states of the ion resulting from photoemission. Following theconvention in XPS to use positive values for binding energy, the kinetic energy for Augerphotoemission measured by an XPS instrument is𝐸𝑘𝑒 (𝐸𝑏𝑒 [𝐼𝑛𝑖𝑡𝑖𝑎𝑙] 𝐸𝑏𝑒 [𝐹𝑖𝑛𝑎𝑙]) 𝜙Both 𝐸𝑏𝑒 [𝐼𝑛𝑖𝑡𝑖𝑎𝑙] and 𝐸𝑏𝑒 [𝐹𝑖𝑛𝑎𝑙] are binding energies for ions created by photoionisation and aretherefore absolute energies characteristic of these ions independent of the ionizing radiationenergy.2
Copyright 2017 Teignmouth Science and Technology CentrePhotoemission by the Auger process and photoemission by direct coupling of photons with boundstates of atoms means changing the photon energy when measuring equivalent samples results in ashift in relative energy for photoemission lines from these two different sources for peaks in an XPspectrum.Surface Sensitivity and Sampling DepthXPS is a surface sensitive technique. That is to say, photoemission without energy loss is restrictedto the top few nanometres of the interface between the sample and the vacuum. While x-rayspenetrate the sample to a greater depth, scattering of emitted electrons by electrons locatedbetween the depth within the sample of emission and the vacuum/sample interface limits theintensity of primary photoelectron peaks to depths which depend on the emission energy ofelectrons. For example, photons with energy 1486.6 eV, characteristic of an aluminium anode x-raygun, generate 95% of emission electrons from depths less than 10 nm. The maximum samplingdepth for photons with energy 1486.6 eV is therefore less than 10 nm, and depending on the bindingenergy for an atom from which the photoemission originates, the sampling depth can besignificantly less than 10 nm.Primary photoelectron peaks (Figure 3) are the sum of all electrons collected by the detectionsystem emitted from a sample surface into the vacuum for which no energy is lost followingexcitation by photoionisation other than the work function of the instrument.Electron scattering of an emitted electron by electrons associated with surface material may occuras emission electrons move from an atom deep in the sample before arriving in the vacuumchamber of an XPS instrument. Electron scattering may be elastic or inelastic. Inelastic scattering ofthe photoelectron causes a reduction in the kinetic energy of a photoelectron from the initialexcitation energy. Inelastic electron scattering during a photoemission experiment results in asignificant proportion of the photoemission signal assigned as background in nature (Figure 3).Primary photoemission intensity, which can be linked to specific elements and chemical states withinelements, is superimposed on the inelastic scattered background signal. Quantification of samplematerial requires an estimate for the background contribution to the intensity over the energyinterval associated with a primary photoemission peak. That is, sample composition is estimatedusing background subtracted peak intensity.Figure 3: Photoemission signal includes background intensity due to inelastic scattering of photo-ionised electronsappearing within a spectrum at energies different from the primary photoemission peaks.3
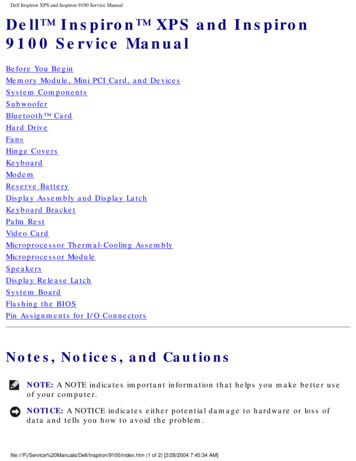
Copyright 2017 Teignmouth Science and Technology CentreSince XPS has a limited sampling depth, the angle of the sample with respect to the direction of theextraction optics for the analyser is a factor in the measurement process. Tilting a sample withrespect to the analyser axis alters the volume of material from which a spectrum is collected. Figure4 illustrates the relationship between sample tilt and the volume of material from which electronsare collected during photoemission measurements. If the sample normal and the axis for theanalyser are in the same direction, the angle of tilt is considered to be zero. Increasing the anglebetween the sample normal and the analyser axis causes changes to the volume sampled resulting ina reduction in the depth from which photoemission is recorded. Figure 4 shows the mechanism bywhich tilting a sample selects for surface layers as the angle increases.Figure 5 contains spectra from a layered sample where nominally the layers are ppHex on SiO2. Theamount of Si and O as evidenced by the O 1s, Si 2s and Si 2p peaks relative to the C 1s ppHexcontribution for three different angles shows SiO2 is beneath a layer of ppHex. As the angle of tiltincreases the O 1s, Si 2s and Si 2p peaks from the SiO2 substrate reduce relative to C 1s, hence theSiO2 is seen to be significantly reduced in the outermost layer of the material.Figure 4: An idealised layered material analysed at three different angle of sample tilt with respect to the analyseracceptance angle.Figure 5: ppHex layer on SiO2 measured from the same sample tilted with respect to the analyser acceptance angle by0o, 50o and 70o.4
Copyright 2017 Teignmouth Science and Technology CentreCharge CompensationThe XPS technique relies on electrons leaving the sample. Unless these emitted electrons arereplaced, the sample will charge relative to the instrument causing a retarding electric field at thesample surface. For conducting samples electrically connected to the instrument, the charge balanceis typically easily restored. However, for insulating materials electrons must be replaced via anexternal source. Insulating samples are normally electrically isolated from the instrument and lowenergy electrons and/or ions are introduced at the sample surface. The objective is to replace thephotoelectrons to provide a steady state potential at the surface. Given a fixed potential 𝛼 at thesurface, binding energy for photo-emitted electrons can be measured by removing the potentialfrom the basic XPS energy relationship. Thus, for insulting samples for which charge compensation isperformed during an experiment, the basic relationship relating binding energy and kinetic energychanges from𝐸𝑘𝑒 ℎ𝜈 𝐸𝑏𝑒 𝜙to𝐸𝑏𝑒 ℎ𝜈 𝐸𝑘𝑒 𝜙 𝛼The data in Figure 6 shows spectra from PTFE (Teflon) acquired with and without chargecompensation. The C 1s peaks are shifted by 162 eV between the two acquisition conditions, buteven more importantly, the separation between the C 1s and the F 1s peaks differ between the twospectra by 5 eV. Without effective charge compensation the potential at the surface may changewith time, hence the measured kinetic energy for a photoemission line may change as a function ofelapse time between measuring two peaks.Figure 6: Insulating sample before and after charge compensation.Charge compensation does not necessarily mean neutralization of the sample surface. The objectiveis to stabilize the sample surface to ensure the best peak shape, whilst also ensuring peak separationbetween transitions is independent of the energy at which the electrons are measured. Achieving acorrect binding energy for a known transition is not necessarily the best indicator of good charge5
Copyright 2017 Teignmouth Science and Technology Centrecompensation. A properly charge compensated experiment typically requires shifting in bindingenergy using the Calibration property page, but the peak shapes are good and the relative peakpositions are stable.A nominally conducting material may need to be treated as an insulating sample. Oxide layers onmetallic materials can transform a conducting material into an insulated surface. For example,aluminium metal oxidizes even in vacuum and a thin oxide layer behaves as an insulator.Calibrating spectra in CasaXPS is performed using the Calibration property page on the SpectrumProcessing dialog window.Physical interpretation of spectral featuresSurvey SpectraDefinition: A survey spectrum refers to a measurement over an extended energy interval designedto assess general peak structure in the electron emission intensity in response to incrementalchanges in acceptance energy for the electron spectrometer. The principal goal for survey data is toassess a sample in terms of elemental composition. Survey data are typically performed using a lowenergy resolution mode for the electron spectrometer. Emission peaks are typically broadened toallow increased transmission for electron at a given measurement energy, which in turn permitsshort acquisition times using large steps in energy between recording the count rate.Figure 7: Example of a survey spectrum from a gold sample. Only involves emission peaks from one element.6
Copyright 2017 Teignmouth Science and Technology CentreFigure 7 is a survey spectrum from a clean gold sample showing emission peaks due to Al x-raysusing a monochromator to limit photon energy to 1486.7 eV. Emission count-rates were recordedafter steps of 1 eV adjustments to the emission energy accepted by a hemispherical analyserworking in Fixed Analyser Transmission (FAT) mode with a pass energy of 80 eV.XPS of gold using an Al x-ray source energy filtered using a monochromator causes emission from alimited number of core-level electrons within the gold atoms. None of the inner core electrons ofgold with assignments of 1s, 2s, 2p, 3s, 3p and 3d are observed through emission of electrons byphotons with energy 1486.7 eV, as these inner core electrons require more energy than 1486.7 eV toescape from a gold atom, hence these inner core electrons of gold cannot be measured by XPS usingan Al anode.A clean gold sample is an ideal example of a homogeneous sample. The data in Figure 8 is measuredfrom a powder containing several elements and includes contaminants such as carbon and sodium.Nevertheless, XPS of K2HPO4 powder is expected to result in almost identical spectra. Moving theanalysis position within a well prepared powder sample does not alter the spectra. In this sense, theK2HPO4 powder can be considered homogeneous to XPS.Figure 8: Example of a survey spectrum with multiple elements within the sample surface.Relative Intensity of Peaks in XPSEach element has a range of electronic states open to excitation by the x-rays. For an element suchas phosphorus, both the P 2s and P 2p transitions are of suitable intensity for use in quantification.The rule for selecting a transition is to choose the transition for a given element for which the peakarea, and therefore in principle the RSF, is the largest, subject to the peak being free from otherinterfering peaks.Transitions from different electronic states from the same element vary in peak area. Therefore, thepeak areas calculated from the data must be scaled to ensure the same quantity of phosphorus, say,is determined from either the P 2s or the P 2p transitions. More generally, the peak areas fortransitions from different elements must be scaled too. A set of relative sensitivity factors (RSF) arenecessary for transitions within an element and also for all elements, where the sensitivity factorsare designed to scale the measured areas so that meaningful atomic concentrations can beobtained, regardless of the peak chosen.7
Copyright 2017 Teignmouth Science and Technology CentreUnderstanding Relative Sensitivity Factors for Doublet TransitionsAn electron spectrum is essentially obtained by monitoring a signal representing the number ofelectrons emitted from a sample over a range of kinetic energies. The energy for these electrons,when excited using a given photon energy, depends on the difference between the initial state forthe electronic system and the final state. If both initial and final states of the electronic system arewell defined, a single peak appears in the spectrum. Well defined electronic states exist for systemsin which all the electrons are paired with respect to orbital and spin angular momentum. The initialstate for the electronic system offers a common energy level for all transitions. When an electron isemitted from the initial state due to the absorption of a photon, the electrons emerge with kineticenergies characteristic of the final states available to the electronic system and therefore XPS peaksrepresent the excitation energies open to the final states. Since these final states include electronicsub-shells with unpaired electrons, the spin-orbit coupling of the orbital and spin angular momentresults in the splitting of the energy levels otherwise identical in terms of common principal andorbital angular momentum. Thus, instead of a single energy level for a final state, the final statesplits into two states referred to in XPS as doublet pairs. To differentiate between these XPS peaks,labels are assigned to the peaks based on the hole in the final state electronic configuration. Sincethese final states, even when split by spin-orbit interactions, are still degenerate in the sense thatmore than one electronic state results in the same energy for the system, three quantum numbersare sufficient to identify the final state for the x-ray excited system. Specifying the three quantumnumbers in the format nlj both uniquely identifies the transition responsible for a peak in thespectrum and offers information regarding the degeneracy of the electronic state involved. Therelative intensity of these doublet pair peaks linked by the quantum numbers nl is determined fromthe j l ½ quantum number. Doublet peaks appear with intensities in the ratio 2j1 1 : 2j2 1. Thusp-orbital doublet peaks are assigned j quantum numbers 1/2 and 3/2 and appear with relativeintensities in the ratio 1:2.Similar intensity ratios and differing energy separations are common features of doublet peaks inXPS spectra. Final states with s symmetry do not appear as doublets, e.g. Au 4s.8
Copyright 2017 Teignmouth Science and Technology CentreFigure 9: Excitation of L-shell electron resulting in doublet emission peaks.When quantifying XPS spectra, RSFs are used to scale the measured peak areas so variations in thepeak areas are representative of the amount of material in the sample surface. An element librarytypically contains lists of RSFs for XPS transitions. For some transitions more than one peak appearsin the data in the form of doublet pairs and, in the case of the default CasaXPS library, three entriesare available for each set of doublet peaks: one entry for the combined use of both doublet peaks ina quantification table and two entries for situations where only one of the two possible peaks areused in the quantification. A common cause of erroneous quantification is the inappropriate use ofthese optional RSF entries.Figure 10: Example of quantification regions and components used to quantify peak areas.The data in Figure 10 are a set of high resolution spectra where quantification regions andcomponents are used to calculate the area for the peaks. These data illustrate some of the issuesassociated with XPS quantification as the data includes singlet peaks in the form of O 1s, C 1s, Al 2sand N 1s; as well as doublet pairs: Cr 2p, Cu 2p, Ar 2p and Fe 2p. These spectra are sufficientlycomplex to involve overlaps such as the Al 2s and Cu 3s, while the Cu 2p1/2 peak includes signalfrom a Cr Auger line. When creating a table of percentage atomic concentrations it is important toselect the correct RSF for the peak area chosen to measure the given element.9
Copyright 2017 Teignmouth Science and Technology CentreTable 1: Quantification table showing RSFs used to scale the raw peak areas.NameR.S.F.% Conc.Cr 2p 1/210.6041 2.9Cr 2p 3/210.6041 6.2Fe 2p 1/214.8912 2.2Fe 2p 3/214.8912 4.5Cu 2p 3/215.0634 4.4Al 2s Metal 0.75361.4Al 2s Ox0.7535.1Ar 2p2.65797 5.5O 1s2.936.2C1s11.5N1s1.80.2When measuring a transition, from the perspective of signal to noise, it is better to include bothpeaks from a doublet pair. For the data in Figure 10, the Fe 2p, Cr 2p and Ar 2p transitions are free ofinterference from other peaks and therefore simple integration regions can be used to measure thepeak areas. The Ar 2p doublet peaks overlap each other, however the Cr 2p and Fe 2p peaks do notoverlap, thus separate quantification regions are used to measure the area for these resolveddoublet peaks. Even though separate regions are used to estimate the peak areas for the two peaksin each of the Cr 2p and the Fe 2p transitions, total RSFs for these transitions are used to scale theraw area calculated from the regions. Similarly, the total RSF is used to scale the Ar 2p doubletpeaks, because both peaks from the doublet are used in calculating the peak area for argon. On theother hand, since the Cu 2p1/2 peak overlaps with the Cr LMM Auger transition, only the Cu 2p3/2peak can be used with ease and so the reduced RSF must be applied to scale the peak area. Thequantification table in Table 1 lists the regions and components used to calculate the atomicconcentrations together with the RSFs for each transition.Note the peak model used to measure the Al 2s includes a component representing the contributionof the Cu 3s transition to the Al 2s spectrum in Figure 10. Copper is measured using the Cu 2p3/2peak therefore the RSF for the Cu 3s component is set to zero hence the component does notappear in Table 1.By way of example, an alternative quantification regime might be to use only one of the two possibleFe 2p doublet peaks. The quantification in Table 2 removes the Fe 2p1/2 region from the calculationby setting the RSF to zero, whilst adjusting the Fe 2p3/2 RSF to accommodate the absence of the Fe2p1/2 peak area from the calculation. Since the ratio of 2p doublet peaks should be 2:1, the RSF forthe Fe 2p3/2 region is two thirds of the total RSF used in Table 1. In Table 1, the percentage atomicconcentration for Fe is split between the two Fe 2p doublet peaks, whereas in Table 2 the entire Fe2p contribution is estimated using the Fe 2p3/2 and therefore the same amount of Fe is measuredvia either approach.A common misunderstanding is to use both peaks in the calculation, but still assign RSFs for theindividual peaks in the doublet. The consequence of using both peaks and the specific RSFs to theindividual peaks in the doublet is the contribution from Fe to the quantification table would beincorrectly increased by a factor of two.10
Copyright 2017 Teignmouth Science and Technology CentreNote: the RSFs used in both Table 1 and Table 2 are Scofield cross-sections adjusted for angulardistribution corrections for an instrument with angle of 90º between the analyser and x-ray source.Table 2: Fe 2p 3/2 peak is used without the area from the Fe 2p1/2.NameR.S.F.% Conc.Cr 2p 1/210.6041 2.9Cr 2p 3/210.6041 6.2Fe 2p 3/29.8064 6.8Cu 2p 3/215.0634 4.4Al 2s Metal 0.75361.3Al 2s Ox0.7535.1Ar 2p2.65797 5.5O 1s2.936.2C1s11.5N1s1.80.2To further illustrate the issues associated with the uses of the three RSFs allocated to doublet peaksin the default element library, consider the three possible options available when quantifying the Cr2p doublet shown in Figures 11, 12 and 13. Table 3 shows that the corrected area when measuredusing any of these three options is approximately the same.Figure 11: Intensity for Cr calculated from the Cr 2p1/2 transition.Cr 2p1/2 RSF Raw Area3.6072119234.811
Copyright 2017 Teignmouth Science and Technology CentreFigure 12 Intensity for Cr calculated from the Cr 2p3/2 transition.Cr 2p3/2 RSF Raw Area6.969740871.9Figure 13: Intensity for Cr calculated from both peaks in the doublet.Total RSF Raw Area10.6041 60098.5Table 3: Comparison of the intensities calculated from the three different combinations of peak area and RSF for the Cr2p doublet illustrated in Figure 11, Figure 12 and Figure 13.PeakRSFRaw Area/(RSF*T*MFP)Cr 2p 1/2Cr 2p 3/2Both Cr 2p PeaksRaw Area Corrected Area3.60721 19234.86.9697 40871.910.6041 60098.512125.455138.192133.555
Copyright 2017 Teignmouth Science and Technology CentreBasic Quantification of XPS SpectraHow to Compare SamplesA direct comparison of raw peak areas is not a recommended means of comparing samples for thefollowing reasons. An XPS spectrum is a combination of the number of electrons leaving the samplesurface and the ability of the instrumentation to record these electrons. Not all electrons emittedfrom the sample are recorded by the instrument. Further, the efficiency with which emittedelectrons are recorded depends on the kinetic energy of the electrons, which in turn depends on theoperating mode of the instrument. As a result, the best way to compare XPS intensities is via, socalled, percentage atomic concentrations. The key feature of these percentage atomicconcentrations is the representation of the intensities as a percentage, that is, the ratio of theintensity to the total intensity of electrons in the measurement. Should the experimental conditionschange in any way between measurements, for example the x-ray gun power output, then peakintensities would change in an absolute sense, but all else being equal, would remain constant inrelative terms.Quantification RegionsXPS counts electrons ejected from a sample surface when irradiated by x-rays. A spectrumrepresenting the number of electrons recorded at a sequence of energies includes both acontribution from a background signal and also resonance peaks characteristic of the bound statesof the electrons in the surface atoms. The resonance peaks above the background are the significantfeatures when quantification of a surface is performed from an XPS spectrum (Figure 14).XPS spectra are, for the most part, quantified in terms of peak intensities and peak positions. Thepeak intensities measure how much of a material is at the surface, while the peak positions indicatethe elemental and chemical composition. Other values, such as the full width at half maximum(FWHM) are useful indicators of chemical state changes and physical influences. That is, broadeningof a peak may indicate: a change in the number of chemical bonds contributing to a peak shape, achange in the sample condition (x-ray damage) and/or differential charging across a surface(localised differences in the surface potential).Figure 14: Quantification regions used to integrate signal above background corresponding to primary photoemissionpeaks.13
Copyright 2017 Teignmouth Science and Technology CentreThe underlying assumption when quantifying XPS spectra is that the number of electrons recorded isproportional to the number of atoms in a given state. The basic tool for measuring the number ofelectrons recorded for an atomic state is the quantification region. Figure 14 illustrates a surveyspectrum where the surface is characterised using a quantification table based upon valuescomputed from regions. The primary objectives of the quantification region are to define the rangeof energies over which the signal can be attributed to the transition of interest and to specify thetype of approximation appropriate for the removal of background signal not belonging to the peak.Figure 15: Primary photoemission peak due to oxygen electrons initially in a 1s core level. A background estimate is usedto remove the signal due to inelastic scattering of electrons with initial kinetic energies greater than the O 1s primarypeak.Peak Models in XPSQuantification regions are useful for isolated peaks. Unfortunately not all samples will offer clearlyresolved peaks. A typical example of interfering peaks is any material containing both aluminium andcopper. When using the standard magnesium or aluminium x-ray anodes, the only aluminiumphotoelectric peaks available for measuring the amount of aluminium in the sample are Al 2s and Al2p. Both aluminium peaks appear at almost the same binding energy as the Cu 3s and Cu 3ptransitions. Thus estimating the intensity of the aluminium in a sample containing these elementsrequires a means of modelling the data envelope resulting from the overlapping transitionsillustrated in Figure 16.Figure 16: Aluminium and Copper both in evidence at the surface.14
Copyright 2017 Teignmouth Science and Technology CentreTechniques for modelling data envelopes not only apply to separating elemental information, suchas the copper and aluminium intensities in Figure 16, but also apply to chemical state informationabout the aluminium itself. Intensities for the aluminium oxide and metallic states in Figure 16 aremeasured using synthetic line-shapes or components within a peak model. The problem ofaluminium and copper is not unique. Even basic materials result in XPS spectra which typicallyinclude multiple transitions for each element and while useful in identifying the composition of thesample, the abundance of transitions frequently leads to interference between peaks and thereforeintroduces the need to construct peak models. Figure 17 further illustrates the point with aspectrum over the Si 2p energy interval from a sample with a thin layer of silver on silicon (Universityof Iowa, Jukna, Baltrusaitis and Virzonis, 2007, unpublished work). Samples such as these are all toocommon and quantification of such interfering Si 2p and Ag 4s intensities require the use of peakmodels.Figure 17: Elemental and oxide states of silicon overlapped by a silver peak Ag 4s.The subject of peak-fitting data is complex. A model is typically created from a set of Voigt orapproximations to Voigt line-shapes. Without careful model construction involving additionalparameter constraints, the resulting fit, regardless of how accurate a representation of the data,may be of no significance from a physical perspective.Survey DataXPS survey spectra can be used to differentiate elemental composition between samples. The twospectra in Figure 18 are an example where two polymers are present in the top 10 nm of the surface.These samples are also constructed to form well defined layers designed to consist of poly (styrene)and poly (vinyl ethyl ether).15
Copyright 2017 Teignmouth Science and Technology CentreFigure 18: Survey spectra measured from layered PS PVEE polymer samples prepared by Graham Beamson for angleresolved XPS analysis.Quantification tables in Figure 18 present the results of a straight forward data treatment. Therelative amount of material at the surface is measured using two transitions C 1s and O 1s. Thesetwo transitions from a simple material appear as single peaks in an XPS spectrum. To estimate theamount of material at the surface quantification tables in Figure 18 displaying atomic concentrationbased on regions, for which signal above background counts is integrated directly from the data. Thesurvey spectra contain additional peaks labelled C KLL and O KLL, but for the purposes of quantifyinga sample, a set of peaks representative of the various elements must be identified, specified usingregions and intensities computed using the parameters defined in these reg
A Beginners Guide to XPS XPS Instrumentation Figure 1: Schematic of an XPS instrument. . substrate reduce relative to C 1s, hence the SiO 2 is seen to be significantly reduced in the outermost layer of the material. Figure 4: An idealised layered material analysed at three different angle of sample tilt with respect to the analyser