Transcription
Computational and Experimental Study of SupersonicNozzle Flow and Shock InteractionsMelissa B. Carter1 and Alaa A. Elmiligui2NASA Langley Research Center, Hampton VA 23681Sudheer N. Nayani3Analytical Services & Materials, Inc., Hampton, VA 23666Ray Castner4NASA Glenn Research Center, Hampton VA 23681Walter E. Bruce IV5University of Virginia, Charlottesville, VA 22904andJacob Inskeep6West Virginia University, Morgantown, WV 26506This study focused on the capability of NASA Tetrahedral Unstructured Software System’sCFD code USM3D capability to predict the interaction between a shock and supersonicplume flow. Previous studies, published in 2004, 2009 and 2013, investigated USM3D’ssupersonic plume flow results versus historical experimental data. This current study buildson that research by utilizing the best practices from the early papers for properly capturingthe plume flow and then adding a wedge acting as a shock generator. This computationalstudy is in conjunction with experimental tests conducted at the Glenn Research Center 1’x1’Supersonic Wind Tunnel. The comparison of the computational and experimental datashows good agreement for location and strength of the shocks although there are verticalshifts between the data sets that may be do to the measurement technique.NomenclatureβGRCNPRpp Rωxy zΔp cone nose angle, degreesGlenn Research Centernozzle pressure ratiostatic pressure, psffreestream static pressure, psfRankinetangent cone half-angle, degreesdistance in the stream-wise direction, inchesdimensionless wall distancedistance in the waterline direction, inches(p-p ), psf Aerospace Engineer, Configuration Aerodynamics Branch, Mail Stop 499, AIAA Senior Member. Research Engineer, Configuration Aerodynamics Branch, Mail Stop 499, AIAA Senior Member.3Senior Scientist, CFD Group, 107 Research Drive, AIAA Senior Member. Aerospace Engineer, Inlet and Nozzle Branch, 21000 Brookpark Road, AIAA Associate Fellow. Undergraduate. Recent B.S. Graduate. 1
I. IntroductionAs part of the NASA Fundamental Aerodynamics Program High-Speed Project, evaluation and improvement ofcomputational fluid dynamics (CFD) sonic boom prediction capability has been a high priority. From theNASA Boom Workshop of 20081 to the more recent AIAA Boom Workshop of 20142, numerous conditions andCFD codes have been examined and compared. As this work progressed, researchers began looking into differentcomponents of supersonic flight. One of the remaining questions is how does the engine’s plume effect the boomsignature? As a first step to answering that question, a study was conducted3 to ensure that the unstructured CFDcode (USM3D) could properly capture a jet’s supersonic plume. Building on the lessons learned from that study,research was then conducted both computationally and experimentally to predict and model the interaction of ashock with an engine’s plume.The experimental component of this study was conducted at the NASA Glenn Research Center 1-foot by 1-footsupersonic wind tunnel (GRC 1x1 SWT) in Cleveland, Ohio. Since this tunnel’s capability to test small-scalemodels was developed to validate results obtained for supersonic nozzle concepts4, it was chosen as the facility toobtain fundamental data on nozzle plume and shock interaction effects. The testing conducted used a simple jetflow and simulated tail shock generated by a wedge shaped shock generator. Wind tunnel test results includeSchlieren images of the nozzle exhaust shock structure and near-field static pressure profiles as collected from astatic pressure probe.The computational study was conducted using NASA Langley’s USM3D CFD code. The study was conductedby modeling the test section of the GRC 1x1 SWT with the jet and wedge installed. Additional cases included jetalone and wedge alone in order to attempt to isolate the effects of the jet supports and quantify the effect of the jeton the wedge’s shock signature, respectively.II. Numerical TechniquesThis CFD study used the NASA Tetrahedral Unstructured Software System (TetrUSS) for all the computations.This CFD suite, created and maintained by NASA Langley Research Center, includes a geometry setup toolGridTool, an unstructured grid generation program called VGRID, a grid post-processor named POSTGRID, and theflow solver USM3D.5a) Grid GenerationVGRID is an interactive, or batch, tetrahedral unstructured grid generation program. The grids produced byVGRID are suitable for computing either Euler or Navier-Stokes flow solutions. The grid spacing is related to thestrength of user-defined sources placed in the domain. The methodology is based on the Advancing-Front method(AFM)6 and the Advancing-Layers method (ALM).7 Both techniques are based on marching processes in whichtetrahedral cells are grown on an initial triangular boundary mesh and gradually form in the field around thegeometry. Once the advancing front process is completed in VGRID, an additional post-processing step is requiredusing POSTGRID to close any open pockets and to improve grid quality like removing the sliver cells.In 2008, a new version of VGRID was introduced.8 Software updates to VGRID included growth rates, surfacesources, and volume sources. The outer boundary sources were no longer required for grid growth rates. The outerboundary sources were replaced with a user specified growth rate of the grid that dictates how the grids growoutwards from the surface and their maximum size. Additionally, new volume source types became available inVGRID. In the older version of VGRID, only point and line sources were available. Now, users can define sourcesthat are based on a sphere, a cylinder, or a cone.In order to capture the plume and other flow characteristics properly, it is very important to source the nozzleconfigurations adequately and appropriately. For example, the cell spacing, distribution, and source divergenceangle needs to be correctly defined to capture the shear layer. Adequate cell density is also needed to accuratelycapture the core length and the shock structure. A past study3 showed that five cylindrical sources for the nozzle andthe field provided adequate grid density for capturing the jet plume. A series of line sources are also placed on thenozzle lip to enable a smooth start of the shear layer. The cylindrical sources were placed to ensure that the nozzle, 2
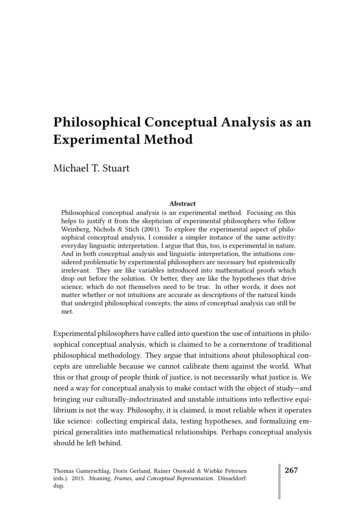
plume core and expansion of the shear layer were properly captured. Additional information about the sourcingmethod can be found in reference 3.b) CFD Code InformationThe USM3D code9 is a cell-centered, finite-volume Navier-Stokes flow solver that uses multiple flux splittingschemes including Roe’s flux-difference splitting scheme10 to compute inviscid flux quantities across the faces ofthe tetrahedral cells. Several options for turbulent closure are available: the one-equation Spalart-Allmaras (S-A)model11 (with and without a wall function), and several two-equation models, including Menter’s Shear StressTransport (SST) model.12 The minmod limiter, which is typically used for supersonic conditions, was used duringthis study to ensure numerical stability. For the flow solution cases conducted in this study, either the S-A or the k-εturbulence model with Sarkar’s compressibility and pressure dilation was used. 3,13 This variant of k-ε model wasshown to work well for modeling supersonic jets in references 3 and 13.III. Experimental Test InformationThe experimental testing component of this study was conducted at the NASA Glenn 1-foot by 1-footSupersonic Wind Tunnel. The test section for this tunnel is 12-inches by 12.2-inches by 53.25-inches long. Thetunnel can operate at 10 discrete speeds ranging from Mach 1.3 to Mach 6 by using contoured nozzle blocksupstream of the test section. For Mach 2, the tunnel can obtain Reynolds number per unit length between 1.3 and 13million.14 a) Jet Flow SimulatorThe jet flow model consisted of three major parts: the upper plenum, the strut, and the lower plenum (as shownin Figure 1). The upper plenum design was 1-inch outer diameter, and had an overall length from the nosecone tothe nozzle exit of 8.21 inches. The support strut was 0.35 inch in thickness and contained nine passages to supplyairflow. Air supply lines were 0.25-inch diameter and supplied 90 psia of pressure each to achieve 20 psia at thenozzle inlet for test conditions designed to simulate the environment at 50,000 feet altitude. Air was supplied to thebottom of the strut through a lower plenum by the centralized 450 psig pressurized air system at the NASA GlennResearch Center.8.21 4.98 Figure 1. Wind tunnel jet flow simulator cut-away.Dimensions are in inches. 3
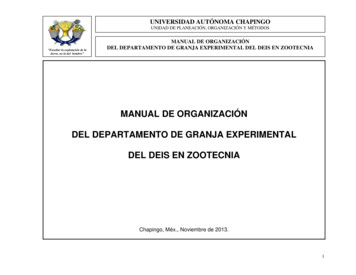
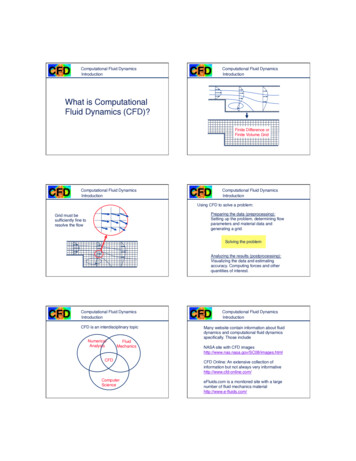
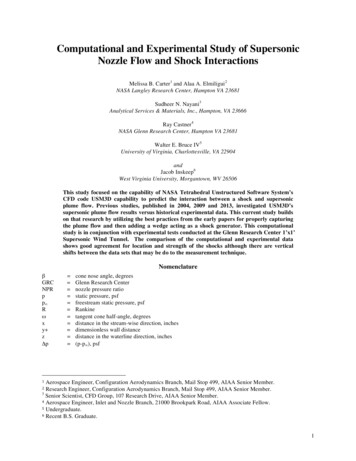
b) Shock GeneratorsThe 5-degree shock generator wedge was fabricated from 17-4 stainless steel to provide a leading edge shockthat would intersect with the nozzle plume. The wedge was built with a 5-degree wedge angle (10-degree inclusive),6-inch chord, 8-inch span, and was mounted on a diamond shaped support strut 4 inches high from the wind tunnelwall. The wedge possessed sharp leading and trailing edges with a radius of 0.005 inches. A second, smaller wedgewas built similar to the previous wedge except with a smaller chord of 2.5 inches instead of 6 inches, and a smallerspan of 3.6 inches instead of 8 inches.c) Data CollectionFor this test, the data was obtained at Mach 1.96 and the experimental pressure signatures were measured atone-diameter away from the nozzle centerline, collected on the side opposite the model support strut. Data werecollected at this location due to space restrictions in a small wind tunnel, and is consistent with previousexperiments. 15 The static pressure probe had a capability to travel axially up to 8.0 inches to capture pressureprofiles, with an x 0 chosen as the nozzle exit plane. The actuator position and probe starting location werechanged during the test, dependent upon where the shock interaction was located. The tunnel set-up can be seen infigure 2.Actuator EnclosureActuator ProbeFigure 2. Test set-up in the test section of GRC 1x1 SWT.Dimensions are in inches.Two static pressure probes were built, a 10-degree cone standard probe and a design, based on Pinckney.16 The10-degree cone standard probe design, in figure 3a, had difficulty capturing shock waves. This difficulty wasdemonstrated by a rounding of the peaks where shock waves occur, caused by the high cone angle and the longdistance between the probe tip and the static pressure measurement ports where the measurement was not in thesame flow environment as the probe tip. The Pinckney probe design (β 10; ω 1.5), figure 3b, had less sensitivity toangle of attack while achieving similar relaxation of static pressure at the location of the measurement ports.However, static pressure data collected with the Pinckney probe demonstrated a constant offset in Δp/p of -0.08when tested in an empty tunnel, suggesting that the Pinckney probe has an offset in the Δp/p measurement (Figure4). These probes were mounted on a 3/8-inch thick airfoil strut, allowing 5.625 inches of probe length between thestatic pressure holes and the airfoil support. For all experimental results presented, the Pinckney probe was used.Further information about this test can be found in reference 4. 4
p/p a) Standard probeb) Pinckney probeFigure 3. Pressure probes used at GRC 1x1 SWT.Figure 4. Experimental results for the standard and Pinckney probes in an empty tunnel at GRC 1x1 SWT.IV. Computational Test CasesThe computational grids were fully viscous and resolved to the walls. The first cell height was sized to obtain ay of 0.2. Solutions were run on the grids until the residual of the L-2 norm reduced by at least 3 orders ofmagnitude. The runs were conducted at a freestream Mach number of 1.96, a Reynolds number of 271,526 based onthe diameter of the nozzle (1 in.), nozzle pressure ratios (NPR) of 6, 8, 10, 12 and 14, and a total temperature of 529R.a) Jet aloneThe first case examines the jet modeled by itself within the test section of GRC 1x1 SWT (Figure 5). The gridconsisted of 37.4 million grid cells. This work was done with the strategy that the effect of the jet support could be 5
removed from further computational results. Figure 6 shows a Schlieren image from the tunnel when running withthe jet alone. As shown, there are numerous shocks caused by the tunnel, the nosecone and strut of the jet, and thenreflections off the test section walls. Since computationally, only the test section was modeled, there should be lessinterference from other shock sources. The results from all of the CFD runs are shown in section V.Figure 5. Jet modeled in GRC 1x1 SWT test section.Figure 6. Schlieren image of tunnel shock structure (NPR 8).b) Large Wedge AloneThis case examines the 6-inch wedge modeled by itself within the test section of GRC 1x1 SWT (Figure 7).This case was examined to baseline the effect of the wedge alone in supersonic flow. The grid had 26.6 million cells.Figure 7. Large wedge modeled in GRC SWT test section.c) Jet & WedgeThis case examines the 6-inch wedge mounted along with the jet within the test section of the GRC 1x1 SWT(Figure 8). This was originally the main piece of the research since this configuration would directly address thegoal of the study, i.e., determine the effect of a shock wave on a jet plume. However, due to the other shocks 6
produced by the tunnel and various supports within the tunnel, this set-up was not tested. The computational gridhad 47 million cells.Figure 8. Jet and large wedge modeled in GRC 1x1 SWT test section.d) Jet & Wedge as testedIn order to experimentally test the 6-inch wedge mounted along with the jet, the wedge support was movedforward and reversed. Consequently, after the test, a grid was generated to match the tested configuration (Figure 9)with 33.9 million cells.Figure 9. Jet and large wedge modeled as tested in GRC 1x1 SWT test section.e) Jet & Small WedgeAfter the first entry into the GRC 1x1 SWT, results showed that even with moving the wedge forward, theexpansion from the middle of the wedge and the shock off the back of the wedge were intersected by other shocksfrom the tunnel, thereby contaminating the results (shown in the circled area within Figure 10). It was decided to trya smaller wedge (2.5-inches) in a second entry to the tunnel. This new smaller wedge (Figure 11 and Figure 12) wasmodeled as tested and was able to experimentally capture both the expansion waves and parts of the aft shock. Thecomputational grid contained 52.3 million cells.Figure 10. Schlieren image of jet and large wedgein GRC 1x1 SWT test section (NPR 8). Figure 11. Schlieren image of jet and small wedgein GRC 1x1 SWT test section (NPR 8).7
Figure 12. Jet and small wedge modeled in GRC 1x1 SWT test section (NPR 8).f) Jet, Small Wedge & Full TunnelThe complete GRC 1x1 SWT was modeled (contraction test section diffuser) to accurately predict theboundary layer thickness and obtain the pressure signature. The goal was to compare the pressure signaturesobtained by simulating the full tunnel versus the test section alone. Figures 13a and 13b show the tunnel top and sideviews respectively. The sourcing scheme for the tunnel is shown in figure 13c. Both line and cylindrical sourceswere used. The jet sourcing is similar to the procedure described in section IIa earlier. As can be seen, cylindricalsources have been placed above and below the nozzle, which extend to the tunnel roof and floor to capture the shockreflections. A cylindrical source was also extended from the nose of the model to the start of the test section tocapture the bow shock eminating from the nose of the model. The source spacings were adjusted to ensure adequategrid point resolution on the tunnel walls. The volume grid size was about 36.5 million cells.a)Top view.b) Side view.c)Sourcing in test section region.Figure 13. Jet, small wedge and sourcing modeled in full GRC 1x1 SWT. 8
V. Comparison of Computational and Experimental ResultsIn this section comparison of wind tunnel data and CFD results are presented for both small and large wedgeshock generators. Test cases modeled were: (a) jet alone, (b) large wedge alone and (c) jet plus large wedge both asoriginally proposed and (d) as tested, (e) jet plus small wedge in the test section alone and (f) in the full tunnel. Forall the test cases, simulations were conducted for a Mach number of 1.96 and NPRs of 6, 8, 10, 12 and 14.As discussed in the experimental section, there is a possibility that the experimental data could be off by a valueof 0.08. Therefore, for all of the plots containing experimental data, a blue symbol represents the experimental datawith 0.08 added to it.Figure 14 shows a comparison between the wind tunnel data and CFD results for the jet only case. The datashown are at an NPR of 8 and CFD with the k-ε turbulence model. The CFD results compare well with theexperimental results with an offset of 0.08. The CFD was able to capture the magnitude of the initial shock.Figure 14. Computational k-ε and experimental results for jet alone at aNPR of 8 in GRC 1x1 SWT test section.Figure 15 shows CFD results for the jet only, the wedge only and the jet plus large wedge using k-ε turbulencemodel for NPR of 6, 8, 10, 12 and 14. The blue line is the signature for the wedge only case. The plume shifted thesignature of the wedge forward in the axial direction and reduced the wedge signature amplitude by approximately0.05, as seen in red circled area of figure 15a.Figure 16 shows comparisons between wind tunnel data and CFD results for the jet and large wedge in the GRC1x1 SWT for NPR of 6, 8, 10, 12 and 14. These CFD results were obtained using the k-ε turbulence model. TheCFD captured the location and magnitude of the shock at an x value of approximately 4.5 inches. The CFD resultsdid not capture the peak at an x of approximately 6.5 inches that was caused by a shock reflecting from the upperwall of the wind tunnel. The CFD computational grid was fine enough to capture the nozzle and the wedge shocksbut was coarse in the region between the plume flow and the tunnel wall (red oval in Figure 17). Since the desire ofthis study was to look at shock-plume interactions, priority was not given to capture the reflected shocks. If furtherdetail is desired a finer grid is needed to be able to model shocks reflecting from wind tunnel walls.Figure 18 shows the comparison between computational results (S-A turbulence model) and wind tunnel data forthe small wedge and jet in the GRC 1x1 SWT. The CFD results (red curve) follow the pattern of the wind-tunneldata (symbols) and match the magnitude of the shock and the overall nature of the expansion waves. However, theCFD shock slopes are found to be smaller than the experimental signature shock slope and slightly shifted to theright (i.e., downstream).Figure 19 shows the computational and experimental results for the jet and the small wedge with the fullymodeled wind tunnel. These CFD results were obtained using the S-A turbulence model. Overall, there is good 9
agreement between the CFD results and the wind tunnel data. The CFD results follow the same pattern as the windtunnel data with CFD signature peaks being consistently higher than experimental data. By modeling the full windtunnel, any 3-dimensional effects coming from upstream of the tunnel are captured and appear to provide a moreaccurate solution. Modeling the test section alone has the disadvantage that it will not see the full boundary layergrowth and any 3-dimensional effects from upstream of the test section.Figures 20 and 21 compare the computed density gradient and the experimental Schlieren images of the jet aloneand the jet with the large wedge, respectively, at an NPR of 8 in the GRC 1x1 SWT. Figure 22 shows a comparisonbetween the experimental Schlieren images and the computed density gradient for both the test section only and fulltunnel configurations CFD computations of the small wedge at an NPR of 8 in GRC 1x1 SWT. Good qualitativeagreement between Schlieren images of experimental and CFD results were obtained. The computed densitygradient captured all the features present in the experimental image although the shock angles from the nacelle lipdiffer and a more pronounced shear layer definition. 10
a) NPR 6b) NPR 8c) NPR 10d) NPR 12e) NPR 14Figure 15. Computational k-ε results for jet alone, wedge alone and jet and wedge modeled in GRC 1x1 SWTtest section. 11
a) NPR 6b) NPR 8c) NPR 10d) NPR 12e) NPR 14Figure 16. Computational k-ε and experimental results for jet and large wedge as tested in GRC 1x1 SWT testsection. 12
Figure 17. Mach contours and the computational grid for the as tested large wedge and jet in the GRC 1x1 SWT. 13
a) NPR 6b) NPR 8c) NPR 10d) NPR 12e) NPR 14Figure 18. Computational S-A and experimental results for jet and small wedge in GRC 1x1 SWT test section. 14
a) NPR 6b) NPR 8c) NPR 10d) NPR 12e) NPR 14Figure 19. Computational S-A and experimental results for jet and small wedge with fully modeled GRC 1x1 SWT. 15
a) Experimental Schlieren results.b) Computational density gradient results.Figure 20. Computational and experimental results from jet alone at a NPR of 8 in GRC 1x1 SWT.a) Experimental Schlieren results.b) Computational density gradient results.Figure 21. Computational and experimental results from jet and large wedge at a NPR of 8 in GRC 1x1 SWT.a) Experimental Schlieren results.b) Comp. density gradient results.c) Comp. density gradient results.Test section only modeled.Full wind tunnel modeled.Figure 22. Computational and experimental results from jet and small wedge at a NPR of 8 in GRC 1x1 SWT. 16
VI. Concluding RemarksIn this study, the NASA Tetrahedral Unstructured Software System flow solver USM3D was used to simulatethe interaction between a supersonic nozzle jet flow with the shocks emanating from a shock generator. The CFDsimulation modeled a wind tunnel test conducted at the GRC 1x1 SWT. A small and a large wedge were used togenerate shocks in both the experiment and the CFD study. Simulations were conducted at the test section Machnumber of 1.96 and the jet NPRs of 6, 8, 10, 12 and 14. The two turbulence models used in the study: the twoequation k-e turbulence model with compressibility correction of Sarkar and the S-A turbulence model.Computations confirmed that USM3D could predict the location and strength of the generated shocks. Overall goodagreement between CFD results and experiment was obtained with the CFD signature peaks being slightly higher.However, due to questions about the experimental data, the actual pressure ratio value of the measured shock wasnot confirmed. A wind tunnel test is currently being conducted to verify the previous experimental results.Additionally, due to the contamination of shocks from other sources within the tunnel, i.e., the goal of the study, thecomputational study only attempted to match experimental results from x 2 to approximately x 6.The computational study shows that engine plume flow effects the shock signature by moving it slightly forwardand dampening the peak pressure ratio values of the shock and it was also noticed that the wedge shock bends the jetplume flow upwards. Although preliminary experimental results (not shown) agree with these results, furtherinvestigation is planned.Good qualitative agreement between Schlieren images of experimental and CFD results were obtained. Thecomputed density gradient captured all the features present in the experimental image and a more pronounced shearlayer definition.AcknowledgmentsThe research reported in this paper was sponsored by the NASA Fundamental Aeronautics Program High SpeedProject.References1Park, M.; Aftosmis, M; Campbell, R. L.; Carter, M. B.; Cliff, S.; and Bangert, L.: “Summary of the 2008NASA Fundamental Aeronautics Program Sonic Boom Prediction Workshop.” AIAA-2013-649, January 2013.2"1st AIAA Sonic Boom Prediction Workshop." 1st AIAA Sonic Boom Prediction Workshop. AIAA, n.d. Web.02 May 2014 http://lbpw.larc.nasa.gov/ .3Carter, M. B.; Nayani, S.; Elmiligui, A. A.; and Campbell, R. L.: “USM3D Predictions of Supersonic NozzleFlow.” AIAA-2014-2270, June 2014.4Castner, R.; Elmiligui, A. A.; Cliff, S.; and Winski, C.: “Plume and Shock Interaction Effects on Sonic Boom inthe 1-foot by 1-foot Supersonic Wind Tunnel.” AIAA SciTech, Orlando, Florida, January 2015 (submitted forpublication).5Frink, N. T.; Pirzadeh, S.Z.; Parikh, P.C.; Pandya, M.J.; and Bhat, M.K, “The NASA Tetrahedral UnstructuredSoftware System”, The Aeronautical Journal, Vol. 104, No. 1040, October 2000, pp. 491–499.6Lohner R and Parikh P., “Three-Dimensional Grid Generation by the Advancing Front Method.”Int.J.Num.Meth. Fluids 8, pp 1135–1149 (1988).7Pirzadeh S., “Three-dimensional unstructured viscous grids by the advancing layers method.” AIAA Journal,Vol. 34, No. 1, January 1996, pp. 43–49.8Pirzadeh S., “Advanced Unstructured Grid Generation for Challenging Aerodynamics Applications.” AIAA2008-7178, August 2008.9Frink, N. T., “Three-Dimensional Upwind Scheme for Solving the Euler Equations on UnstructuredTetrahedral Grids”, Ph. D. Dissertation, Virginia Polytechnic Institute and State University, September 1991.10Roe, P., “Characteristic Based Schemes for the Euler Equations.” Annual Review of Fluid Mechanics, Vol.18, 1986, pp. 337–365.11Spalart, P.; and Allmaras, S.A., “One-equation turbulence model for aerodynamic flows.” AIAA 92-0439,January 1992.12Menter, F.R., “Improved Two-Equation k-omega Turbulence Models for Aerodynamic Flows.” NASA TM103975, October 1992. 17
13Pandya, M.J.; Abdol-Hamid, K.Z.; and Frink, N. T., “Enhancement of USM3D Unstructured Flow Solver forHigh-Speed High-Temperature Shear Flows.” AIAA-2009-1329, January 2009.14Soeder, R.H.; Stark, D. E.; Leone, J. F. X.; and Henry, M. W., “NASA Glenn 1- by 1-Foot Supersonic WindTunnel User Manual.” NASA TM-1999-208478/REV1, December 2003.15Castner, R. S.: Exhaust Nozzle Plume Effects on Sonic Boom Test Results for Isolated Nozzles, AIAA 20104936, 2010.16Pinckney, S. Z., “A Short Static Pressure Probe Design for Supersonic Flow,” NASA TN D-7978. 18
CFD code USM3D capability to predict the interaction between a shock and supersonic plume flow. Previous studies, published in 2004, 2009 and 2013, investigated USM3D's . The comparison of the computational and experimental data shows good agreement for location and strength of the shocks although there are vertical