Transcription
8) Rotation-Vibration Spectrum of HCl and DClA) ABSTRACT 1k [d2V(r)/dr2]r re.The classical vibrational frequency of aharmonic oscillator with this forceconstant is given byν [1/(2π)] (k/µ)1/2 with µ m1m2/(m1 m2).with µ for the reduced mass. Theallowed quantum mechanical energylevels of the diatomic harmonicoscillator are given byE(n) hν(n 1/2) with n 0,1,2,3,.In this experiment infrared spectroscopy isused to obtain a rotation-vibration spectrumof the diatomic molecule HCl as well as ofits isotopes. Through an analysis of thisspectrum, information on the molecularstructure and the vibrational potentialfunction are obtained.B) THEORYThe simplest model for dealing withrotation-vibration spectra of diatomicmolecules is the harmonic oscillator-rigidrotor model. To a fair level ofapproximation, the potential energyfunction of nuclear motion for a diatomicmolecule may be approximated by aquadratic function in the vicinity of itsminimum. The harmonic force constant forvibration relative to the molecule'sequilibrium internuclear distance is thesecond derivative of this potential energyfunction evaluated at its minimumThe simplest model for a rotatingdiatomic molecule is the rigid rotor modelin which one considers the two pointmasses to be joined by a rigid weightlessbond. The allowed rotational energy levelsfor such a rigid rotor areE(J) [h2/(8π2I)] J (J 1) with J 0,1,2,3,.where I is the moment of inertia of themolecule. It is related to the reduced massand the internuclear distance by theequation: I µr2. For a real molecule whichis undergoing both vibration and rotationsimultaneously, the situation is somewhatmore complicated. A more completeexpression for the energy levels of amolecular vib-rotor is given below with theenergy levels expressed as term values T incm-1 units rather than as energies in ergs: (n 1/2) - χ T(n,J) E(n,J)/hc νeνee222(n 1/2) BeJ(J 1)-DeJ (J 1) αe(n 1/2)J(J 1).1Updated version of the lab handout. We includednumerous figures, notes about how to use the dataacquisition program, and added more hints to the“problems part” at the end of the draft. You shouldnow be able to write a decent lab report without a“master copy” of prior classes. U.Bgh-The symbols over the νe symbols signify-1that units are in wavenumbers (cm ). Wewill not derive this equation, as it involves
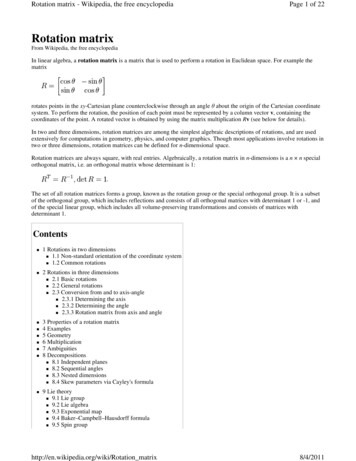
complicatedperturbationtheorycalculations. It is important, however, tounderstand the physical significance of eachterm:The fourth term with the constant De iscalled the centrifugal distortion correction.This takes into account the fact that thebond stretches as the rotation rate isincreasing. The centrifugal distortionconstant is usually quite small, and thisterm may be ignored in your data analysis.The fifth and last term is thevibration-rotation interaction term. Thisaccounts for changes in the moment ofinertia of the molecule as it vibrates.The first and third terms correspond to theharmonicoscillator-rigidrotorapproximation. The quantity Be (sometimescalled B) is the rotational constant, and isrelated to the moment of inertia I of themolecule by:2Be h / (8π Ic).Fig. 1 Vibrational energy levels.Note that this formula gives Be inwave number units; to get true energy units,multiply by hc.The selection rules for the harmonicoscillator and the rigid rotor are n 1 and J 1, respectively. For an anharmonicoscillator the J 1 selection rule is stillvalid, but transitions corresponding to n 2, 3,. are also weakly allowed; theseare called overtone bands. Since we areinterested in analyzing only the mostintense absorption band (the fundamental),we will only be concerned with transitionsfrom J" levels of the vibrational groundstate (n" 0) to J' levels in the first excitedvibrational state (n' 1). From the selectionrules we know that the transitions must beThe second term is the anharmonicitycorrection; this accounts for the fact that atrue potential for nuclear motion is not tis,usingcumbersome but standard notation, calledχe νe. This constant is usually positive; theresult is that vibrational energy levels arenot equally spaced but rather converge withincreasing vibrational quantum number n,as shown in Figure 1.2
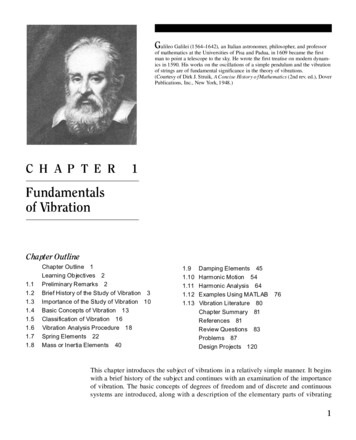
from J" to J' J" 1. The frequencies of thesetransitions are given by the difference in theterms, T(n',J')-T(n",J"). When J 1,(J' J" 1), and J -1, (J' J"-1), we find,respectively, thatThe two series of lines are calledR and P branches, respectively. Thesetransitions are indicated in Figure 2. It isconvenient to introduce a new quantity m,where m J" 1 for R branch transitionsand m -J" for P branch transitions asshown in Figure 3. It is then possible tocombine the two equations for P and Rbranches into one equation:2 νe ν0 (2Be - 2αe)m - αemwhere m takes all integer values exceptzero. The separation between adjacent linesis given by: (m) νν(m 1) - ν(m) (2Be - 3αe) 2αem. (m) versus m can beNote that a plot of ν νR ν0 (2Be - 3αe) (2Be - 4αe)J" 2αeJ"J" 0,1,2,.2 νP ν0 - (2Be - 2αe)J" - αeJ"J" 1,2,3,.where ν0, the frequency of the forbiddentransition from n" 0, J" 0 to n' 1, J' 0, is: ν0 νe - 2 χe νe. We have ignoredanharmonic and centrifugal distortioncorrections in the derivation of theseequations, but have retained the vibrationrotation interaction term.used to determine both Be and αe.B) ExperimentalFig.4: The gas cellC1 Filling the infrared gas cell.Fig. 2: R and P branches.Fig. 3: Notation for R and P branches. Note that the lines for larger ν values are assigned to positive m values. The plots3obtained in the experiment might be the other wayaround. Use the notation of the figure since the equationsdiscussed here apply that notation.Depending on the setting of themeasuring program you may needto record first a backgroundspectrum, i.e., you may need anempty gas cell first. The infrared gas cell has NaClwindows and must be handledwith care (Fig. 4). Never touchthe windows with your fingers,and never allow the windows tocome into contact with water. Acertain amount of fogging dueto room humidity is inevitable, butwill not severely reduce infrared
transmission. The vacuum line you willbe using is also very fragile, and iseasily broken. Always turn the valvesslowly, using two hands. Do not forcethem or they will break. If you needhelp, ask the T.A.The manifold pressure may be read bythe Baratron capacitance manometer; itis calibrated for full scale (10 volts)equals 1000 torr. You need roughly 100torr of HCl in your sample cell; this At this time you should also open valve4, but do not open valve 6 yet.Next place a styrofoam cup filled withliquid nitrogen (this liquid can burnyour skin: handle with care!) over thetest-tube end of the round bottomstorage flask to freeze out the smallamount of HCl which is contained inthis flask. Note that the gas is a mixtureof different isotopes. After the HCl hasbeen frozen out (about 1 minute), youFig. 5: Filling the gas cell. corresponds to 1.0 volt on the Baratron(the exact pressure is not crucial).“Zero” pressure (perfect vacuum)corresponds in theory to 0.0 volts on themeter, although small voltage offsetsare common.Turn on the mechanical pump if it is notalready running. Evacuate the manifoldshown in Figure 5 by opening valve 1.When the pressure has reached nearzero (after 1 minute), evacuate thesample cell by opening valves 2 and 5. 4may open valve 6.Next, isolate the manifold from thepump by closing valve 1. Remove theliquid nitrogen from the HCl flask, andcarefully watch the pressure meter asthe HCl evaporates and the pressureincreases in the manifold. When thedesired sample pressure is reached( 100 torr), close valve 5, and thenplace the liquid nitrogen back on thetest-tube end of the HCl flask. Themanifold pressure should return to zeroagain as the remaining HCl is againfrozen out (this should take about aminute). Close valve 6. Open valve 1to evacuate any trace gasses left inthe manifold. Close valve 2 andremove the gas cell from themanifold by rotating the ball joint tobreak the vacuum seal. Close valve4. This completes the cell fillingoperation. Note that this procedure
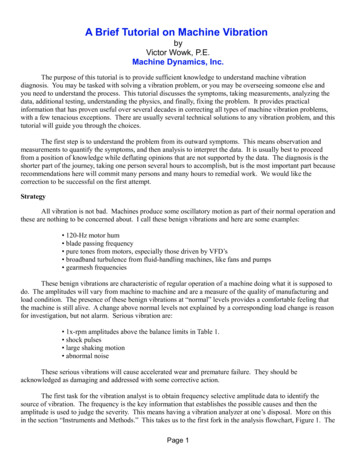
4) Set the measuring parameter byactivating the experimental set up menu(collect experimental setup).5) Use the collect button for starting ameasurement. Depending on your set upparameters, you have to collect awastes very little HCl by freezing thecontents of the vacuum line back intothe storage bulb, and also preventssignificant amounts of corrosive HClgas from reaching the vacuum pump.C2 Handling of the spectrometerYou can now collect an infrared spectrumusing the Fourier-Transform infraredspectrometer (Nexus 470 Ft-Ir from thermoNicolet). Place the sample cell in thesample compartment of the spectrometer.Be sure that the cell is aligned properly toallow the infrared light to pass through. Thespectrometer is operated by the attachedPC-AT computer. Your T.A. will assist youwith the details of operation. However,consider the following:1) Purging the IR withnitrogen, the TA willhelp. Keep the nitrogengas running all the time,close at the end of yourmeasurements.2) Start the OMNIC E.S.P.52.a program. An IRlibrary program with a similar name isalso available on that computer, i.e., usethe right program.Fig. 7: Example about how the labeling should look like.(That was a contaminated sample, i.e., do not take the peakpositions too seriously.) Add the m values to these plots.background spectra (empty IR cell)before or after taking the spectra orby choosing a stored backgroundspectra.6) After averaging four scans, a spectrawill be displayed on the screen. It’sbetter not to interfere with therunning program. When the wholescans are finished (ca. 10 min) amessage box should pop up on thescreen. Save the final spectra whichis an average of a large number ofsingle scans. Switch from thecollect window to a data window.Print the overview spectra whichshows all the lines (include that inyour lab report).7) Select different regions of thespectra e.g. by drag –draw andclicking in the box. Scale the plot.Go to analyze data and find peaksto determine the exact peak positions.You have to define a threshold for thepeak find algorithm for distinguishingthe background and the peaks. Click onreplace to activate the labeling tools.Fig. 6: Parameter menu.3) Type in the password which isburghaus1 and the user name which isCHEM4715
you can. Use different tables for thedifferent isotopes.4) Use the equation (m) νν(m 1) - ν(m) (2Be - 3αe) 2αemwhich is discussed above, and plot (m) versus m. Use a linear least νLabel the peak positions in a decentway. Print and store the result. Repeatthat procedure for all regions where aset of IR peaks has been detected.D) CALCULATIONS / PROBLEMSEspecially for this experiment, we expect aclear structure of your lab report. Please,explain to us how you have analyzed yourspectra. Use clear and well structuredgraphs and tables. Label the graphs, explainthe meaning of your variables andparameters. Otherwise, it is hard tounderstand your writing. If we do notunderstand it your grade might beaffected Include an overview spectra inthe lab report as well as “blow ups” of thespectra. Label and number the attachments.We have included more hints about howto analyze the spectra than in older versionsof the lab handout, since this experimentmight be the most difficult one of the class.However, do not just copy old lab reports.Do it by yourself!Please, answer the following questionsand include the calculations as detailedbelow in the lab report. Please use thefollowing numbering also in your labreport (discussion section).1) You should observe a splitting of thelines (Fig. 7). Assign the major linesand the minor ones to the differentisotopes of HCl contained in the gascell. Is the line splitting related to thedeuterated gas or to the different Clisotopes? Note, consider the differencein the reduced mass of differentisotopes.2) You should observe different groups oflines. Assign them to the differentisotopes as well. Some lines might berelated to impurities of the gas. Try toassign them also. Label the overviewspectra accordingly.3) Index the lines in the spectrumaccording to the m values, using Figure3 as a guide. Construct a table of wavenumbers versus m for as many lines assquares fit. From the slope andintercept, determine the rotationalconstant, Be, and the rotation-vibrationcoupling constant, αe.Include adiscussion of that procedure and theequations in your lab report. See thenote of the figure caption of Fig. 3. Acommon mistake is to assign the mvalues with the wrong sign.5) Next, use the equation2 ν0 (2Be - 2αe)m - αemνe (see above) to determine the value of ν0, the frequency of the n" 0 to n" 1vibrational transition. That equation canbe rewritten as νe A(m) ν0 .Thus, ν0 can be determined from the vs. A(m).intercept of a plot of νeAgain, include a discussion of thatprocedure in your lab report. A(m) is afunction of m.6) From the rotational constant asdetermined above and2Be h / (8π Ic)determine the value of the equilibriuminternuclear distance, r, for HCl andDCl. Note I µr2, with µ denoted to thereduced mass. 7) From the value obtained for ν0,calculate the vibrational force constant,k, for HCl and DCl in millidynes perangstrom. Note ν0 1/(2πc)sqrt(k/µ).8) Be sure to include estimateduncertainties in each of your derivedparameters; since the parameters are6
related to your plots, it is not a largeeffort to do so. Compare your resultswith literature values. Include thereferences.9) Discuss what additional informationwould also be needed to determine thevalue of the anharmonicity constantχe νe. How might this information beobtained experimentally?10) Briefly, how is a Fourier-Transform IRspectrometer working? What is theadvantage as compared with a gratingsspectrometer? Your lab report should include thefollowing spectra (peaks labeled withthe m number and wave number) aswell as the corresponding tables:overview spectra, HCl35 (with labels),HCl37 (on a second paper sheet andlabeled, otherwise you cannot readanything), DCl35, DCl37. Tables with theslope and intercept of the linear fits youhaveusedtodeterminethespectroscopic parameters.Safety notesLiquid nitrogen can lead to severe injures.Gradingand how to write the labreport.This may be the laboratory experiment withthe most difficult data discussion section.The following structure is recommendedfor the HCl/DCl laboratory report.1) Title of the experiment, date, yourname2) Abstract (approx. 1/3 of a page) – 5% What is what in your spectra? Peakassignments. All parameters obtained includingmeasuring errorsE) References1. “Experiments in Physical Chemistry”from D.P. Shoemaker, C.W. Garland,J.W. Nibler, McGraw-Hill.2. Copies of the manual of the IRspectrometerandsomemoreinformation is included in the infofolder.3. A power point presentation about FTIRis available from the lab class web siteathttp://www.uwe.burghaus.deorthrough the chemistry department website.3) Introduction/Theory (one page) – 5%Look through your quantum mechanicsnotes (or the web site for this class) andsummarize the theory of this experiment inone page. Harmonic oscillator Rigid rotor Rigid - rotor harmonic oscillatorapproximation Improvements on these approximations4) Experimental procedures (one page) –5% How is a FT-IR system working? Theidea, the concepts. What is the advantage of FT-IR ascompared with dispersion typespectrometers.We have discussed this in detail in class,pull out your notes.Web eb/chemudl/Spectrometer doc.html5) Data presentation (briefly) – 5%7
Just one sentence and your data plots.Number the spectra. Fig. 1, Fig. 2, Fig. x.This is a simple equation, plug in yournumbers. See D6.6) Discussion (a number of pages)6.6 Force constant – 5%This is a simple equation, plug in yournumbers. See D7.6.1 Peak assignment (1/3 page) – 5%What is what and why? We have HCl, DCl,and their isotopes. Larger mass smallerwave number, why? Look at the reducedmass. Perhaps add a table and a small Fig.7. Summary – 10%Make a table with all the spectroscopicparameters and add some sentences.Estimate the measuring errors for one ofthe isotopes. The errors are obtained fromyour plots. This is part of the discussion. –20%6.2 Label the peaks (1/4 page) – 5%What is the m quantum number?What is an R and P branch?Labelthespectraaccordingly.Double check this; otherwise all thefollowing plots will be wrong. See D1-D3.Decent structure of your lab report 20%Think about it by yourself. What would bea good structure of the draft; use subheadings. Some people mix up the datapresentation with the discussion part whichleads typically to a chaotic outline. Use thestandard structure outline above; it's thesimplest way to "write a paper". Use aformula editor for typing equations.6.3 Rotational constant and rotationvibration coupling constant - 20%Read p.25 of this lab handout, it isexplained how to do this on p.25.You need several tables and plots here forthe different isotopes. Problems? Stop by inmy office. (See D4)6.4 ν0 – 20%Plots & table. See D5If you add up the percentages you couldobtain in principle 125%.6.5 Equilibrium internuclear distance – 5%8
Fig.1: Potential energy curve.lation 2 and the known excitation energiesof the product atoms. A formula isdeveloped for the location of the bandheads, and the spectroscopic parameters ofthe excited electronic states are calculated.12) Band Spectrum andDissociation of theIodine MoleculeA) ABSTRACTThe analysis of the visible band spectrum ofiodine leads to the spectroscopicdetermination of molecular energy levelsand thermodynamic quantities. In thisexperiment, the visible absorption spectrumof iodine is observed using a recordingspectrometer. The wavelengths and energies(cm-1) of the bands are tabulated and the2Birge-Sponer example: Most students last year haddifficulties with the Birge-Sponer technique.Therefore I was looking for an example which isgiven at the end of the lab handout.dissociation energy Do is calculated usingthe graphical Birge-Sponer extrapo9
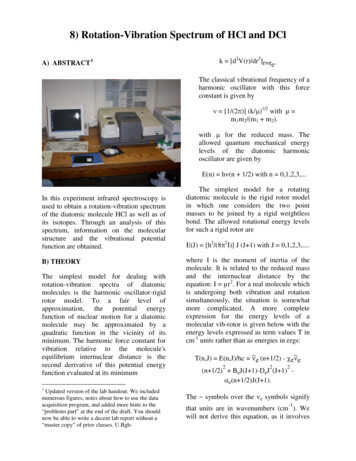
Fig.2: Absorption spectrum of I2. Your spectra will look quite different, but the figure helpsfor assigning the peaks. Here, energy increases ( λ decreases) from right to left.measuring spectra at a higher energy andwill thus not be interested in the state A.The upper curve in Fig. 1 is*obtained when an excited iodine atom, I ,combines with a ground state iodine atom,I, to form a stable molecular state labeled B.The observed light absorption in thisexperiment is a result of electronictransitions from X to B.The spectroscopic parameterswith which we will be dealing are labeled inFig. 1. In discussing the potential energiesof the electronic states, we will refer totraditional spectroscopic practice anddistinguish the parameters for the upperstate with a prime (′) and the parameters forthe ground state with a double prime (′′).De and Do represent thedissociation energies from the equilibriumposition (bottom of the potential well) andfrom the ground vibrational state (v 0),B) THEORYIn Fig. 1 the potential energy, E, is shownas a function of the internuclear distance, r,for a diatomic molecule. The lowest curve(X) represents the combination of twoiodine atoms to form a stable molecule intheir lowest ground electronic state. Theletter X is the accepted nomenclatureamong spectroscopists to designate thelowest energy (ground) electronic state ofthe molecule. The next electronic states arelabeled A, B, C, etc. in order of increasingenergy.Note that the level A is also due tothe combination of two iodine atoms intheiratomicgroundstates.Thiscombination is in a slightly differentconfiguration, resulting in a slightly highermolecular electronic energy. The state A isresponsible for absorption in the infraredregion. In this experiment we will be10
respectively. The energy difference betweenthe minima of electronic states X and B isrepresented with νe. The vibrational stateswithin each electronic state are labeled v 0, 1, 2, etc. Energy differences betweenvibrational levels within the same electronicstate are labeled with ω. Associated witheach vibrational level are many rotationallevels whose energy spacing is muchsmaller than the ω′s and are therefore notconveniently shown in the diagram. Whenindicated, they are usually designated withthe letter J.One possible change in themolecule’s internal energy is indicated inFig. 1 by the arrow labeled ν. The transitionindicated is from the zeroth vibrationallevel of X to the third vibrational level of B.In spectroscopic shorthand this would bewritten: (B,v′ 3 X,v′′ 0), where thedirection of the arrow indicates absorption.If it is understood which two electronicstates are involved in the transition, thenone may adopt a simpler notation: (3′ 0′′). The energy of this transition or anytransition is just the energy of the upperstate minus the energy (in cm-1) of theχe term corrects the energy for the fact thatthe potential energy surface is not trulyharmonic. We therefore call ωeχe theanharmonicity constant. Using equation (2)we can rewrite equation (1) as:2ν νe [{ωe′(v′ 1/2) - ωe′χe′(v′ 1/2) }2- {ωe′′ (v′′ 1/2) - ωe′′χe′′ (v′′ 1/2) }].(3)This equation relates the physicalobservable, ν, to fundamental quantities ofthe system. You will need (see below) tocalculate energy differences according toω′ ν ν(v′ 1) - ν(v′). (4)lower state: ν Eupper – Elower. Theenergy of the upper state is: Eupper Te′ G(v′) where Te represents electronic energyand G(v) represents vibrational energy(rotational energy will be neglected).Similarly, the energy of the lower state is:Elower Te′′ G(v''). Thus we may write:ν {Te′ G(v′)}- {Te′′ G(v′′)}.Rearranging this equation yields:ν {Te′ - Te′′} {G(v′) - G(v′′)}Now from Fig. 1 we see that the differencein the electronic energies (Te′ - Te′′) νe,so we may write:ν νe {G(v′) - G(v′′) }(1)Quantum mechanics tells us that the energyof a vibrational state is:2G(v) ωe(v 1/2) - ωeχe(v 1/2) ,(2)where ωe is the characteristic orfundamental vibrational frequency. The ωeA representative absorption spectrum for I2is shown in Fig. 2. Each small bumpcorresponds to a transition between twovibrational levels (v′ v′′) and is called aband. When observed with a spectrometerof very high resolution, these bands areseen to consist of many lines correspondingto transitions between individual rotationalstates of the two vibrational states involved.You will notice that there are actually threeseries of absorption lines which overlap inthe spectrum. These are labeled accordingto whether they arise from v” 0, 1, or 2 ofthe ground electronic state. Part of your jobin assigning the spectrum will be to identifywhich lines belong to which transitions.You will also notice that beyond a certainminimum wavelength (maximum energy,-1cm ) the spacing between bands appears todecrease to zero. This is referred to as theconvergence limit, and the energySetup of the spectrometer.11
In this experiment, you will firstassign the observed bands to differentspectroscopic transitions. In order to extractthe maximum possible data from thespectrum, you will need to observeprogressions (see Fig. 2) from at least threedifferent vibrational levels of the groundelectronic state. This means that thetemperature of the I2 gas in the cell shouldbe elevated during the data collection. Thismay be accomplished by wrapping themiddle of the cell with heating tape, orusing a heat gun and gently heating the cellto ca. 40 C.corresponding to this transition is shown in*Fig. 1 as E . Beyond the convergence limit,the spectrum is continuous. One of thepurposes of this experiment is to locate thisconvergence limit precisely by means of aBirge-Sponer extrapolation.C) EXPERIMENTALPlace a few crystals of I2 in the 10 cmquartz cell and heat the cell gently untiliodine vapor saturates the cell. Do not heatthe cell near the windows.Place the sample and a blankcuvette in the sample compartment asshown in the figure below.D) ANALYSIS OF THE DATAThis might be the most difficult labreport you have to write, but do not justcopy old lab reports, try following theoutline below.I) Excited state potentialsa) First, the bands must be identified andnumbered according to the v’ and v” towhich they correspond. A goodreference point is the (v′ 29 v′′ 0)transition which occurs at 536.87 nm.Use Fig. 2 for finding the peakassignment for v’ v’’ 0. E.g. peakv’ 27 v’’ 1 is at the lowerwavelength side of 24’ 0”, etc.b) Make a table of those transitionscorresponding to (v′ ? v′′ 0).Tabulate the wavelength in Angstroms,the energies (ν) in cm-1 and thedifferences in energy (also in cm-1), seeEq.(4).c) Starting with some chosen band, vn′,plot the energy difference ν vs. thequantum number v′. This is known as aBirge-Sponer plot. The area under thisplot (in cm-1) plus the energy of theband (νn) from which you started the*plot is equal to the energy E on Fig. 1.This is the amount of energy needed for*the reaction: I2 I I .Start the program (click on scan button), goto the setup menu and obtain the visiblespectrum of I2from 650 nm to 490 nmon the CARY500 UV/Vis spectrometerusing the following settings:Scale 1 nm/cm;Scan speed 4 nm/min;Band width (SBW) .1 nmDouble beamFor printing and analyzing the data (usingthese settings), you will have to split thespectrum into 6 pieces to cover the entirewavelength range. Use the peak label tooland rescale the graph for getting good plots.12
*d) Calculate the value of E and use it to*calculate Do′′. The value of E(I ) hasbeen found experimentally to be 7598cm-1.e) The intercept of the Birge-Sponer plotwith the vertical line v’ -1 gives thevalue of ωe′. The slope of the plottedline is -2ωe′χe′. Using equations (3) and(4) show that this is true by deriving anexpression for ν in terms of ωe′ and ωe′χe′f) and calculate their values. Be sure toindicate the method used to find theslope of the graph.g) As a check, repeat your calculations bydoing a similar Birge-Sponer plot andanalysis with the data on the transitionsoriginating in the v′′ 1 band.h) Using the equation you have derivedand information from your plot, you cancalculate Do′.i) Having Do′ we are in a position tocalculate De′. Using equation (2) andFig. 1, derive an expression for De′ interms of Do′, ωe′ and ωe′χe′ andcalculate its value.k)l)m)n)ground state (v′′) bands and find theenergies:(v′ i v′′ 0) ,(v′ i v′′ 1),(v′ i v′′ 2)and calculate the energy differences (ω′′) between them.Using equation (2), write downexpressions for the energy differencesyou have just calculated and use theseexpressions to find ωe′′ and ωe′′χe′′.You should not put too much faith inthe value of ωe′′χe′′ you obtain (why?).Note, that is a tricky question. Onepossible result would beωe’’ 2 ν(0 1) – ν(1 2) andωe’’χe’’ ( ν(0 1) ν(1 2))/2.Repeat this procedure for a few morevalues of v′ which have transitions fromv′′ 0, 1 and 2.You should now be able to calculateDe′′ using the expression you derivedpreviously relating De, Do, ωe and ωeχe. (See question i above and Fig. 1).Finally, calculate the value of νe.III) DiscussionII) Ground state potentialsBe sure that all of your derivations are welllabeled and your calculations are easy tofollow. You may use the labels of theexercise given above (a, b, c ) in your labreport. Your discussion should indicate thatyou understand the physical meaning of theparametersyouhavecalculated.Specifically:α) Compare your values to literaturevalues. Literature values may be found ina paper by R. D. Verma, J. Chem. Phys.32, 738 (1960).β) Explain what is meant by "zero-pointenergy".γ) Explain why the spectrum becomescontinuous beyond a certain energy. Whatj) We now have a fairly detailed picture ofthe excited state potential. The onlyinformation we have so far about theground state is Do′′. As you have seenfrom the previous analysis, we useenergy differences, (the ω′ s in Fig. 1),to characterize the excited statepotential. We would like to do the samethingforthegroundstate.Unfortunately, we only have twodifferences (ω′′ s) available. You shouldexpect then that the error in calculatingthe ground state parameters will belarger than the error in the excited stateparameters. Choose a v′ band (i) whichhas transitions from each of the three13
would the energy levels be if theanharmonicity constants were zero?δ) Is it possible to observe the (v′ 0 v′′ 0) transition in this experiment? Whyor why not?Literature[1] J.I. Steinfeld, Molecules and Radiation –An Introduction to Modern MolecularSpectroscopy, Harper & Row (1974).Chapter 4.5, p. 105, Department librarycode is Chem. QC 454 M6 S8314
Birge-Sponer exampleMost students last year had difficulties with the Birge-Sponer technique. Therefore I waslooking for an example which is given below.QuestionFor HgH the vibrations, νn, have been determined experimentally:v 0 -- 11203.7 cm-1v 1 -- 2965.6 cm-1v 2 -- 3632.4 cm-1v 3 -- 4172.0 cm-1Calculate the dissociation energy and extrapolate the missing data by a linear interpolation bymeans of the Birge-Sponer technique.AnswerAccording to the figure we have Ediss E1 E0 E2 E1 . E1 E2 or Ediss ( En 1 En ) Gn .n 0A linear regression (or linear least squares fit) would yieldν[cm 1 ](ν) 1429.1cm 1 342.8(ν 1 2)cm 1 .Now Ediss corresponds simply to ½ of the area, A, of the square defined by A lx*ly with lyobtained from the fit with n 0 which equals 1429.1cm-1 and ly obtained from the fit withν[cm 1 ](ν) 0 which amounts to ly 1429.1/342.8 4.16.Hence, A ½*1429.1*4.16 cm-1 2972.5 cm-1.Or directly νν 1 1203.7 965.6 632.4 172cm 1 2973.7cm 1ν 0Other techniques use a parabola instead of a linear function.15
I hope that example wh
screen. Save the final spectra which is an average of a large number of single scans. Switch from the collect window to a data window. Print the overview spectra which shows all the lines (include that in your lab report). 7) Select different regions of the spectra e.g. by drag draw and - clicking in the box. Scale the plot.