Transcription
COOPERATIVE INSTITUTIONAL RESEARCH PROGRAMat the HIGHER EDUCATION RESEARCH INSTITUTE AT UCLAcirpthe american freshman:national normsfall 2012cirpCOOPERATIVE INSTITUTIONAL RESEARCH PROGRAMat the HIGHER EDUCATION RESEARCH INSTITUTE AT UCLAJohn H. PryorKevin EaganLaura Palucki BlakeSylvia HurtadoJennifer BerdanMatthew H. CaseExpanded Edition
The American Freshman:National Norms Fall 2012Prepared by the Staff of theCooperative Institutional Research ProgramJohn H. PryorKevin EaganLaura Palucki BlakeSylvia HurtadoJennifer BerdanMatthew H. CaseHigher Education Research InstituteGraduate School of Education & Information StudiesUniversity of California, Los Angeles
Higher Education Research InstituteUniversity of California, Los AngelesSylvia Hurtado, Professor and DirectorHERI Affiliated ScholarsWalter R. Allen, Allan Murray Cartter Professor ofHigher EducationAlexander W. Astin, Founding Director andSenior ScholarHelen S. Astin, Senior ScholarMitchell J. Chang, ProfessorPatricia M. McDonough, ProfessorJosé Luis Santos, Assistant ProfessorLinda J. Sax, ProfessorRick Wagoner, Assistant ProfessorVictor B. Sáenz, Associate Professor,University of Texas at AustinThe Higher Education Research Institute(HERI) is based in the Graduate School ofEducation & Information Studies at theUniversity of California, Los Angeles. The Instituteserves as an interdisciplinary center for research,evaluation, information, policy studies, andresearch training in postsecondary education.3005 Moore Hall/Mailbox 951521Los Angeles, CA 90095-1521www.heri.ucla.edu310-825-1925CIRP Advisory CommitteeBetsy O. BarefootVice PresidentJohn N. Gardner InstituteVictor M. H. BordenAssociate Vice President and ProfessorIndiana UniversityMark L. GuntyAssistant Director of Institutional ResearchUniversity of Notre DameMarsha Hirano-NakanishiAssistant Vice Chancellor, Academic ResearchCalifornia State UniversityOffice of the ChancellorChristine M. KellerAssociate Vice President for Academic AffairsAssociation of Public and Land Grant UniversitiesKurt J. KepplerVice Chancellor for Student Life andEnrollment ServicesLouisiana State UniversityRandy L. SwingExecutive DirectorAssociation for Institutional ResearchSylvia HurtadoProfessor and Director, HERI(ex-officio)John H. PryorDirector, CIRP(ex-officio)ACKNOWLEDGMENTS: Cover design by Escott & Associates. Page layout and text design by The Oak Co.The authors wish to thank Laura Bernhard for her assistance in the preparation of this manuscript.Published by the Higher Education Research Institute.Suggested citation:Pryor, J. H., Eagan, K., Palucki Blake, L., Hurtado, S., Berdan, J., & Case, M. H. (2012). The Americanfreshman: National norms fall 2012. Los Angeles: Higher Education Research Institute, UCLA.To download additional copies of this monograph with expanded tables, please right 2012By the Regents of the University of CaliforniaISBN 978-1-878477-18-7 (paperback)ISBN 978-1-878477-19-4 (e-book)ISBN 978-1-878477-21-7 (e-book, expanded edition)ISBN 978-1-878477-22-4 (print-on-demand edition)
CONTENTSIntroduction1The American Freshman: National Norms Fall 20123Increased Impact of Economics4A Mismatch between Expectations and Reality of Time to Graduation5Increasing Support of Same-sex Marriage6Changes in Students’ Political Views and Orientation between 2008 and 20126Revised Majors in 201210Students Following a Pre-Med or Pre-Law Track10Differences in Math Preparation11Specific Academic Habits on the Rise14More Entering Students Felt Overwhelmed as High School Seniors14Changing Patterns in Where Students Reside16References18The 2012 National NormsFull-Time, First-Time Freshmen by Institution TypeAll RespondentsMale RespondentsFemale RespondentsFull-Time, First-Time Freshmen by Institution Type and SelectivityPublic/Private Universities and Nonsectarian Four-year CollegesPublic, Catholic, and Other Religious Four-year Colleges21477399125Appendix A: Research Methodology151Appendix B: The 2012 CIRP Freshman Survey Instrument161Appendix C: Institutions Participating in the 2012 CIRP Freshman Survey169Appendix D: The Precision of the Normative Data and Their Comparisons179Appendix E: Changes to the Undergraduate Major Response Optionsfor the 2012 Survey183About the Authors189iii
iv
INTRODUCTIONThe past year saw intensified discussion aboutalmost everything connected with higher education, but especially the increasing cost ofattending college and the worth of a collegedegree, graduation rates, what the impact of themassive open online course (MOOC) will be,and various takes on “disruption.” While manydiffering viewpoints are espoused, one certaintyis that well-conducted and relevant educationalresearch is necessary. The Higher EducationResearch Institute (HERI) is a leading source ofsuch information, and the past year saw a varietyof research published using CIRP data, some ofwhich we highlight below.The 2011 HERI Faculty Survey results werereleased this year in our monograph entitled“Undergraduate Teaching Faculty: The 2010–2011 HERI Faculty Survey.” This was the firstyear in which stress related to economic issues,such as institutional budget cuts and personalfinances, rivaled top sources of stress (selfimposed expectations and lack of personal time)from past HERI Faculty Surveys. The reportalso examined the role of part-time faculty oncampus, showing that many feel they lack accessto key institutional resources. We also addressedstudent-centered teaching methods, such ascooperative learning and student presentations,which continue to be used at an increasing rate,but differ in their use by discipline and otherfactors. Planning is currently underway for the2013–2014 HERI Faculty Survey.The Spring 2012 issue of AAC&U’s LiberalEducation focused on diversity and civiclearning, including an article by HERI DirectorSylvia Hurtado and CIRP Assistant Director forResearch Linda DeAngelo that used multipleCIRP datasets. In one instance, combiningCIRP Freshman Survey data with matched datafrom the Your First College Year (YFCY) Survey,the authors looked at two CIRP Constructs:Habits of Mind (traits associated with academicsuccess) and Pluralistic Orientation as outcomesin the first year of college. The article providesevidence of the impact of college programs andstudent experiences on academic, diversity, andcivic outcomes taken from a series of researchprojects at HERI. Along the way it demonstrated the ability of CIRP surveys to be powerful tools to assess progress along multiple areasthat matter to colleges and universities.Extending HERI’s previous studies on graduationrates, in a white paper commission by the GatesFoundation, Pryor and Hurtado (2012) examined the incoming characteristics of “mobilecompleters”: those students who graduate witha bachelor’s degree, but not at the institutionat which they first started college. The authorsfound that “mobile completers” were similar tothose students who completed degrees at theirinitial college (“stayer completers”) in many areas,but were similar to those that left and did notobtain a degree anywhere else in terms of considering the cost of attending college as animportant factor. They were also more likely tohave chosen first institutions that had a largerpercentage of students who intended, uponentry, to transfer to another institution.1
Gayles, Rockenbach, and Davis (2012) combined 2000 CIRP Freshman Survey data withthe follow-up 2003 College Students Beliefsand Values Survey (CSBV) in a study of 3,680students at 46 institutions. The CSBV was partof a larger multi-year longitudinal project atHERI that led to the recent book, “Cultivatingthe Spirit: How College Can Enhance Students’Inner Lives” (Astin, Astin, & Lindholm, 2011).Gayles et al. used structural equation modelingto look longitudinally at student-athletes’ socialactivism goals and charitable involvement. Theauthors found that student-athletes were notstatistically different from non-student-athletesin their goals to help promote racial understanding and to become community leaders,among other survey items used to measure socialactivism goals. Student-athletes, however, havegreater time constraints which may inhibit theirabilities to enact those goals, as they were foundto be less involved in charitable activities suchas volunteering.Chang, Eagan, Lin, and Hurtado (2011) examined racial stigmas and persistence of underrepresented minorities in the biomedical andbehavioral sciences, using matched data fromthe CIRP Freshman Survey and the YourFirst College Year Survey. They found thatunderrepresented minority first-year studentswho experienced higher levels of negativeinteractions were less likely to persist in thebiomedical and behavioral sciences.Looking at 2005 Freshman Survey data, Sax,Riggers, and Eagan (2013) used multilevelmodeling to measure levels of academic engagement of an incoming cohort of women students,taking into account the type of high schoolthese women attended. They found thatwomen who had attended single-sex highschools versus schools that are coeducationalwere more likely to be academically engaged,measured by actions such as interactions withteachers, tutoring other students, and beinginvolved in student organizations.Additional articles recently published usingCIRP data include Park and Eagan’s (2011)study looking at students who were more likelyto enroll in college early due to early actionand early decision admissions programs; andBowman, Brandenberger, Hill, and Lapsley’s(2011) longitudinal study examined the effect ofstudents’ engagement with racial/cultural diversity on personal growth. In addition, Santos,Hurtado, Sáenz, and Cabrera (in press) examineincoming Latina/o students’ financial concernsand trends in access.John H. PryorDirectorCooperative Institutional Research Program2
THE AMERICAN FRESHMAN:NATIONAL NORMS FALL 2012In this year’s CIRP Freshman Survey, the 47th annual administration, we see an increasedimpact of the global economic situation, most importantly on the benefits incoming studentssee of attending college and considerations in deciding which college to attend. Reflectinginterests in increasing college graduation rates, the 2012 survey added new questions thatprovide interesting information on how incoming students understand and take accountof such issues. In the wake of the federal elections, we compare political and social views offirst-year students in 2012 with the cohort entering four years ago in 2008.The results of this monograph are based upon data from 192,912 first-time, full-timestudents entering 283 four-year colleges and universities of varying levels of selectivity andtype in the United States. These data have been statistically weighted to reflect the approximately 1.5 million first-time, full-time first-year students entering 1,613 four-year collegesand universities across the country in 2012. This means differences of one percentage pointin the results published here reflect the characteristics, behaviors, and attitudes of roughly15,000 first-year students nationally. A complete discussion of the CIRP Freshman Surveymethodology, stratification scheme, and weighting procedures is presented in Appendix A.3
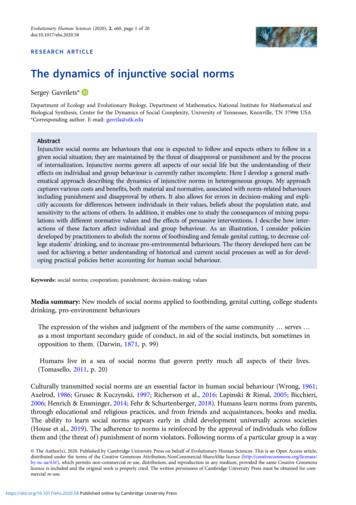
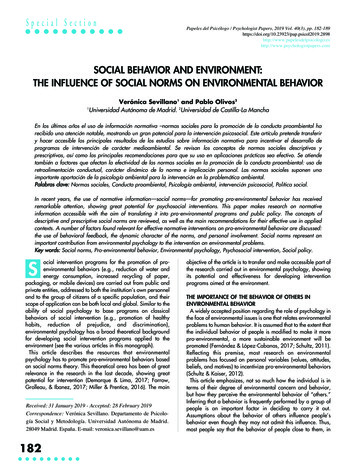
Incoming students persistin putting a premium onIncreased Impact of Economicsjob-related reasons to goMore students in 2012 believe that the currenteconomic situation significantly affected theircollege choice, rising to 66.6% in 2012 from62.1% two years earlier when we first askedthe question.to college.Incoming students persist in putting a premiumon job-related reasons to go to college. Continuing to rise is the importance of going to collegein order to get a better job, which rose twopercentage points this year to an all-time high of87.9%, up from 85.9% in 2011 and considerably higher than its low of 67.8% in 1976 (seeFigure 1). In the minds of today’s college students, getting a better job continues to be themost prevalent reason to go to college.Also at an all-time high as a reason to go tocollege is “to be able to make more money,”moving from 71.7% in 2011 to 74.6% in 2012.This is now the fourth-ranked important reasonto go to college, surpassing “to gain a generaleducation and appreciation of ideas,” whichis now at 72.8%. A related finding is that is“being very well off financially” as a personalgoal rose to an all-time high in 2012, with 81.0%of incoming students reporting this as a “veryimportant” or “essential” personal goal, up from79.6% in 2011.In looking at specific important reasons forchoosing the college they are attending, morestudents carefully considered “the cost ofattending this college,” which moved upwardsin importance to 43.3%. This is an increase of2.7 percentage points over the 2011 figure ofFigure 1. Trends of Reasons in Deciding to go to College(% Indicating “Very Important”)To be able to get a better jobTo be able to make more money100To gain a general education andappreciation of ideas9590% of 11994199720002003200620092012
40.6%. It is also an all-time high for this itemsince first asked in 2004, when only 31.0% ofincoming students thought that cost was “veryimportant.”This year sees 13.4% of incoming first-yearstudents reporting that not being able to affordtheir first choice was “very important” indeciding which institution to attend. This is thehighest this percentage has been since we firstintroduced the item in 2006, when it was 9.4%.The percentage of incoming students who reportthat not being offered aid by their first choicewas a “very important” reason in choosing whereto matriculate is at an all-time high of 9.5%.Although this is not markedly different from the9.3% that we reported in 2011, this figure hasmore than doubled from the 4.4% who were notoffered aid at their first choice in 1984, when wefirst asked the question.In a related item, only 59.3% of incoming firstyear students are attending their first choiceinstitution. This is a significant change fromthe 1970s and 1980s, when approximately threeout of four students were attending their firstchoice institution. We continue to see a large gapbetween those who were accepted at their firstchoice, at 76.7%, and those who are attendingtheir first choice institution, 59.3%, a gap of17.4 percentage points.A Mismatch between Expectations andReality of Time to GraduationLow graduation rates in the United States havebeen at the forefront of the national news,debated by higher education policy makers, andof great interest to researchers, including thoseat the Higher Education Research Institute.Reflecting this interest, new questions on theCIRP Freshman Survey for 2012 investigatedissues related to retention. To assist in interpreting this information, we also collected thelatest 4-, 5-, and 6-year graduation rate information from IPEDS on our participating schools aspoints of comparison.The vast majority (84.3%) of incoming first-yearstudents believe that they will graduate fromcollege in four years. This will likely only cometrue for approximately half of them, as they areattending schools that on average only graduate40.6% of their students in four years.The vast majority (84.3%) of incomingfirst-year students believe that theywill graduate from college in four years.This will likely only come true forapproximately half of them.An additional 15.8% graduate by the fifth year,although only 8.6% of incoming students expectit would take five years to graduate from college.For the sixth year, although an additional 4.5%graduate in that time, only 2.7% of first yearstudents think that it would take that long tograduate. Clearly there is a mismatch betweenreality and expectations. Despite efforts to publicize individual college graduation rates, manyincoming students seem to be unaware that mostcollege students are not graduating from thecollege they entered in a four-year period.Students attending private universities are themost likely to expect a five-year time to graduation, at 15.0%, in contrast to 7.8% from publicuniversities. Prospective engineering majors are5
Support for same-sex coupleshaving the right to legal maritalstatus is widespread amongstfirst-year college students, andcontinues to show gains.also more likely to expect a five-year path tograduation, with almost 1 in 5 (19.1%) anticipating the extra year. This is followed byprospective education majors, at 14.0%. Noother major categories are over ten percent forthis item.To further examine the relationship betweencollege graduation rates and college choice, weintroduced a new response category into the setof items that investigate how important certainreasons are in determining which college toattend. Only 30.4% of students report that “thepercentage of students that graduate from thiscollege” was “very important” in their decisionto attend that college. Given the economic realities of adding an extra year of college, and that66.6% report that the current economic situation significantly affected their college choice,there seems to be a gap in understanding therealities of the time to college completion by afair amount of incoming students.marriage, up 3.7 percentage points from 71.3%in 2011. Support has increased tremendouslysince the question was first introduced on thesurvey in 1997 when only half (50.9%) of allfirst-year students supported same-sex marriage.Of the ten social and political issue questions weasked on the 2012 survey, support for legalizingsame-sex marriage has the highest rate of agreement among incoming college students.As we have discussed in previous reports, thereare differential levels of support between students who identify either as liberal or conservative supporting same-sex marriage, with almosttwice as many liberal students expressing supportcompared to conservative students. Nine out often liberal first-year students (91.5%) supportlegalization of same-sex marriage while justunder half (47.0%) of conservative first-yearstudents are in support. Although the gap persists, incoming conservative first-year studentscontinue to shift towards favoring the legalization of same-sex marriage at a fast rate, movingfrom 42.8% just last year to 47.0% in 2012.As of the most recent election, nine states havelegalized same-sex marriages, most of which arein the more liberal-leaning northeast part of theUnited States. Accordingly, students attendingcolleges in the New England region are the mostsupportive of same-sex marriage, at 85.3%. Thisis twenty percentage points higher than in theSoutheast, where a significantly fewer (but still amajority) 65.3% of incoming first-year studentssupport same-sex marriage.Increasing Support ofSame-sex MarriageSupport for same-sex couples having the right tolegal marital status is widespread amongst firstyear college students, and continues to showgains. In 2012, three quarters (75.0%) of allincoming first-year students support same-sex6Changes in Students’ Political Views andOrientation between 2008 and 2012In the 2011 Freshman Survey report we examined student support for several political andsocial issues. Given that the U.S. just had
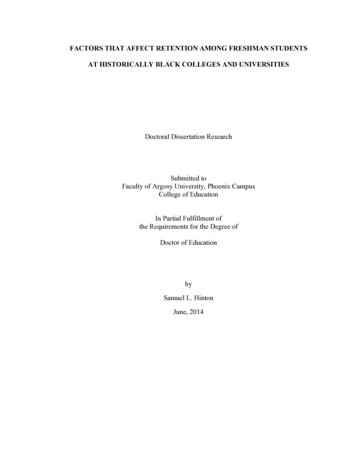
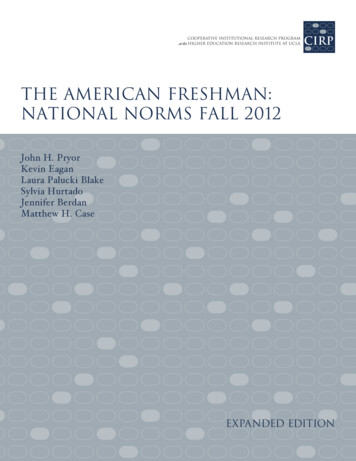
Figure 2. Political Orientation in 2008 and 2012, by SexMen 200860Men 2012Women 200848.050% of Studentsanother presidential electionin November of 2012, wecan now compare politicaland social views across tworecent election years: 2008and 2012.44.247.0Women 201242.537.4403032.330.325.525.6We ask students both to20.0 20.720identify their political orientation on the survey as well10as to agree or disagree withspecific social and political0views. In one significantConservative/Far RightMiddle-of-the-roadpoint of comparison,students moved towards thecenter in self-perceived politicalorientation, with the “middle-of-the-road”When we look at changing views regarding category growing from 43.3% in 2008 to 47.5%specific issues, however, the findings are somein 2012.what mixed. Figure 3 shows changes in supportFigure 2 shows the change in political orientation for men and women from 2008 to 2012 indetail. Neither men nor women changed appreciably in identifying as “conservative” or “farright” in 2012, as roughly a quarter of incomingfirst-year men and one fifth of first-year womenmarked “conservative” or “far right” in both2008 and 2012. By contrast, fewer men andwomen identified as “liberal” or “far left” in2012 compared with 2008. The proportionof left-leaning men dropped by nearly fourpercentage points from 2008 to 2012 (30.3% in2008 vs. 26.4% in 2012) while the percentage ofwomen identifying as liberal or far left droppedby approximately five percentage points (37.4%in 2008 vs. 32.3% in 2012).The consistency in the proportion of conservative-leaning students and the drop inthe percentage of left-leaning students resultedin this increase of students identifying as“middle-of-the-road.”26.4Liberal/Far Leftfor four political or social issues. While higherproportions of incoming students in 2012endorsed more liberal positions in two areas(abortion and preferential treatment for disadvantaged students in college admissions),more incoming students supported a moreconservative opinion in two other areas (racialdiscrimination and the necessity of a nationalhealthcare plan).Support for the position that abortion shouldbe legal increased by 2.9 percentage pointsin 2012 compared to 2008, with 61.1% ofincoming first-year students endorsing thelegality of abortion. Much of the increase insupport of abortion came from students identifying as “far right” or “conservative.” Whereas31.8% of incoming conservative students in2008 “agreed somewhat” or “agreed strongly”that abortion should be legal, that figure jumpedto 38.5% in 2012. Students in 2012 who identified as “middle-of-the-road” also increased theirsupport for abortion by nearly five percentage7
Figure 3. Support for Social and Political Views, by Year(% Indicating “Agree Strongly” or “Agree Somewhat”)807070.362.758.2% of Students60200861.120125039.54041.93020.12023.0100A National Health Care PlanIs Needed To CoverEverybody’s Medical CostsAbortion Should Be LegalStudents from DisadvantagedSocial Backgrounds ShouldBe Given Preferential Treatmentin College Admissionspoints over their peers in 2008 (56.7% in 2008vs. 61.1% in 2012). Liberal students continuedto support the legality of abortion at high rates(77.8% in 2008 vs. 79.2% in 2012).Support for giving preferential treatment incollege admissions to students from disadvantaged backgrounds increased from 2008 to2012. Over forty percent of incoming studentsendorsed this position in 2012 (41.9%), a2.4 percentage point increase over 2008 (39.5%).Middle-of-the-road (39.5% in 2008 vs. 42.4%in 2012) and left-leaning students (44.6% in2008 vs. 50.0% in 2012) increased in theirsupport of this issue while right-leaning students’support remained relatively stable (31.1% in2008 vs. 30.1% in 2012).A smaller proportion of incoming students in2012 agreed that the country needed a nationalhealthcare plan to cover everybody’s medicalcosts. Specifically, support for a national healthcare plan dropped by 7.6 percentage pointsbetween 2008 (70.3%) and 2012 (62.7%). Thechange was most dramatic among conservative8Racial Discrimination Isno Longer a Major Problemin Americastudents: although 44.8% supported nationalhealth care in 2008, this plummeted to 30.4%in 2012. Support among middle-of-the-roadstudents dropped as well, but at a much lowerrate, from 71.1% in 2008 to 64.2% in 2012.Liberal students remained largely unchangedin their high levels of support during this timeperiod (85.3% in 2008 vs. 84.7% in 2012).Students’ views on racial discrimination becameslightly more conservative between 2008 and2012. In 2008, 20.1% of incoming first-yearstudents agreed that racial discrimination wasno longer a problem, and that figure increasedby 2.9 percentage points in 2012 to 23.0%.Right-leaning students were mostly unchangedbetween 2008 and 2012 in their endorsementof this position (30.1% in 2008 vs. 30.9% in2012). Both middle-of-the-road (20.3% in 2008vs. 23.2% in 2012) and left-leaning (13.3% in2008 vs. 16.5% in 2012) became more supportive of this position over the last four years.One of the primary issues of the 2012 presidential campaign and a contentious issue after the
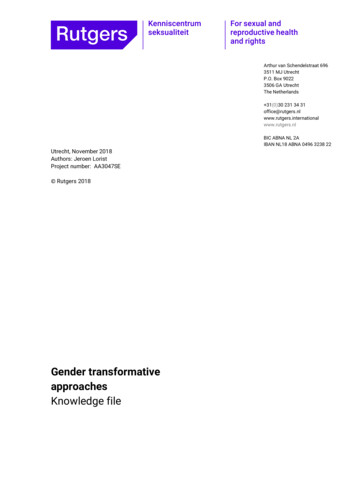
e lection focused on the so-called “fiscal cliff ”and tax reform, and Figure 4 highlights changesin students’ support for the position that thewealthy should pay more taxes. Overall, supportfor this perspective increased by 4.2 percentagepoints between 2008 and 2012 (60.4% in 2008vs. 64.6% in 2012). Across students’ politicalorientation, the changes moved in differentdirections. Students who identified as “far right”or “conservative” declined in their support forincreasing taxes on the wealthy (41.0% in 2008vs. 38.1% in 2012). By contrast, this issuegained support among both middle-of-the-roadand left-leaning. Specifically, roughly two-thirds(66.4%) of students who identified themselvesas middle-of-the-road agreed that the wealthyshould pay more taxes, which represented a6.5 percentage point increase for the samegroup in 2008. Additionally, more thanfour-in-five (82.4%) left-leaning students in2012 thought the wealthy should pay moretaxes—an 8.7 percentage point increaseover their left-leaning peersin 2008 (73.7%).A final note as we discusspolitical orientation. Anumber of studies usingCIRP data have pointed outthat some students becomemore liberal in their politicalstudents consider themselves as“middle-of-the-road,” these middleof-the-road students have decidedlymore progressive or liberalperspectives when asked aboutspecific social and political issues.orientation during college (see Astin & Denson,2009; Dey, 1996, 1997; Mariani & Hewitt,2008). Study after study concludes that anychange in the political orientation that occursamong students during college is predominantlyinfluenced by the political orientation of theirfellow students, and the overall campus climateperpetuated by their peers, not by the politicalorientation of the faculty.Figure 4. View that the Wealthy Should Pay More Taxes,by Political Orientation and Year(% Indicating “Agree Strongly” or “Agree Somewhat”)1009082.4200880201273.766.470% of StudentsThus, although nearly halfof all incoming studentsconsider themselves as“middle-of-the-road,”these middle-of-the-roadstudents have decidedlymore progressive or liberalperspectives when askedabout specific social andpolitical issues.Although nearly half of all incoming59.960504041.038.13020100Conservative/Far RightMiddle-of-the-roadLiberal/Far Left9
Revised Majors in 2012We revised our list of prospective majors withthe 2012 CIRP Freshman Survey, modernizingthe choices offered (see Appendix E for a list ofthe new majors and how they map onto the oldmajor categories). The changes of major categories were small, and mostly within the scienceareas (e.g., biology, from 8 majors to 12; engineering, from 8 majors to 13; and business, from8 majors to 12). In general, this had exactly theeffect we wanted: moving responses from “other”categories such as “other biology” or “other engineering” into the new more specific categories.As expected, there was not much change fromprevious years in the aggregated major categories, such as when we combined the 12 specificbusiness majors into one category of “business.”Majoring in business continues to be the intentof the largest block of incoming first-yearstudents, with 14.4% indicating a major in oneof the 12 business majors listed. This figure hasbeen relatively stable, in the thirteen to fifteenpercentage range, since 2009, when we saw adrop from the seventeen to eighteen percentageswe had seen previously.The next two highest prospective majors are inthe health professions (e.g., nursing; occupational, physical and speech therapy; etc.),at 14.1%, and biological sciences (12.6%).Engineering is close behind at 10.4%.Students Following a Pre-Med orPre-Law TrackOther new information in 2012 related tocourse of study is whether or not incomingstudents consider themselves pre-med orpre-law. Among all incoming first-year students,19.3% conceive of themselves as pre-med and1019.3% conceive ofthemselves as pre-medand 6.3% considerthemselves pre-law.6.3% consider themselves pre-law. Across institutional type, students entering historicallyblack colleges and universities (HBCU) are themost likely to report they intend to pursue apre-med track (22.9%).Approximately one-in-five (21.2%) students atpublic universities conceive of themselves aspre-med, only slightly more than at privateuniversities (19.1%). This small gap essentiallydisappeared when comparing four-year colleges,with 17.8% of incoming students at publiccolleges as pre-med compared to 18.2% atprivate colleges.Substantially fewer students across all institutional types report being pre-law, and this wasagain led by students at HBCUs, at 10.5%.Students who conceive of themselves as pre-medor pre-law are concentrated in just a few aggregated major categories. For example, Table 1shows that the vast majority of pre-med studentsintend to major in the biological sciences (43.7%)or the health professions (31.7%). Engineeringand physical sciences each attracted 3.7% ofpre-med students. The remaining roughly 20%of pre-med students intend to major in a nonscience field or marked undecided.With respect to future occupations, pre-medstudents are most likely to see themselves as
Table 1. Academic Major Intentions among Pre-Med and Pre-Law StudentsBiological & Life SciencesHealth ProfessionsSocial ScienceUndecidedEngineeringPhysical ScienceOther (Agriculture, Education, English, Fine Arts, Math/ComputerSciences, Library Science, Other Non-technical)BusinessArts & HumanitiesHistory or Political ScienceJustice and Securityphysicians, at 35.7%. This was followed bynurses (11.7%), therapists (7.0%), pharmacists(4.8%), dentists (4.1%), veterinaria
The American Freshman: National Norms Fall 2012 Prepared by the Staff of the Cooperative Institutional Research Program John H. Pryor Kevin Eagan Laura Palucki Blake Sylvia Hurtado Jennifer Berdan Matthew H. Case Higher Education Research Institute Graduate School of Education & Information Studies University of California, Los Angeles