Transcription
Authors:Luka Vidovic & Lei YueAnalytical Development GroupS&P Global Market IntelligenceMachine Learning andCredit Risk ModellingMachine Learning (ML) algorithms leverage large datasets to determine patterns and constructmeaningful recommendations. Likewise, credit risk modelling is a field with access to a largeamount of diverse data where ML can be deployed to add analytical value. In the following analysis,we explore how various ML techniques can be used for assessing probability of default (PD) andcompare their performance in a real-world setting.Machine Learning in FinanceA recent publication by the Bank of England (BoE) and the Financial Conduct Authority (FCA)reports the results of a survey on the use of ML in United Kingdom (UK) financial services.1Results show that two-thirds of respondents use ML in some form. The use cases have passed thedevelopment stage and are starting to enter into the deployment stage. The banking and insurancesectors are advanced with respect to deployment, and ML is most often used in anti-moneylaundering and fraud-detection applications. The survey also notes that ML may amplify existingmodel risk, while validation frameworks still need to evolve to cope with the complexity of MLapplications.As ML is becoming more represented and influential in finance, it is important to recognize itsbenefits and drawbacks to prudently evaluate its performance. ML models have the potential touncover subtle relationships, capture various nonlinearities, and process unstructured data. Forexample, applications such as fraud-detection analysis or textual data analytics benefit from notneeding to predefine structure, that is, the theory behind finding patterns and extractingmeaningful outputs. ML can do this without the need for humans to derive theoretical models withaccompanied assumptions, and the data is empirically driving the ML model.1Bank of England, Financial Conduct Authority: “Machine learning in UK financial services”, October 2019.Copyright 2020 by S&P Global Market Intelligence, a division of S&P Global Inc. All rights reservedspglobal.com/marketintelligence
However, ML may still contain assumptions, such as the dataset does not contain. This can pose asignificant challenge when analyzing noisy historical financial data and may lead to poor modelperformance. Imposing constraints on the model to control for model biases or counterintuitivebehavior can also be an onerous task for some ML techniques. In addition, decomposing MLmodels can be complicated, thus creating issues when there is a need to explain the model’sfunctionality in detail. 2 3 4 5BackgroundWe analyze the performance of selected ML algorithms for the prediction of PD. To make thisanalysis relevant and material, we use a real-world example of constructing a default predictionmodel for private companies. To that end, we collected a global sample of private companiesacross various industries. 6 Private companies are a particularly relevant example for our analysisfor a number of reasons. The universe of private companies is large and highly heterogeneous, as itincludes large international corporations, as well as local small- and medium-sized enterprises.The composition of a global sample captures companies from various macroeconomicenvironments, thus introducing additional macroeconomic risk components. Additionally, privatecompanies tend to publish limited and infrequent financial disclosures, which reduces the scopeof available information.The characteristics of private companies create a need for a default prediction model to be welldesigned in order to capture the heterogeneity of private companies and achieve good performanceunder the data availability constraints. We leverage the S&P Capital IQ platform to collect annualfinancials for private companies globally from 2002 to 2016. Our final sample includes a total of52,500 observations, of which 8,200 companies have defaulted.Feature Engineering: We ‘pre-treat’ the financial data by calculating relevant financial ratios toexpress various risk dimensions, such as profitability, leverage, and efficiency. We also include aCountry Risk Score (CRS) and Industry Risk Score (IRS) as additional variables to help the modelcapture systemic risk components of various countries and industries. We also standardize theratios to make them comparable and limit the impact of outliers, thus enabling the algorithms toachieve better performance.Variable Selection: To account for the limited availability of private company financial data, weonly use ratios that have sufficiently good coverage across the S&P Capital IQ platform, while alsoensuring the representation of relevant risk dimensions. Such parsimonious constructionsimplifies the use of the model in deployment, as it requires fewer inputs and less data handling,and increases the model coverage. This is especially important for private companies, where2Bazarbash, M.: “Fintech in Financial Inclusion: Machine Learning Applications in Assessing Credit Risk”, IMF Working Paper, 2019.Bracke, P., Datta A., Jung C. and Sen S.: ”Machine learning explainability in finance: an application to default risk analysis”, Staff WorkingPaper No. 816, Bank of England, 2019.4Rasekhschaffe, C. K. and Jones, C. R.: “Machine Learning for Stock Selection”, Financial Analysts Journal, 2019.5Addo, M. P., Guegan, D., Hassani, B.: ”Credit Risk Analysis Using Machine and Deep Learning Models”, Risks, 2018.6Financial sector is excluded from the analysis.3Copyright 2020 by S&P Global Market Intelligence, a division of S&P Global Inc. All rights reservedspglobal.com/marketintelligence
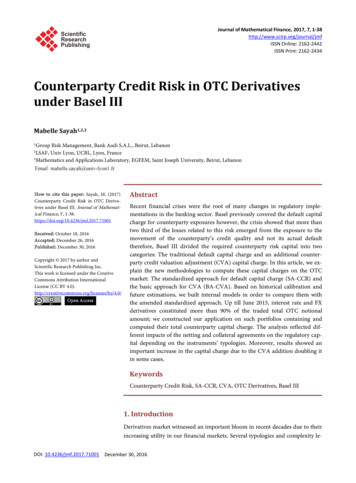
financial data is generally more infrequent and less comprehensive. Table 1 contains the final listof selected variables used to train the PD model with various ML algorithms.Table 1: List of variables used to train PD models for private companiesRisk TypeVariableRisk DimensionFinancial RiskTotal Equity / Total AssetsCapital StructureFinancial RiskCurrent Liabilities/Net WorthShort-term LeverageFinancial RiskReturn on Net CapitalProfitabilityFinancial RiskCash & Short-term Investments / Total AssetsLiquidityFinancial RiskNet Income/Total LiabilitiesDebt Service CapacityBusiness RiskTotal RevenuesSizeBusiness RiskNet Income/Total RevenuesEfficiencyBusiness RiskProperty, Plant and Equipment (PPE)/Total AssetsOperating FlexibilityBusiness RiskCRSCountry Risk ScoreBusiness RiskCPI GrowthConsumer Price Index (CPI)GrowthBusiness RiskIRSIndustry Risk ScoreSource: S&P Global Market Intelligence. As of January 21 2020. For illustrative purposes only.In-Sample and Out-of-Sample Analysis: We split the dataset of private companies into twosamples to help assess the performance of the model in a real-world deployment. The in-sampleportion (90%) represents our training dataset and is used to develop the model, while the out-ofsample portion (10%) is used to evaluate the model. We also make sure that the two datasets aresimilar with respect to the default rate and other descriptive properties (such as industry sectorsand revenue size).Different ML AlgorithmsThere are several ML algorithms available, and selecting the optimal algorithm is notstraightforward. Algorithm selection depends on various factors, such as data type and features,transparency and interpretability, and model performance characteristics. We selected thefollowing classification and regression algorithms for further analysis: Altman Z-score: The Z-score is an established model that leverages a linearcombination of financial ratios to estimate the likelihood of financial distress. Themodel is based on the discriminant analysis technique to optimize model parameters.Logistic regression: A logistic regression is a statistical model that uses a logit functionto model a binary dependent variable. It is a classical and widely used technique toCopyright 2020 by S&P Global Market Intelligence, a division of S&P Global Inc. All rights reservedspglobal.com/marketintelligence
model the PD. The optimization function usually tends to include a regularization term(e.g., lasso, elastic net, or ridge) to limit the overfitting.Support Vector Machine (SVM): A SVM is similar to logistic regression and constructs ahyperplane multidimensional surface to separate two classes in the dataset. Inputs aretransformed using a kernel function, allowing SVM to model nonlinear classificationproblems. However, by using a nonlinear kernel, the SVM becomes a black box becauseeach prediction is not easily attributable to an individual variable.Naïve Bayes: Naïve Bayes is a classification technique that utilizes Bayes' theorem withan assumption of independence among predictors. Although this assumption is oftenviolated in practice, naïve Bayes still tends to perform well. The technique is relativelyrobust and easy to implement, however, strong violations of the independenceassumptions and nonlinear classification problems can lead to poor performance.Decision Tree: A decision tree model produces a flow chart structure where modelprediction is obtained through a sequence of nodes and branches. While decision treesare a highly flexible tool, their usability may be hindered by poor out-of-sampleperformance as a result of overfitting. Various techniques exist to reduce overfitting bycontrolling the size of decision trees, such as pruning. We opted to contain the tree sizeby setting a limit of 50 observation per node.ResultsWe tested the performance of the described ML algorithms using our global sample of privatecompanies and accompanied variables, listed in Table 1. We implemented the analysis usingStatistics and ML Toolbox functions in MATLAB , and applied default algorithm settings to trainthe PD models and calculate their performance statistics. 7We evaluated the ML models using the receiver operating characteristics (ROC) curve andcorresponding area under the curve (AUC). Table 2 shows the in-sample and out-of-sample AUCperformance statistics. In-sample, the decision tree model exhibits superior performance with anear-perfect classification of defaulted and non-defaulted companies. Logistic regression andSVM are similar techniques and exhibit equally excellent performance, while the other twoapproaches demonstrate good or fair performance. 8Out-of-sample AUC, however, demonstrates a more realistic measure of the model’s performancein a real-world situation. While the decision tree method still shows the best performance, it is onlymarginally better than logistic regression. It is worth noting that the performance of the decisiontree deteriorates considerably out-of-sample compared to in-sample, indicating lower reliability ofthis method in a real-world application. In comparison, the other approaches exhibit moreconsistent performance.7MATLAB and Statistics and Machine Learning Toolbox 2019b, The MathWorks, Inc., Natick, Massachusetts, U.S.Typically, AUC values between 70% and 80% are considered fair, values between 80% and 90% are considered a sign ofgood discriminatory power, and values above 90% are considered excellent.8Copyright 2020 by S&P Global Market Intelligence, a division of S&P Global Inc. All rights reservedspglobal.com/marketintelligence
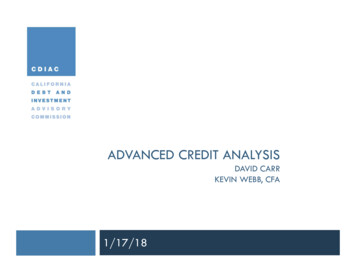
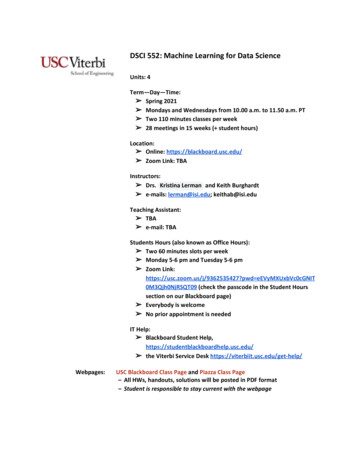
Table 2: AUC using various ML modelsZ-scoreLogisticSupport VectorRegressionMachineNaïveBayesDecision e79.4%93.6%93.1%89.8%94.8%Source: S&P Global Market Intelligence. As of January 21 2020. For illustrative purposes only.In Figure 1, we depict the out-of-sample ROC curves for the analyzed ML models. While two modelsmay have the same AUC, the shape of corresponding ROC curves may be very different. Forexample, the decision tree and logistic regression have very similar out-of-sample AUCs, but theircorresponding ROC curves are very distinct and cross at the low false positive rate and the hightrue positive rate. This reflects the Type I error and Type II error characteristics of the two models. 9The decision tree outputs are rather binary, i.e., producing PD estimates of either 0% or 100,resulting in a more abrupt shape. The logistic regression, however, produces much more granularand continuous estimates of PD, resulting in a much smoother shape of the ROC curve.Selection of the optimal model also depends on the use case. For example, Type I Error is morerelevant when the goal is to minimize the incorrect classification of borrowers as creditworthy.Type II error, on the other hand, is more relevant when the goal is to minimize denying a loan to acreditworthy customer. If users focus on identifying defaults among the worst companies, theymight prefer the decision tree model. However, those interested in good overall performance anddifferentiation among low-, medium-, and high-risk companies might favor the logistic regressionmodel. 109Type I error (false positive rate) is the probability of assigning a low PD to an obligor that will default. Type II error (false negative rate) isthe probability of assigning a high PD to an obligor that will not default.10Stein, M. R.: ”Benchmarking default prediction models: pitfalls and remedies in model validation”, Journal of Risk Model Validation, 2007Copyright 2020 by S&P Global Market Intelligence, a division of S&P Global Inc. All rights reservedspglobal.com/marketintelligence
Figure 1: Out-of-sample ROC curve for various ML models100%90%True positive 70%80%90%100%False positive rateNaïve BayesZ-scoreSupport Vector MachineDecision TreeLogistic RegressionRandom modelSource: S&P Global Market Intelligence. As of January 21 2020. For illustrative purposes only.In addition to model performance, transparency and interpretability also play a vital role in themodel evaluation. Namely, understanding drivers and the sensitivity of model predictions tochanges in the input is an important aspect of model usability. In that aspect, logistic regression ispreferred to SVM as it is more straightforward to analyze and interpret. The logistic regression alsoenables users to incorporate various constrains easily, thus making this technique highlycontrollable and adaptable.S&P Global Market Intelligence’s ApproachAt S&P Global Market Intelligence, we developed PD Model Fundamentals (PDFN) - PrivateCorporates, a statistical model that produces PD values for all private companies globally. Themodel is based on the maximum expected utility (MEU) theory and employs a logistic regressionalgorithm with ridge (Tikhonov) regularization. 11 12 The methodology includes a number of datahandling techniques to support robust treatment of financial ratios and management of extremevalues. The process of variable selection leverages a k-fold Greedy Forward Approach to support agood out-of-sample and out-of-time performance. The transparent, ‘glass-box’ model structure ofPDFN - Private Corporates enables users to understand the model behavior and easily analyzesensitivity and contributions of model inputs.11Friedman. C and Sandow S.: "Learning Probabilistic Models: An Expected Utility Maximization Approach." Journal of Machine LearningResearch, 4, 2003.12S&P Market Intelligence: “PD Model Fundamentals - Private Corporates”, White Paper, 2018.Copyright 2020 by S&P Global Market Intelligence, a division of S&P Global Inc. All rights reservedspglobal.com/marketintelligence
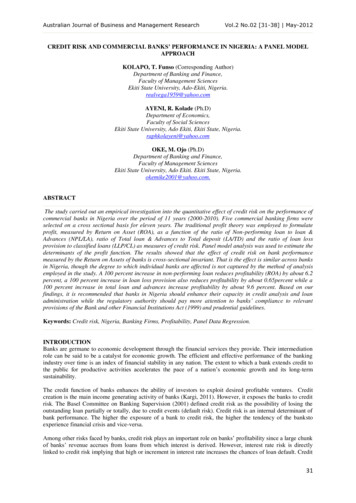
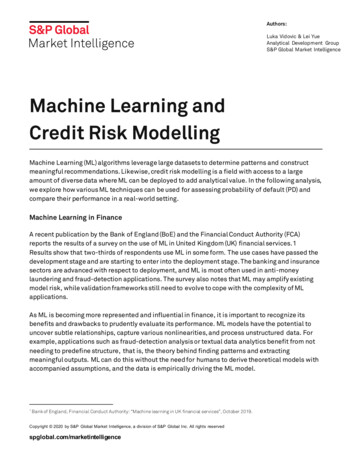
Figure 2 shows an example of PDFN - Private Corporates outputs for Neiman Marcus Group, Inc.(‘Neiman Marcus’), an omni-channel luxury fashion retailer primarily located in the U.S. Based onthe latest available financial data, the company’s PD of 4.1% implies a credit score of ‘b’. 13 The indepth analysis of the model drivers reveals that the retailer is highly risky from a financial andbusiness point of view. The contribution analysis shows that low profitability and high debt are themain drivers of the PD estimate. The sensitivity metrics indicate that Neiman Marcus’s credit scoreis highly sensitive to any adverse changes in industry and country risk factors.Figure 2: PDFN - Private Corporates outputs for Neiman Marcus Group, Inc.Note: Industry median calculated based on a sample of department stores in the U.S.Source: S&P Global Market Intelligence, as of January 21 2020. For illustrative purposes only.SummaryA prudent approach includes reviewing and assessing various techniques for the problem at hand.While all presented models could be further refined and optimized to achieve better performance,the knowledge of the end application should also be factored into the decision-making process. Ina real-world environment, this includes taking into account data availability limitations, modeltransparency requirements, the granularity of model outputs, and ease-of-use.13S&P Global Ratings does not contribute to or participate in the creation of credit scores generated by S&P Global Market Intelligence.Lowercase nomenclature is used to differentiate S&P Global Market Intelligence PD scores from the credit ratings used by S&P GlobalRatings.Copyright 2020 by S&P Global Market Intelligence, a division of S&P Global Inc. All rights reservedspglobal.com/marketintelligence
Copyright 2020 by S&P Global Market Intelligence, a division of S&P Global Inc. All rights reserved.These materials have been prepared solely for information purposes based upon information generallyavailable to the public and from sources believed to be reliable. No content (including index data, ratings,credit-related analyses and data, research, model, software or other application or output therefrom) or anypart thereof (Content) may be modified, reverse engineered, reproduced or distributed in any form by anymeans, or stored in a database or retrieval system, without the prior written permission of S&P GlobalMarket Intelligence or its affiliates (collectively, S&P Global). The Content shall not be used for any unlawfulor unauthorized purposes. S&P Global and any third-party providers, (collectively S&P Global Parties) do notguarantee the accuracy, completeness, timeliness or availability of the Content. S&P Global Parties are notresponsible for any errors or omissions, regardless of the cause, for the results obtained from the use of theContent. THE CONTENT IS PROVIDED ON “AS IS” BASIS. S&P GLOBAL PARTIES DISCLAIM ANY AND ALLEXPRESS OR IMPLIED WARRANTIES, INCLUDING, BUT NOT LIMITED TO, ANY WARRANTIES OFMERCHANTABILITY OR FITNESS FOR A PARTICULAR PURPOSE OR USE, FREEDOM FROM BUGS, SOFTWAREERRORS OR DEFECTS, THAT THE CONTENT’S FUNCTIONING WILL BE UNINTERRUPTED OR THAT THECONTENT WILL OPERATE WITH ANY SOFTWARE OR HARDWARE CONFIGURATION. In no event shall S&PGlobal Parties be liable to any party for any direct, indirect, incidental, exemplary, compensatory, punitive,special or consequential damages, costs, expenses, legal fees, or losses (including, without limitation, lostincome or lost profits and opportunity costs or losses caused by negligence) in connection with any use ofthe Content even if advised of the possibility of such damages.S&P Global Market Intelligence’s opinions, quotes and credit-related and other analyses are statements ofopinion as of the date they are expressed and not statements of fact or recommendations to purchase, hold,or sell any securities or to make any investment decisions, and do not address the suitability of any security.S&P Global Market Intelligence assumes no obligation to update the Content following publication in anyform or format. The Content should not be relied on and is not a substitute for the skill, judgment andexperience of the user, its management, employees, advisors and/or clients when making investment andother business decisions. S&P Global keeps certain activities of its divisions separate from each other inorder to preserve the independence and objectivity of their respective activities. As a result, certain divisionsof S&P Global may have information that is not available to other S&P Global divisions. S&P Global hasestablished policies and procedures to maintain the confidentiality of certain non-public informationreceived in connection with each analytical process.S&P Global Ratings does not contribute to or participate in the creation of credit scores generated by S&PGlobal Market Intelligence. Lowercase nomenclature is used to differentiate S&P Global Market IntelligencePD credit model scores from the credit ratings issued by S&P Global Ratings.S&P Global may receive compensation for its ratings and certain analyses, normally from issuers orunderwriters of securities or from obligors. S&P Global reserves the right to disseminate its opinions andanalyses. S&P Global's public ratings and analyses are made available on its Web sites,www.standardandpoors.com (free of charge) and www.ratingsdirect.com (subscription), and may bedistributed through other means, including via S&P Global publications and third-party redistributors.Additional information about our ratings fees is available at www.standardandpoors.com/usratingsfees.Copyright 2020 by S&P Global Market Intelligence, a division of S&P Global Inc. All rights reservedspglobal.com/marketintelligence
Credit Risk Modelling. Machine Learning (ML) algorithms leverage large datasets to determine patterns and construct meaningful recommendations. Likewise, credit risk modelling is a field with access to a large amount of diverse data where ML can be deployed to add analytical value. In the following analysis,