Transcription
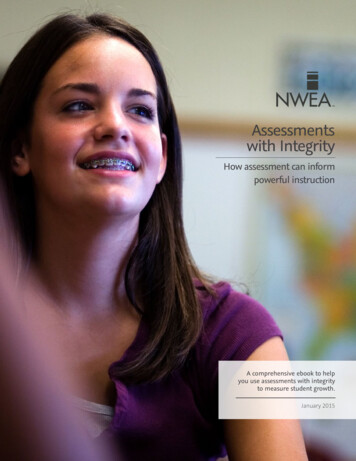
Assessmentswith IntegrityHow assessment can informpowerful instructionA comprehensive ebook to helpyou use assessments with integrityto measure student growth.January 20151 Partnering to Help All Kids Learn NWEA.org 503.624.1951 121 NW Everett St., Portland, OR 97209
IntroductionAfter devoting nearly 40 years to researching and developing high quality assessments, we atNorthwest Evaluation Association (NWEA ) have discovered one thing: assessment, whendone well, can make a profound contribution to helping all kids learn. But for any test to make areal difference for student learning, it must be built with integrity.Testing for the sake of testing helps no one; it is a waste of time for administrators, teachers, andstudents. On the other hand, assessing students with a rigorous, research-based tool can yieldinsights that help teachers deliver powerful, differentiated instruction to every student at theright time—allowing each individual to learn and grow.A truly useful assessment must begin by meeting students where they are. In addition, crucialassessment components—such as norms, standard error of measure, scales, and item pooldepth—must be built with integrity in order to yield actionable data that helps educators deliverthe right instruction for each student.Assessments developed with integrity are powerful tools that support educators and students inlearning. NWEA delivers assessments educators can rely on to provide the powerful data theyneed to help every student grow.ContentsMeeting Students Where They Are . . . . . . . . . . . . . . . . . . . . . . . . . . . . . . . 3The Need for Norms . . . . . . . . . . . . . . . . . . . . . . . . . . . . . . . . . . . . . . . 5Making Sense of Standard Error of Measurement . . . . . . . . . . . . . . . . . . . . . . 7Measuring Growth with a Stable Scale . . . . . . . . . . . . . . . . . . . . . . . . . . . . 10How Deep Is the Pool—and Why Does it Matter? . . . . . . . . . . . . . . . . . . . . . . 12Measuring Growth Right . . . . . . . . . . . . . . . . . . . . . . . . . . . . . . . . . . . 14Data That Are Actionable . . . . . . . . . . . . . . . . . . . . . . . . . . . . . . . . . . . 15Assessment Just Right . . . . . . . . . . . . . . . . . . . . . . . . . . . . . . . . . . . . . 182 Partnering to Help All Kids Learn NWEA.org 503.624.1951 121 NW Everett St., Portland, OR 97209
Meeting Students Where They AreWant to help a student grow? Find out where to start.Jean Shields Fleming, Director of Communications, NWEAEducation is often described as the great equalizer.It is a force that can open opportunities for allstudents, regardless of their socioeconomiccircumstances. It can fulfill the American promisethat personal initiative can open new worlds. Yetstudents in today’s schools are hardly uniform,and many have circumstances that put them at adisadvantage. This is especially true for studentsfrom fragile populations. A few statistics paint apicture of the disparity: 22% of all children in the U.S.—some 16 millionkids—live at or below the poverty line.1 Nearly 1.2 million students were homeless in2012, 85% more than were reported prior to therecession that began in 2008.2 The dropout rate for students living in povertyis 4.5 times greater than for students in higherincome brackets.3 In 2013, nearly 60% of all fourth- and eighthgraders were considered “not proficient” inreading and mathematics as measured by theirend-of-year state assessments.4It’s clear that not only are economic gaps betweenchildren real and growing, but that those gapshave a profound impact on academic performance.To deliver on the promise of education asan equalizing force, America’s teachers andadministrators need to know where their studentsare starting their school journeys—to meeteach student wherever he or she is—and havethe tools to measure growth along the way.particular students are starting and how theyare growing toward goals—plus instructionalinformation to move the student forward anddifferentiate instruction so all students learn.Principals need to understand how each classis performing and how the school as a whole istracking toward established benchmarks. Districtadministrators want to see overall trends andmake sure the district is on track to meetaccountability requirements.No single assessment can meet all of thesepurposes—nor should it. Using multiple measuresallows educators to cross-check their data andanswer different educational questions with theappropriate tools. But when it comes to drivingindividual learning, especially for fragile populations,formative and interim assessments have a criticalrole to play in providing the information educatorsneed to close achievement gaps. To understandwhere all students are on their learning path, anadaptive assessment can be an invaluable tool,provided it meets certain criteria: measuring growthregardless of grade and gathering data efficiently.Beyond grade measurementAssessment Results Help Focus EffortsTo understand the disparities among students—tomeasure the gap—the assessment must be able tomeasure students who are performing on, above, orbelow grade level. There is a place for understandinggrade level proficiency (in fact, federal accountabilityframeworks demand it), but to actually teach eachstudent as he or she is, today, the teacher needs toknow where the starting line is.A school system has many kinds of questionsto answer. Teachers need to know where theirAdaptive tests, which adjust with each test question,provide the clearest picture of that starting line.3 Partnering to Help All Kids Learn NWEA.org 503.624.1951 121 NW Everett St., Portland, OR 97209
Many tests adapt only after several items have beenpresented, which does not return the same precisionas a test that adjusts in real time in reaction to everysingle student response. In addition to this trueadaptivity, the test also needs a deep pool of itemsto draw from in order to ensure that students areseeing new questions with appropriate depth ofknowledge each time they take a test. And of course,an assessment must use a stable scale, which is theonly way to accurately show a student’s growth overtime, regardless of grade level performance.Assessment efficiencyEfficient assessment is also crucial to meetingstudents where they are because it returnsactionable data without sacrificing instructionaltime. Efficiency also refers to obtaining qualityand precise data from the assessment instance. Donot sacrifice accurate data with shorter tests, asthey could give incorrect information about whatstudents know and are ready to learn. Adaptivetests—like Measures of Academic Progress (MAP )interim assessments—can pinpoint student growthand instructional needs accurately in a relativelyshort amount of time. MAP assessments takeabout an hour, and give students and educatorsinformation they can immediately use to movelearning forward. Students immediately see how they scored onthe test. Teachers see how the class is performing and can4 use this information to set goals with students,create flexible groups to differentiate instruction,and communicate with parents. Principals get a view of their entire school andcan direct resources to meet specific needs. District administrators can see how each schoolis performing and make adjustments based onreliable information.In an era of tight budgets, and large and variedclasses, this efficiency brings exceptional value.When teachers have high-quality information abouteach student’s actual learning needs, regardlessof grade placement, they can make heroic growthpossible for all kids.Jean Shields Fleming bringsover 25 years of experiencein education to her role atNWEA. She began as a middleschool reading teacher in theBerkeley, California publicschools. There, she developed acurriculum focused on engaging students in careerexplorations to foster a love of reading. She servedas lead instructional designer for an online readingcurriculum, held senior editorial positions withTechnology & Learning magazine and Scholastic.com,and managed global communications for the IntelFoundation’s professional development program.Partnering to Help All Kids Learn NWEA.org 503.624.1951 121 NW Everett St., Portland, OR 97209
The Need for NormsQuality norms help students and teachers achieve moreJohn Wood, Senior Analyst, NWEATeachers do a better job of reaching each studentwhen they don’t teach in a vacuum—and that’swhere norms come in. An educational norm issimply a picture of the typical level of performancefor any given group of students based oncharacteristics such as age range, grade level, orgeographic area. MAP and MAP for Primary Grades(MPG) assessments provide educators with highquality norms that help educators see their students’learning in a wider context.Types of Norms and How EducatorsUse ThemNorms help educators see if a student is growing atan expected pace, regardless of where the studentstarted. NWEA provides both status and growth normsthat allow educators to compare students’ academicperformance to peers. Often, teachers use norms tohelp explain to parents and students what a givenassessment score means, and they often use normsto help make important decisions about placement inboth achievement and Response to Intervention (RTI)programs. Norms may be used by schools for analysisand evaluation of performance and programs. In allcases, having accurate norms drawn from appropriatesample sizes is crucial for educators.Obtaining Quality NormsAs with any statistical model, norms are most usefulwhen they accurately reflect the population theyrepresent and when they allow for closer analysisof various sub-groups. Because of the sample sizes5 and the advanced statistical techniques used todevelop NWEA norms, educators can rely on thevalidity of the data to make important decisionsabout students, schools, and programs. NWEA minesfive terms of test records to create large, nationallyrepresentative samples—over 20,000 studentsper grade. We create our data sets to ensure werepresent United States public school demographicgroups and geographic regions appropriately.Further, NWEA creates norms that reflect variousweeks of instruction during the school year ratherthan simply taking a single snapshot. You can seehow NWEA accounts for weeks of instruction inthe report, which shows means for fall, winter, andspring for each grade. This feature makes NWEAnorms unique.Status NormsNWEA provides achievement, or status, norms foreach grade in math, reading, language usage, andscience. Teachers can view these norms based onany number of instructional weeks through theyear to gain a more precise estimate of a student’scurrent achievement relative to his or her peers.Status norms, presented as a percentile rank, can beuseful for placing students into various programs.For example, MAP and MPG scores have met thestandards of the National Center for Responseto Intervention (NCRTI) to be used as a universalscreener for placement in response to intervention(RTI) programs. NWEA also provides school-levelnorms by subject and grade that parallel thestudent norms.Partnering to Help All Kids Learn NWEA.org 503.624.1951 121 NW Everett St., Portland, OR 97209
Growth NormsNorms and Instructional ContentThe real power of MAP and MPG assessments is inmeasuring growth over time and comparing eachstudent’s measured growth to growth norms. NWEAmakes this easy for educators with the ConditionalGrowth Index (CGI), which allows for comparisonsbased on subject, grade level, instructional weeks,and students’ starting RIT score (the score given bythe MAP test). Using growth norms, teachers canunderstand not only that a student grew, but howmuch that student grew in comparison to otherstudents who had similar starting RIT scores andweeks of instruction. Accounting for instructionalprogress in growth norms is something only NWEAoffers. Growth norms provide teachers the necessarycontext for setting individual student growth targets,a powerful way to help students take ownershipof their own learning. At the school level, growthnorms express the progress of groups of studentsand can be useful for making inferences aboutprograms and instructional approaches.Over the last couple of years, NWEA has leveragedits norms data to help teachers differentiateinstruction by linking our data to content in both openeducational resources like Khan Academy and otherinstructional content that schools have purchased.These links can create individualized learning pathsfor each student by suggesting content that is in thestudent’s zone of proximal development. Equallyimportant, these individualized learning paths canhelp parents and guardians support students at home.6 John Wood is Senior Analystfor Assessment and Educationon the Academic Servicesteam at NWEA. He has workedextensively with the CommonCore State Standards (CCSS) sincethey were issued in draft form,and frequently gives presentations to NWEA partnerson the relationship of MAP to the CCSS. He providessubject matter expertise to many teams at NWEA, aswell as to partners. He is constantly working on newways to connect MAP data to instructional content inorder to help educators create assessment-informedlearning paths for each student.Partnering to Help All Kids Learn NWEA.org 503.624.1951 121 NW Everett St., Portland, OR 97209
Making Sense of StandardError of MeasurementNate Jensen, Ph.D., Research Scientist, NWEAImagine for a moment that you’re starting a newexercise and diet program to lose ten pounds in thenext year. In order to track your weight loss progress,you decide to purchase a new scale. The store,however, only carries two different styles of scales—thefirst is much cheaper, but only guarantees its estimatesof weight within 5 pounds (a range of 10 pounds),whereas the second one, while more expensive,guarantees its estimates to within 0.1 pounds (arange of 0.2 pounds). Which scale would you buy?The answer seems obvious. It wouldn’t be veryhelpful if every time you stepped on the scale youcouldn’t be certain if your weight was actually fivepounds heavier (bummer), five pounds lighter(victory!), or somewhere in between. In order totrack your progress over the weeks and months,it would be important to have a scale that wouldreturn an accurate estimate of what you actuallyweigh every time you step on the scale.This same principle holds with student test scores.If you want to track student progress over time,it’s critical to use an assessment that provides youwith accurate estimates of student achievement—assessments with a high level of precision. When werefer to measures of precision, we are referencingsomething known as the Standard Error ofMeasurement (SEM).Before we define SEM, it’s important to rememberthat all test scores are estimates of a student’s truescore. That is, irrespective of the test being used,all observed scores include some measurementerror, so we can never really know a student’s actualachievement level (his or her true score). But wecan estimate the range in which we think a student’strue score likely falls. And, in general, the smaller therange, the greater the precision of the assessment.7 SEM, put in simple terms, is a measure of precisionof the assessment—the smaller the SEM, the moreprecise the measurement capacity of the instrument.Consequently, smaller standard errors translate tomore sensitive measurements of student progress.On MAP assessments, student RIT scores are alwaysreported with an associated SEM, with the SEM oftenpresented as a range of scores around a student’sobserved RIT score. On some reports, it lookssomething like this:Student Score Range: 185-188-191So what information does this range of scoresprovide? First, the middle number tells us thata RIT score of 188 is the best estimate of thisstudent’s current achievement level. It also tells usthat the SEM associated with this student’s score isapproximately 3 RIT—this is why the range aroundthe student’s RIT score extends from 185 (188 - 3)to 191 (188 3). A SEM of 3 RIT points is consistentwith typical SEMs on the MAP tests (which tend to beapproximately 3 RIT for all students).The observed score and its associated SEM can beused to construct a “confidence interval” to anydesired degree of certainty. For example, a rangeof 1 SEM around the observed score (which, inthe case above, was a range from 185 to 191) isthe range within which there is a 68% chance thata student’s true score lies, with 188 representingthe most likely estimate of this student’s score.Intuitively, if we specified a larger range aroundthe observed score—for example, 2 SEM, orapproximately 6 RIT—we would be much moreconfident that the range encompassed the student’strue score, as this range corresponds to a 95%confidence interval.Partnering to Help All Kids Learn NWEA.org 503.624.1951 121 NW Everett St., Portland, OR 97209
So, to this point we’ve learned that smaller SEMsare related to greater precision in the estimationof student achievement, and, conversely, that thelarger the SEM, the less sensitive is our ability todetect changes in student achievement. But why isthis fact important to educators?An example of how SEMs increase in magnitude forstudents above or below grade level is shown in thefollowing figure, with the size of the SEMs on anolder version of the Florida 5th grade reading testplotted on the vertical axis relative to student scalescores on the horizontal axis.5 What is apparent fromthis figure is that there is a tremendous amountof imprecision associated with the test scores forlow- and high-achieving students. In this example,the SEMs for students on or near grade level (scalescores of approximately 300) are between 10 to15 points, but increase significantly for studentsthe further away they get from grade level. Thispattern is fairly common on fixed-form assessments,with the end result being that it is very difficultto measure changes in performance for thosestudents at the low and high end of the achievementdistribution. Put simply, this high amount ofimprecision will limit the ability of educatorsto say with any certainty what the achievementlevel for these students actually is and how theirperformance has changed over time.If we want to measure the improvement of studentsover time, it’s important that the assessment usedbe designed with this intent in mind. And in orderto do this, the assessment must measure all kidswith similar precision, whether they are on, above,or below grade level. Recall, a larger SEM means lessprecision and less capacity to accurately measurechange over time, so if SEMs are larger for high- andlow-performing students, this means those scoresare going to be far less informative, especially whencompared to those students who are on grade level.Educators should consider the magnitude of SEMsfor students across the achievement distributionto ensure that the information they are using tomake educational decisions is highly accurate for allstudents, regardless of their achievement level.Grade 5 Reading SEMStandard Error of Measurement100Figure 1: Standard Errors ofMeasurement by Student AchievementLevel, 5th Grade Reading, FloridaComprehensive Assessment Test 500Scale Score8 Partnering to Help All Kids Learn NWEA.org 503.624.1951 121 NW Everett St., Portland, OR 97209
Of course, the standard error of measurement isn’tthe only factor that impacts the accuracy of the test.Accuracy is also impacted by the quality of testingconditions and the energy and motivation thatstudents bring to a test. In fact, an unexpectedlylow test score is more likely to be caused bypoor conditions or low student motivation thanto be explained by a problem with the testinginstrument. To ensure an accurate estimate ofstudent achievement, it’s important to use asound assessment, administer assessments underconditions conducive to high test performance, andhave students ready and motivated to perform.In short, just as you would want an accurate scale ifyou were tracking your progress in an exercise anddiet program, it is critical that the assessment usedin your school to track student progress providesachievement estimates for all students that areas precise as possible. And, as we have discussedin this paper, the key metric on which to focus to9 determine if that is the case is the standard error ofmeasurement. The SEM of a test score isn’t alwaysthe easiest statistical term to understand. But, if youremember that smaller SEMs lead to more accurateestimates of student achievement and growth, youwill be better able to interpret and evaluate theperformance of your students.Prior to joining NWEA threeyears ago, Nate Jensen put hisskills to use as a teacher and asa senior research associate atthe office for education policyat the University of Arkansas.Over a decade of experiencein the education field has given him a profoundappreciation of the importance of data in theclassroom. His passion lies in helping teachers andschool leaders understand how to use metrics todeeply understand what each student needs in orderto grow.Partnering to Help All Kids Learn NWEA.org 503.624.1951 121 NW Everett St., Portland, OR 97209
Measuring Growth with a Stable ScaleA strong, stable scale is key to accurately measuring student growthNicole A. Zdeb, Senior Manager, Academic Services, NWEAAt NWEA, we are passionate about growth and whatit means in the educational journeys of the studentswe serve. Growth means that learning is happening.Students are acquiring the concepts and skills theyneed to flourish in the world and be the authors oftheir own stories. Measuring that growth is crucial,and the stability of a measurement scale over time isnecessary to measure growth accurately. But what isa scale and what does stability mean?Measuring Latent TraitsScale is one of those words that befuddles learnersof English because there are various and unrelatedmeanings, from the covering on certain animals, to acause of blindness, to an instrument with graduateddegrees. When we talk about scales in educationalmeasurement, we’re talking about something akinto the latter definition: a construct that indicates thedegree of student ability in a certain area, such asmathematical reasoning. We call this ability a latenttrait because we can’t see the amount of a student’smathematical reasoning ability directly, like wecan see a student’s hair color or the shoes she iswearing. Even though we can’t physically interactwith it, we know mathematical reasoning is a realthing. It is similar to a psychological state such ashappiness—it exists in the interiority of a person.Quantifying, or measuring, latent traits is a subtleendeavor to which we bring to bear the power ofstatistical modeling.To measure a latent trait, we must first elicit it. Weelicit evidence of a latent trait through the use ofinstruments such as test items, performance tasks,10 and writing samples. The evidence is a proxy, orrepresentative, of the trait itself. We infer that a personis happy by certain indicators such as body language,laughter, or smiling. Likewise, we infer the degree ofa latent trait such as mathematical reasoning by theevidence we get from eliciting that trait.Stable, Equal Interval ScaleOnce we elicit evidence of a latent trait, we measurethat evidence by using a scale. The scale used byMAP is an equal interval measurement called theRIT scale. An equal interval scale provides a specifickind of information about order, namely that thereis the same distance between points on the scale,or the same amount of underlying quality. Anotherexample of an equal interval scale is a thermometer.The value of an equal interval scale is that it isconsistent and objective; such qualities help make ascale stable over time.Scale stability means that scales maintain theirmeasurement characteristics, allowing forcomparisons of assessment scores among groups ofstudents, growth estimates, and longitudinal studies.For example, a RIT score of 215 in 1975 would beequivalent to a RIT of 215 in 1995. Maintainingthis stability of scale—so that our scale retains itsmeasurement properties in exactly the same way yearafter year—is a crucial part of what we do at NWEA.Guarding Against Scale DriftNot all educational measurement scales areinherently stable. Many scales can and do drift overtime, meaning that the underlying quantity of what isPartnering to Help All Kids Learn NWEA.org 503.624.1951 121 NW Everett St., Portland, OR 97209
being measured shifts. Item calibrations can becomemore difficult or less difficult as time goes on. This isdisastrous for measuring growth or making any sortof longitudinal comparisons. There are a number ofreasons a scale might drift over time: Curricular changes (including pedagogicalapproaches) Changes in standards or what is valued in acontent area Changes in testing populations over time Changes in the stakes of a test or assessment,its social context, or the meanings andconsequences attached to it Changes in the intended purposes ofthe assessment11 Guarding our scale’s integrity in the face of suchchanges allows NWEA to maintain a scale withremarkable stability over time. This stability givesus confidence in the educational decisions that aremade as a result of the data gleaned from our MAPassessments. We are aware of the importance ofmaintaining scale stability, so we make it a priorityto monitor our scales for drift. The scale connects itall—items to scores to students. We ensure our dataare the gold standard in measuring growth becausewe know that every student can grow. Reporting thatgrowth accurately makes a difference in the lives ofstudents across the country and world.Making a difference in the lives ofchildren, teachers, and familiesis what has driven Nicole Zdeb’swork at NWEA over the pastdecade. As a specialist in contentand curriculum, she’s broughther prodigious experience as aneducator to bear on the Academic Services departmentof NWEA. Outside the office, Nicole devotes her timeto supporting student literacy, and has had poemspublished in numerous literary journals.Partnering to Help All Kids Learn NWEA.org 503.624.1951 121 NW Everett St., Portland, OR 97209
How Deep Is the Pool—andWhy Does it Matter?How item pool depth affects your assessment’s accuracyApril Roethel, Senior Analyst, Assessment and Education, NWEATo dive safely into a swimming pool, the watermust be deep enough to extend past your headand your feet. Similarly, to ensure the validity andeffectiveness of computer adaptive tests (CATs), theitem pool must be deep enough to stretch above andbelow a student’s entry point.An essential part of a CAT is a well-constructed itempool. One crucial requirement of a well-designeditem pool is that it includes enough items to enablethe building of numerous individualized tests thatalign to students’ varying ability levels—this is whatwe mean by the depth of the pool. The ideal itempool should also include enough breadth to coverthe scope of the content domain.Why is item pool depth so important incomputer adaptive assessments?Unlike paper-and-pencil tests that are fixedin content, CATs adapt to individual studentperformance. They get harder or easier dependingon how a student is performing on the test, whichrequires a deep item pool from which many differenttests can be drawn.A student’s grade level is not necessarily his or herinstructional readiness point; this is why a CAT mustadapt to measure on-, above-, and below-gradeabilities. An assessment that informs educatorsabout each student’s instructional readiness drawson content that spans across grades. A deep itempool can provide this because it will be stocked withitems that correspond to many different grade levels.12 How many items are enough toassess a skill?A common question that comes up whenevaluating an assessment tool is, “How manyitems should it include?”The appropriate size of the item pool depends onfour main factors.Precision is the first factor to consider, as it relates tothe “estimate of student achievement that is desired.”6The more precision you desire, the larger your itempool needs to be. If you are aiming to get just a roughestimate, you can use a smaller item pool. Range is another significant factor. How broador narrow is the range of achievement to bemeasured? A larger item pool will be requiredfor assessment that is very broad, since it willinclude items with a large range of difficulty.For example, if an assessment is being usedto measure students’ performance at multipledepth of knowledge (DOK) levels, it will requirea greater range of items than an assessmentconcerned with only one DOK level. Stakes are a third factor that will determine theitem pool size requirement. If a CAT is very highstakes, students might be more likely to gamethe test. Large item pools improve the chancethat examinees receive a different set of testitems for every test administration, making itimpossible to cheat the system. Number of times a CAT is administered is afourth factor of importance. If an assessmentis administered to the same students multiplePartnering to Help All Kids Learn NWEA.org 503.624.1951 121 NW Everett St., Portland, OR 97209
times a year, for instance, the item pool must belarge enough to ensure that a student doesn’tsee any item more than once.The goal is to have a sufficient number of items ineach desired content area to assemble an individualtest with the balanced content coverage required bythe test.7The importance of field testingand calibrationA deep pool of items isn’t very valuable if the i
the MAP test). Using growth norms, teachers can understand not only that a student grew, but how much that student grew in comparison to other students who had similar starting RIT scores and weeks of instruction. Accounting for instructional progress in growth norms is something only NWEA offers. Growth norms provide teachers the necessary
