Transcription
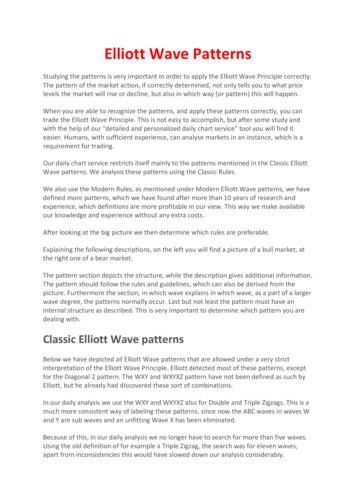
METHODOLOGY FOR ELLIOTT WAVES PATTERN RECOGNITIONMartin KotyrbaEva VolnaMichal JanosekHashim HabiballaDavid BrazinaDepartment of Informatics and ComputersUniversity of Ostrava70103, Ostrava, Czech RepublicE-mail: martin.kotyrba@osu.czE-mail: eva.volna@osu.czE-mail: michal.janosek@osu.czE-mail: hashim.habiballa@osu.czE-mail: david.brazina@osu.czKEYWORDSanalyses continue to revise their earnings estimateslower; the economy probably does not look strong.Sentiment surveys are decidedly bearish, putoptions are in vogue, and implied volatility in theoptions market is high. Volume might increase abit as prices rise, but not by enough to alert manytechnical analysts.Elliott waves, Fibonacci analysis, neural networks,pattern recognition, prediction.ABSTRACTThe article is focused on an analysis and patternrecognition in time series, which are fractal in nature.The proposal methodology is based on aninterdisciplinary approach that combines artificialneural networks, analytic programming, Elliott wavetheory and knowledge modelling. The heart of themethodology are a methods, which is able to recognizeElliott waves structures including their deformation inthe charts and helps to more efficient prediction of itstrend. The functionality of the proposed methodologywas validated in experimental simulations, for whoseimplementation was designed and created an applicationenvironment. Experimental simulations have shown thatthe method is usable to a wider class of problems thanthe theory itself allows only Elliott waves.This paperintroduces a methodology that allows analysis of Elliotwave’s patterns in time series for the purpose of a trendprediction. Wave 2: Wave two corrects wave one, but cannever extend beyond the starting point of waveone. Typically, the news is still bad. As pricesretest the prior low, bearish sentiment quicklybuilds, and "the crowd" haughtily reminds all thatthe bear market is still deeply ensconced. Still,some positive signs appear for those who arelooking: volume should be lower during wave twothan during wave one, prices usually do not retracemore than 61.8% (see Fibonacci relationship) ofthe wave one gains, and prices should fall in athree wave pattern. Wave 3: Wave three is usually the largest andmost powerful wave in a trend (although someresearch suggests that in commodity markets,wave five is the largest). The news is now positiveand fundamental analysts start to raise earningsestimates. Prices rise quickly, corrections areshort-lived and shallow. Anyone looking to "get inon a pullback" will likely miss the boat. As wavethree starts, the news is probably still bearish, andmost market players remain negative; but by wavethree's midpoint, "the crowd" will often join thenew bullish trend. Wave three often extends waveone by a ratio of 1.618:1. Wave 4: Wave four is typically clearly corrective.Prices may meander sideways for an extendedperiod, and wave four typically retraces less than38.2% of wave three (see Fibonacci relationships).Volume is well below than that of wave three. Thisis a good place to buy a pull back if youINTRODUCTION - ELLIOTT WAVEPERSONALITY AND CHARACTERISTICSElliott wave analysts hold that each individual wave hasits own signature or characteristic, which typicallyreflects the psychology of the moment (Poser2003).Understanding those personalities is a key to theapplication of the Wave Principle; they are defined asfollows (Frost and Prechter 2001):Five wave pattern - dominant trend (see Fig. 1) Wave 1: Wave one is rarely obvious at itsinception. When the first wave of a new bullmarket begins, the fundamental news is almostuniversally negative. The previous trend isconsidered still strongly in force. FundamentalProceedings 27th European Conference on Modelling andSimulation ECMS Webjørn Rekdalsbakken, Robin T. Bye,Houxiang Zhang (Editors)ISBN: 978-0-9564944-6-7 / ISBN: 978-0-9564944-7-4 (CD)
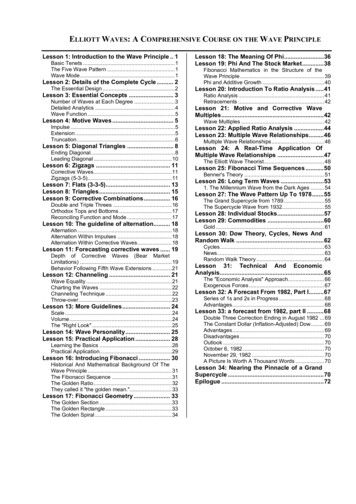
understand the potential ahead for wave 5. Still,fourth waves are often frustrating because of theirlack of progress in the larger trend. Wave 5: Wave five is the final leg in the directionof the dominant trend. The news is almostuniversally positive and everyone is bullish.Unfortunately, this is when many averageinvestors finally buy in, right before the top.Volume is often lower in wave five than in wavethree, and many momentum indicators start toshow divergences (prices reach a new high but theindicators do not reach a new peak). At the end ofa major bull market, bears may very well beridiculed (recall how forecasts for a top in thestock market during 2000 were received).Wave C: Prices move impulsively lower in fivewaves. Volume picks up, and by the third leg ofwave C, almost everyone realizes that a bearmarket is firmly entrenched. Wave C is typically atleast as large as wave A and often extends to 1.618times wave A or beyond (Frost and Prechter 2001).FIBONACCI ANALYSIS AND ELLIOTT WAVETHEORY Fibonacci numbers provide the mathematical foundationfor the Elliott Wave Theory. While the Fibonacci ratioshave been adapted to various technical indicators, theirutmost use in technical analysis remains themeasurement of correction waves (Frost and Prechter2001).The Fibonacci number sequence 1, 1, 2, 3, 5, 8, 13, 21,34, 55, 89,.is made by simply starting at 1 and addingthe previous number to arrive at the new number:0 1 1, 1 1 2, 2 1 3, 3 2 5, 5 3 8, 8 5 13,13 8 21, 21 13 34, 34 21 55, 55 34 89, This series has very numerous interesting properties:Figure 1: The basic pattern of Elliott waveThree wave pattern - corrective trend (see Fig. 1) Wave A: Corrections are typically harder toidentify than impulse moves. In wave A of a bearmarket, the fundamental news is usually stillpositive. Most analysts see the drop as a correctionin a still-active bull market. Some technicalindicators that accompany wave A includeincreased volume, rising implied volatility in theoptions markets and possibly a turn higher in openinterest in related futures markets. Wave B: Prices reverse higher, which many see asa resumption of the now long-gone bull market.Those familiar with classical technical analysismay see the peak as the right shoulder of a headand shoulders reversal pattern. The volume duringwave B should be lower than in wave A. By thispoint, fundamentals are probably no longerimproving, but they most likely have not yetturned negative. The ratio of any number to the next number in theseries approaches 0.618 or 61.8% (the golden ratio)after the first 4 numbers. For example:34/55 0.618 The ratio of any number to the number that is foundtwo places to the right approaches 0.382 or 38.2%.For example: 34/89 0.382 The ratio of any number to the number that is foundthree places to the right approaches 0.236 or 23.6%.For example: 21/89 0.236These relationships between every number in the seriesare the foundation of the common ratios used todetermine price retracements and price extensions duringa trend (see Fig. 2).Figure 2: Fibonacci price retracements and priceextensions icalanalysis/fibonacci-elliot-wave.html)
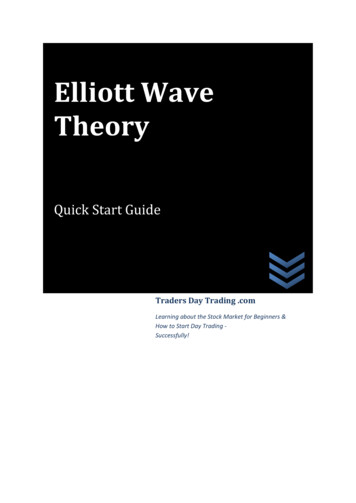
A retracement is a move in price that "retraces" a portionof the previous move. Usually a stock will retrace at oneof 3 common Fibonacci levels- 38.2%, 50%, and 61.8%.Fibonacci price retracements are determined from a priorlow-to high swing to identify possible support levels asthe market pulls back from a high.Retracements are alsorun from a prior high-to-low swing using the same ratios,looking for possible resistance levels as the marketbounces from a low (Frost and Prechter 2001).Fibonacci price extensions are used by traders todetermine areas where they will wish to take profits inthe next leg of an up-or downtrend. Percentage extensionlevels are plotted as horizontal lines above/below theprevious trend move. The most popular extension levelsare 61.8%, 100.0%, 138.2% and 161.8%.In reality it is not always so easy to spot the correctElliott wave pattern, nor do prices always behave exactlyaccording to this pattern. Therefore it is advisable for atrader not to rely solely on Fibonacci ratios, but rather touse them in conjunction with other technical tools.ELLIOT WAVES DETECTIONElliott waves are characterized by wide and numerousdescriptions of their distinctive phases, thus they aredifficult to detect in time series.Detection according to characteristic figuresThe third eventuality is to restrict detection to somesignificant figures, which are significant with respect toparts of patterns according to the Elliott theory.Therefore, the method does not restrict to detectingmono-waves. Found figures can be processed further,while found figures generate additional parameters forfurther processing. A disadvantage is that we are able tofind a lot of characteristic patters in input data, which istime consuming. Here, we have to choose patternscorrectly for detection and to have sufficient amount oftest data to disposal. However, this approach is veryeffective and, therefore, it was chosen as a detectionmethod in the article.DETECTION SYSTEM FOR ELLIOT WAVESPATTERN RECOGNITION BASED ON NEURALNETWORKSThe core of detection system is the multi-classifier,which consists of the for the pattern recognition ofstructures with fractal dynamics. The multi-classifier(Fig. 3) is based on neural networks which are adaptedby backpropagation (Volna, Kotyrba and Jarusek 2013). The first neural network is designed to recognizeselected Elliott wave’s patterns. Emphasis isplaced on the ability of a network to evaluate thefound patterns with a degree of consensus ofsimilarity with the defined pattern from trainingset. It is also necessary to network guaranteeinformation about a quality of the found pattern. The second neural network evaluated prediction oftrend component on the basis of the recognizedpattern. The whole prediction is based on the IFTHEN rules from which the training set iscomposed for the second neural network. Inessence, the neural network represents a rule-basedof knowledge system that is able to decide whethera time series respects corrective or impulsedirection.Detection according to the rulesThe first eventuality is the classification which graduallyruns from smallest to largest parts of Elliott waves. Thismethod is described in (Dostál and Sojka 2008). Theprocess starts with finding a scale and separate monowaves marking. There are completed patterns accordingto particular ratios. These patterns are a base for otherpatterns. This approach is often used for manualevaluation with their subsequent processing. The methoduses seven rules, which classify waves into groupsdepending on a ratio of heights of neighbouring waves.The rules use Fibonacci ratios with a deviation of 5%.The only possibility of searching is to check each monowave through the conditions and some experience of aresearcher is expected as well. Here, the aim is not todeal with the evaluated segment, but to respect singlefigures as complex units. This method is accurate, but itis computationally very time consuming and it is limitedto the detection of mono-waves according to thepredetermined number of specific rules.Detection units and their progressive separationThe second eventuality is classification of big parts ofElliott waves and their subsequent decomposition intosmaller parts. Patterns of impulsive character can bedetected clearly thanks to more accurate conditions thanpatterns of correction phase. Therefore it is possible todetect patterns proposed in input data. Here, the aim is tofind a figure and then to classify its smaller units. Adisadvantage is that impulse phases are only detecteddirectly, while correction phases must be derived.Another disadvantage during detection of large parts isthat their internal structure is unknown as long as otherpulses are not found in these parts.Figure 3: The multi-classifier proposal for the purposeof pattern recognition with consecutive prediction
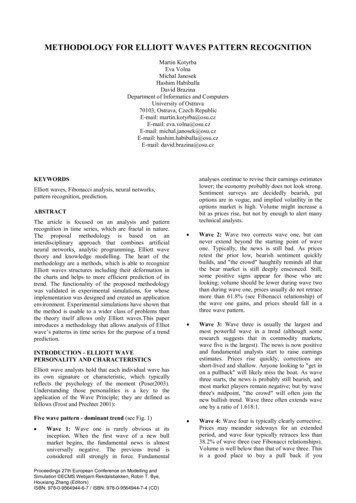
Preparation of the training set of the first neuralnetwork using Fibonacci sequenceAll patterns of training set were defined in order torepresent the characteristics of Elliott wave to beidentified in dependently of the time scale or the natureof the monitored data. When creating patterns, we usedthe properties of the Fibonacci sequence, which we usedas a time filter so we could estimate when the impulseor correction would terminate. Time incorrections:A wave X units of timeB wave 1.681 X or B 0.618 XC wave 0.618 A (B) orC 1.618 A (B) or C A BIn the impulsive waves were taken into considerationwaves where the first, third and fifth wave extended.These are patterns P6, P8, P10 in Fig. 4.5340,61811,041,0111,01,618321,0553242Figure 4: Extended phase of the impulse characterFor example, when wave 3 is extended, waves 1 and 5tend towards equality or a 0.618 relationship, asillustrated in Fig. 4. Actually, all three impulsive wavestend to be related by Fibonacci mathematics, whether byequality, 1.618 or 2.618 (whose inverses are 0.618 and0.382). These impulse wave relationships usually occurin percentage terms. Wave 5's length is sometimesrelated by the Fibonacci ratio to the length of wave 1through wave 3, as illustrated in Fig. 4. In those rarecases when wave 1 is extended, it is wave 2 that oftensubdivides the entire impulse wave into the wave, asshown in Fig. 4. In such cases, the latter portion is 0.382of the total distance when wave 5 is not extended. Thisguideline explains why a retracement following the fifthwave often has double resistance at the same level: theend of the preceding fourth wave and the 0.382retracement point (Frost and Prechter 2001).We used the backpropagation method for the adaptationwith the following parameters: first 5000 iterationshavethe learning rate value 0.5, and for the next 2000iterations the learning rate value is 0.1, momentum is 0.The conducted experimental studies also showed that ineach cycle of adaptation is to present an adequatenetwork of training patterns mix
Elliott wave analysts hold that each individual wave has its own signature or characteristic, which typically reflects the psychology of the moment (Poser2003). Understanding those personalities is a key to the application of the Wave Principle; they are defined as follows (Frost and Prechter 2001) : Five wave pattern - dominant trend (see Fig. 1) Wave 1: Wave one is rarely obvious at its .