Transcription
Chapter 1Creating Value inFinancial ServicesEdward L. MelnickPraveen R. NayyarMichael L. PinedoSridhar SeshadriNew York University1.1 IntroductionFinancial services firms everywhere have undergone major changes over thelast several decades. These firms include retail commercial banks, investmentbanks, insurance companies, mutual fund companies, securities brokers, andcredit card companies. The decade of the nineties has witnessed a significantnumber of mergers among these firms worldwide. Some mergers were intendedto achieve economies of scale from greater size and geographic diversity, e.g.,the merger of Chase and Chemical. Some mergers were intended to establish abridge between different financial services in the hope of creating synergies e.g.,the merger of Travelers Group with Citicorp.Simultaneously with consolidation in the financial services sector, many e backed securities, and index enewtocashmanagementaccounts,The decade has also yincomputerstheInternet,andhavespawned new firms such as the E*Trade Group, Inc. and TeleBanc ngbusinessatestablishedcompanies, e.g., Charles Schwab and Merrill Lynch. The goal of all these newdevelopments in strategy, services, processes, and technologies was to createvalue.There is little data comparing the impact of these innovations on value creationby the financial services sector with value creation by other industries. What
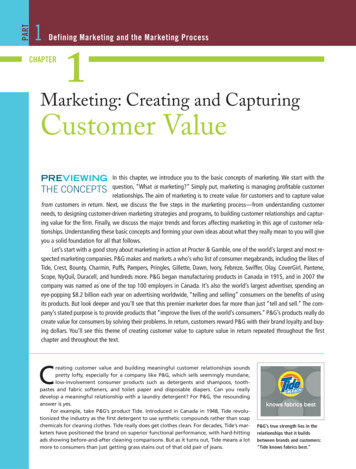
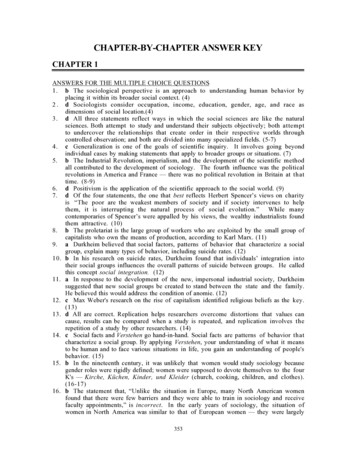
CREATING VALUE IN FINANCIAL SERVICES2little evidence there is suggests that the financial services sector has not createdas much value as it should have. At the outset, it is important to recognize thatvalue creation varies across industries as well as within industries. And, valuecreation varies across time. To put value creation by financial services firms inperspective, consider Figure 1 below. One measure of value created by a firm eenthemarketvalue of a firm s equity and debt and its economic book value, which is theamount that is invested in the firm. To calibrate MVA, it is useful to compare itwith the Capital Employed by a firm. A ratio above 1 indicates that a firm hascreated value. A ratio below 1 indicates that it has destroyed value.Using Market Value Added divided by Capital Employed as a measure of valuecreatedbyfirms,Figure1 shows thatsomefinancialservicesfirms(inthisinstance, banks) have performed rather poorly over the period 1992 to 1995 gtheseyearsbanks MVA/CE hovered in the 50% range. During 1992-1995, banks were unable toeven recover the capital invested in them! Only transportation destroyed morevalue; while manufacturing struggled to stay above water; hotels were pectacularnosedive.Incontrast, firms in industries as diverse as healthcare and consumer productscreated large amounts of value during the same period.MVA/Capital Employed %)Figure 1. Value Creation and DestructionAcross ons. ProductsHotelsSources: Smith Barney, Stern Stewart,Business Week
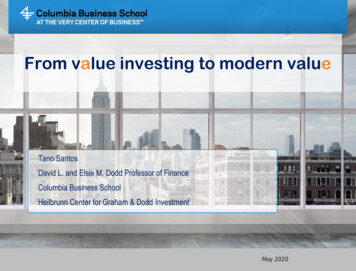
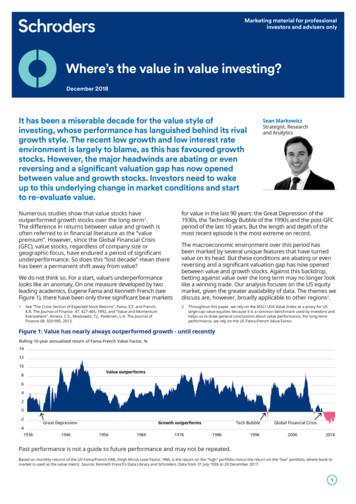
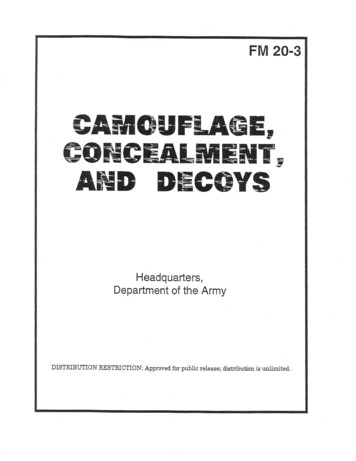
CREATING VALUE IN FINANCIAL SERVICES3One implication of these data is that financial services firms may benefit fromstudying the value-creating practices employed by firms in industries as diverseas healthcare and consumer products. These two industries showcase two sslypursuedcostcontrolwhile consumer products firms have single-mindedly focused on customers esignedanddelivered well-suited products efficiently. Could financial services firms emulatesuch practices?In particular, could a bank intent on improving itself learn anything from otherbanks? Figure 1 suggests that this is a rhetorical question and one not fthestory.ConsiderFigure 2 that shows variations in value creation within four industries. Now wefind that there is at least one bank that creates significantly more value thanother banks. How? What does this bank do that creates so much value? Figure2 also shows that there is at least one retail firm and one telecommunicationsfirm that create more value than even the best-performing bank. How? Whatdo this retail firm and this telecommunications firm do that creates so muchvalue?More recent data suggests that financial services firms, including banks, haveimproved their record of value creation. To see this and also to get a longerterm perspective on value creation across industries, consider the data in Table1 below excerpted from the Stern Stewart & Company s list of the top 1000firms based on market value added as of December 31, 1998. Table 1 lists indescendingorder the 5-year averagereturn oncapitalFigure 2. Value Creation and DestructiondividedFrequency50020406080100Banks MVA/Capital120140theWithin Industries10-20by1601805-year
CREATING VALUE IN FINANCIAL SERVICES4Figure 2. Value Creation and DestructionWithin 0034055657585Retail ion 10Telecom MVA/CapitalBusiness WeekSources: Smith Barney, Stern s.forAbanks,numberretailers,transportationgreater than1indicatesfirms,thatanda firmiscreating value. Most of the financial services firms listed in Table 1 created
CREATING VALUE IN FINANCIAL SERVICES5value. Moreover, the best to worst ratio for financial services firms (in this unications,andtransportation firms. It should be noted that this result might be an artifact ofthis list because financial services is a more fragmented sector than the othersectors.Thus, istalthough most of the firms in the other industries are included. Despite thislimitation, the fact remains that the worst financial services firm listed in Table1 has a long way to go before catching up with the value creation effort of thebest firm on the list. A similar conclusion is reached by perusing the creditratings of insurance firms.1.2 How Does A Financial Services Firm Create Value?For long it was thought that functional excellence created value. Thus, a bankthat excelled at, for example, origination, distribution, servicing, bundling, intermediating, or making markets was considered likely to succeed in creating valuefor its customers and ultimately in creating shareholder value. But, customersdid not really care about functional excellence. Further, functional dwiththeviewthatuniqueresources controlled by firms helped create value for customers. Thus, a rsdidamountscustomersnotreallyofwascareabout size or information or reach or risk exposure. And, banks with narrowspheres of operation were better able to serve their local markets than theirlarger counterparts.More recently, strategists share the view that a focus on customers in terms edsrapidlyandefficiently, and ultimately establishing enduring relationships between serviceproviders and customers, creates value that is sustainable and often difficult allyspecializedhierarchies, but rather by designing and managing customer-focused processes.For example, Merrill Lynch long held out against Internet trading. Instead, ndfunctionalexcellence embodied in its large brokerage sales force. Its customers, errillLynchgaveinandannounced that it, too, will join the Internet fray to be able to better meet itscustomers rterearnings to greater customer focus that enabled it to complete 67 fees-basedinvestment banking transactions made possible by the combined efforts of theformer Travelers Group and Citicorp units acting in unison to meet customerNew York Timesneeds (, July 20, 1999).
CREATING VALUE IN FINANCIAL SERVICES6Table 1: Index of Value Creation and Destruction, 1992-1997Financial Services FirmIndexRetail FirmIndexMBNA Corporation2.76Dollar General2.46Merrill Lynch & Co., Inc.2.26Autozone1.94Star Banc Corporation2.18Home Depot1.55Allstate Corporation2.17Wal-Mart Stores1.28American Express Company1.85May Department Store1.28Morgan Stanley, Dean Witter1.83Costco Companies1.151.12National Commerce Bancorporation1.82LimitedFirst Tennessee National Corp.1.64Kohl's1.07Comerica Incorporated1.63Consolidated Stores1.05Norwest Corporation1.58Dillard's1.05SunTrust Banks, Inc.1.56Toys "R" Us1.01Synovus Financial Corp.1.54Dayton Hudson1.00Summit Bancorp1.53Sears Roebuck0.89Citicorp1.46Staples0.87Northern Trust Corporation1.46Nordstrom0.87BB&T Corporation1.42Kmart0.85BankBoston Corporation1.38Federated Department Stores0.77State Street Corporation1.38J.C. Penney0.76Firstar Corporation1.38Pep Boys0.70Union Planters Corporation1.37Loews Corporation0.43First Commerce Corporation1.37Old Kent Financial Corporation1.36Fifth Third Bancorp1.35First American Corporation1.34Mellon Bank Corporation1.33SouthTrust Corporation1.33AmSouth Bancorporation1.31Fleet Financial Group, Inc.1.30Huntington Bancshares, Inc.1.30Bank of New York Company, Inc.1.29First Union Corporation1.28First of America Bank Corporation1.26Chase Manhattan Corporation (The)1.25Associates First Capital Corporation1.25National City Corporation1.25J.P. Morgan & Company, Inc.1.23Bankers Trust New York Corp.1.21NationsBank Corporation1.20U.S. Bancorp1.19Regions Financial Corporation1.18Wachovia Corporation1.16Mercantile Bancorporation, Inc.1.13Republic New York Corporation1.13BankAmerica Corporation1.09First Chicago NBD Corporation1.05CoreStates Financial Corp1.01KeyCorp0.99Hibernia Corporation0.99PNC Bank Corp.0.98Bank One Corporation0.96Wells Fargo & Company0.91
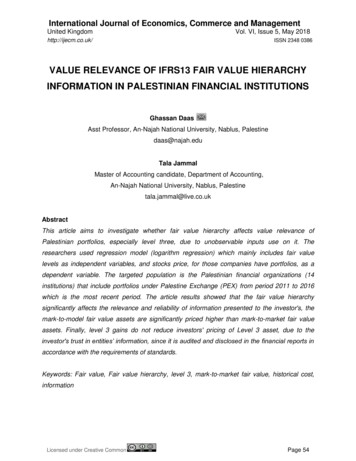
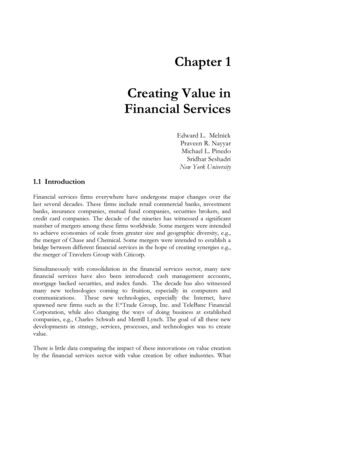
CREATING VALUE IN FINANCIAL SERVICES7Table 1: Index of Value Creation and Destruction, 1992-1997 (contd)Transportation FirmIndexTelecommunications FirmIndexApollo Group2.56TellabsContinental Airlines2.55SBC Communications3.191.73Northwest Airlines1.59Bell Atlantic1.39Airborne Express1.48Ameritech1.19UAL Corp.1.36GTE1.19Delta Air Lines1.32Alltel Communications1.15CNF 97Trinity1.22US West0.89Budget Group1.17Sprint0.82AMR Corporation1.13AirTouch Communications0.79Rollins Truck Leasing1.10AT&T0.57Ryder System1.07MCI0.42Southwest Airlines0.98Nextel Communications-1.11Qwest CommunicationsN/ABurlington Northern Sante Fe0.86FDX Corp.0.83CSX0.81Brunswick0.80Atlas Air0.80Norfolk Southern0.72Alexander & Baldwin0.72GATX0.63Overseas Shipping0.54Union Pacific0.53AMERCO0.49Newport News Shipbuilding-0.42The index is defined as the 5-year average return on capital divided by the 5-year average cost of capital.Source: Stern Stewart & Co.Much of the recent wave of improvement in performance of financial servicesfirms in terms of creating value could be the result of the adoption of, so called, best practices . Together with the ever-present comparisons made acrossindustries, across firms within industries, and across time, the adoption of bestpractices is often considered as a means to improve value creation. Lest thequest for identifying and adopting best practice go too far, consider Figure 3below. Figure 3 is a speculative figure. On its horizontal axis is the extent towhich an organization has adopted best practices. For example, this could bemeasured by the number of best practices adopted, such as Total QualityManagement, Just-in-Time materials management, straight-through processing,and Benchmarking. Or, it could be an index created to measure the coverage ofbest practices within an organization. On its vertical axis is a measure of valuecreated by the adoption of best practices. It would be very useful to know therelationship between the extent of adoption of best practices and value
CREATING VALUE IN FINANCIAL SERVICES8creation. Is this relationship linear? Does it have a threshold? Is it asymptotic tosome limit? Does it exhibit increasing or decreasing returns? Unfortunately, tothe best of our knowledge, this relationship of best practices to value created isunknown. Is it unknowable? We think not.Figure 3. Do Best Practices Always Create Value?Value Created0Adoption of Best Practices Extent NumberAs an example, consider the data in Table 2. It shows the change in stockmarket value of firms that announced changes in the level and kind ofcustomer service they provide. (For more details see Nayyar, 1995.) One wouldexpect that increased levels of customer service would be positively valuedwhile decreased levels would be negatively valued. In many cases this generalexpectation is true as indicated by the percent positive and percent negativecolumns respectively. Of all customer service increases 67% were positivelyvalued while of all decreases 82% were negatively valued. Conversely, 33percent of increases were negatively valued and 18 percent of decreases were positivelyvalued (there were no zero-valued changes). Why did the stock market act inthis seemingly perverse manner?Nayyar (1995) speculated that there might exist optimum levels of customerservice beyond which customers and the stock market do not reward firms. Ineffect, adopting best practices beyond a certain point destroys value. Thesefindings also suggest many other possibilities including decreasing returns andthreshold
American Express Company 1.85 May Department Store 1.28 Morgan Stanley, Dean Witter 1.83 Costco Companies 1.15 National Commerce Bancorporation 1.82 Limited 1.12 First Tennessee National Corp. 1.64 Kohl's 1.07 Comerica Incorporated 1.63 Consolidated Stores 1.05 Norwest Corporation 1.58 Dillard's 1.05 SunTrust Banks, Inc. 1.56 Toys "R" Us 1.01