Transcription
NASA JtJ 0-8340 C.LNASA TECHNICAL N O T EKPERFORMANCE A N D BOUNDARY-LAYEREVALUATION OF A SONIC INLETLewis Research CenterCleueland, Ohio 44135NATIONAL AERONAUTICS AND SPACE ADMINISTRATION?IWASHINGTON, D. C.,.NOVEMBER 1976
TECH LIBRARY KAFB, NM. 1. Report No.NASA TN D-8340--4. Title and SubtitleI 01340773. Recipient's Catalog No.2. Government Accession No.5. Report DatePERFORMANCE AND BOUNDARY-LAYEREVALUATION OF A SONIC INLETNovember 19zIi6. Performing Organization Code8. Performing Organization Report No.7. Author(s1E-8579J a m e s F. Schmidt and R o b e r t S. Ruggeri10. Work Unit No.9. Performing Organization Name and Address505-04- L e w i s R e s e a r c h CenterNational Aeronautics and Space AdministrationCleveland, Ohio 4413511. Contract or Grant No.13. Type o f Report and Period Covered2. Sponsoring Agency Name and AddressTechnical NoteNational Aeronautics and Space AdministrationWashington, D. C. 2054614. Sponsoring Agency Code5. Supplementary 'Notes6. AbstractTests w e r e conducted to d e t e r m i n e the boundary-layer c h a r a c t e r i s t i c s and aerodynamic p e r f o r m a n c e of a radial-vane sonic inlet with a length/diameter r a t i o of 1 f o r s e v e r a l vane con figurations. T h e sonic inlet w a s designed with a slight "wavy wall" type of diffuser geometry,which p e r m i t s operation at high inlet Mach n u m b e r s (sufficiently high f o r good noise suppression)without boundary-layer flow s e p a r a t i o n and with good total p r e s s u r e recovery. A new method f o revaluating the turbulent boundary l a y e r w a s developed t o s e p a r a t e the boundary l a y e r f r o m the i n viscid c o r e flow, which is c h a r a c t e r i z e d by a total p r e s s u r e variation f r o m hub t o tip, and to de t e r m i n e the experimental boundary -layer p a r a m e t e r s.18. Distribution Statement7. Key Words (Suggested b y A u t h o r ( s ) )Inlet flow; inlet design; sonic inlet; inlet bounda r y l a y e r s ; diffuser design; inlet performance;diffuser boundary layer; turbulent boundarylayer; nonequilibrium turbulent boundary l a y e r19. Security Classif. (of this report)UnclassifiedUnclassified - unlimitedSTAR Category 0220. Security Classif. (of this page1Unclassified21. No. of Pages5722. Price' 4.50
ICONTENTSPage.INTRODUCTION . . . . . . . . . . . . . . . . . . . . . . . . . . . . . . . . . . . . .APPARATUS AND PROCEDURE . . . . . . . . . . . . . . . . . . . . . . . . . . . .InletDesign . . . . . . . . . . . . . . . . . . . . . . . . . . . . . . . . . . . . . .Instrumentation . . . . . . . . . . . . . . . . . . . . . . . . . . . . . . . . . . . .Test Procedure . . . . . . . . . . . . . . . . . . . . . . . . . . . . . . . . . . . . .Data Reduction . . . . . . . . . . . . . . . . . . . . . . . . . . . . . . . . . . . .Calculation of flow properties and aerodynamic performance . . . . . . . . . .Boundary-layer evaluation . . . . . . . . . . . . . . . . . . . . . . . . . . . . .RESULTS AND DISCUSSION . . . . . . . . . . . . . . . . . . . . . . . . . . . . . . .Aerodynamic Performance . . . . . . . . . . . . . . . . . . . . . . . . . . . . . .Takeoff (no vane) configuration . . . . . . . . . . . . . . . . . . . . . . . . . . .Landing (35 tapered vane) configuration . . . . . . . . . . . . . . . . . . . . . .Boundary-Layer Characteristics . . . . . . . . . . . . . . . . . . . . . . . . . . .Comparison of diffuser design parameters with experimental results . . . . . .SUMMARY.SUMMARY O F RESULTS . . . . . . . . . . . . . . . . . . . . . . . . . . . . . . . .APPENDIX- SYMBOLS . . . . . . . . . . . . . . . . . . . . . . . . . . . . . . . . .REFERENCES . . . . . . . . . . . . . . . . . . . . . . . . . . . . . . . . . . . . . .Comparison of calculated and experimental boundary-layer parametersiiiLI.II II I11111111.111111111111111 1111111111111. . . .I1I1 111111111I1 1111111111112335666812131516171718212325
PERFORMANCE AND BOUNDARY-LAYER EVALUATIONOF A SONIC INLETby James F . Schmidt and Robert S . RuggeriLewis Research CenterSUMMARYTests were conducted to determine the boundary-layer characteristics and aerody namic performance of a sonic inlet. The inlet configuration for takeoff used an extendedcenterbody moved forward to choke the flow in the cowl throat. Further throat-area re ductions f o r the landing inlet configurations were obtained by using radial vanes in thethroat region. Data were taken with four sets of blockage vanes consisting of two35-vane configurations and two 54-vane configurations.For each of these configurations , experimental total pressure measurements wereused to determine the inlet total-pressure recovery, the radial total pressure distribu tion, and the turbulent-boundary-layer velocity profiles. Surface static pressure mea surements were made on the hub and cowl surfaces.The radial-vane configuration of 35 vanes with tapered thickness (35- tapered-vaneconfiguration) provided the best total pressure recovery over the complete range ofnormalized average throat Mach number Mt, av. High average throat Mach numbers(Mt,av 0.80) , sufficiently large to suppress engine noise radiation through the inlet,were measured for the takeoff (no vane) and landing (35 tapered vane) configurations.The sonic inlet still maintained a high total pressure recovery (greater than 0.975).The concept of controlling the velocity gradient in the diffuser with a specially de signed "wavy wall" type of diffuser geometry not only prevented boundary-layer separa tion but also tended to minimize the total pressure losses.A new method f o r evaluating the turbulent boundary layer was developed to separatethe boundary layer from the inviscid core flow, which is characterized by a total pres s u r e variation from hub to tip, and to determine the experimental boundary-layerparameters.
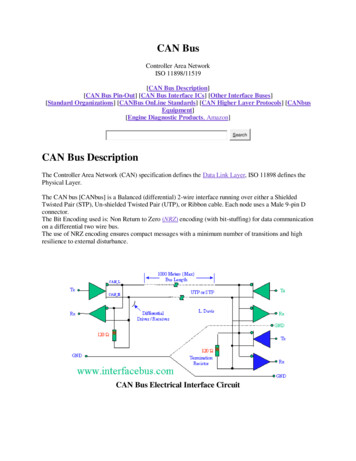
INTRODUCTIONSince a primary source of jet aircraft noise is engine noise, most noise reductionsystems are.primarily designed to reduce engine noise. Experimental results haveconvincingly demonstrated that compressor and/or fan noise can be reduced by chokingthe inlet flow either with inlet vanes o r by contracting the cowl walls (refs. 1 to 3).These specially designed inlets, usually referred to a s sonic inlets, greatly reduce theengine noise radiating through the inlet by operating at o r near the sonic condition(M 1). However, these high-velocity inlets as compared with conventional inlets) pro duce reduced inlet total pressure recoveries and increased flow distortion, which couldimpose a penalty on the aerodynamic performance of the fan and/or compressor. Inparticular, this reduced aerodynamic performance may significantly reduce the stallmargin of a compressor o r fan.Considering the history of proven sonic-inlet noise reduction and the need for goodaerodynamic inlet performance, this experimental investigation was conducted to d e t e rmine the aerodynamic performance and boundary-layer characteristics of a sonic inlet.The inlet configuration f o r takeoff used an extended centerbody moved forward to chokethe flow in the cowl throat. Further throat-area reductions for the inlet landing config urations were obtained by using radial vanes in the throat region. Four flow-blockagevane configurations were used: a 35-tapered-vane configuration, a 35-constant thickness-vane configuration, a 54-tapered-vane configuration, and a 54-tapered-and slanted-vane configuration.The takeoff configuration with the extended centerbody was designed to choke the in let a t the design fan weight flow (33.2 kg/sec) . The 35-vane landing configurations weredesigned to choke the inlet a t a weight flow that is 80 percent of the fan design weightflow. Likewise, the 54-vane landing configurations were designed to choke the inlet a t aweight flow that is 70 percent of the design flow. Therefore, the 35- and 54-vane con figurations represent an operating range for the approach (or landing) configuration.Increasing the local flow velocity to the n e a r s o n i c flow condition and then diffusingto a suitable velocity to achieve good fan performance produce thick wall boundary lay ers and possible flow separation. Since inlet length and weight must be kept to a mini mum, proper adjustment of the inlet to provide sonic o r near-sonic flow and then suffi cient velocity diffusion without separation represent some of the many compromises re quired for the design of sonic inlets. Because of the large velocity diffusion produced bythe choked flow and the short inlet diffuser, the cowl surface is specially designed with a.slight wavy-wall type of geometry to prevent turbulent boundary-layer separation.Experimental total pressure measurements from passage survey rakes a t the fanentrance station were used to determine the inlet total pressure recovery and the radialtotal pressure distortion. Surface static pressure distributions were measured on both2
the hub and cowl surfaces. Strain-gage measurements were also taken on one vane f o reach vane configuration to determine if a flutter condition occurred. In addition, totalpressure measurements from boundary-layer rakes were used to determine theboundary-layer velocity distribution just after the inlet diffuser on the cowl surface anda t the fan entrance on both the hub and cowl surfaces. A l l experimental tests were runwithout the fan in place over a range of weight flows from a low value to the maximumweight flow.A new method for evaluating the turbulent boundary layer was developed to separatethe boundary layer from the inviscid core flow, which is characterized by a total pres sure variation from hub to tip, and to determine the experimental boundary-layerparameters.APPARATUS AND PROCEDUREThe experimental facility used in this investigation, except for the installation ofthe sonic inlet (fig. l), is the same a s the compressor test facility described in refer ence 4. Atmospheric a i r enters the test facility from an inlet on the roof of the build ing; flows through the various valves, piping, plenum, and the test section; and thenexhausts to a low-pressure (67.6-pascal (20-in. -Hg)vacuum) exhaust system.Inlet DesignThe sonic-inlet configuration showing the extended centerbody and the location of theradial vanes is illustrated in figure 2 . The cowl portion of the inlet consists of an en tering flight-lip type of geometry converging to the throat region with a following diver ging diffuser section emptying into an existing straight section. The straight sectionhouses the five slanted support struts, which produced a 2 percent blockage in the flow.These slanted support struts have an axial chord length of 5.41 centimeters and a r e lo cated j u s t after the diffuser section (fig. 2). The hub centerbody, which was an existingpart, is composed of a spinner type of nqse design proceeding to the thmat section witha following (slight linear variation) section that continues to the end of the diffuser.Thus, this diffuser design consisted of contouring the cowl surface from the throat tothe diffuser outlet (a Mach number diffusion of from 1 . 0 to 0.34 in a distance of27.60 cm) such that boundary-layer separation was avoided.Two flow-analysis codes were applied. The first was an inviscid-flow calculationcode, and the second a turbulent-boundary-layer calculation code. The inviscid-flowcode requires that a geometry be specified, and the boundary-layer flow code requires3
that a pressure (velocity) distribution be specified. Thus, the design procedure be comes an indirect and iterative process. The diffuser design guideline used to avoidboundary-layer separation was that the boundary-layer form factor H should always beless than 2 . 2 . The turbulent-boundary-layer calculation method (ref. 5) was used todetermine H and other boundary-layer parameters. The boundary layer, which startsnear the stagnation point, was assumed to be turbulent over the entire length of the in let. The form factor H was found to be insensitive to the initially assumed value forthe turbulent-boundary-layer thickness near the stagnation point. An inviscid-flow cal culation method, from an in-house compressor aerodynamic flow design program thatconsiders s treamline-curvature and flow-blockage effects, was used to determine thefree-stream Mach number distribution for a given o r assumed diffuser geometry. Thisfree-stream Mach number distribution was then used a s input to the boundary-layerprogram .The first step in designing the diffuser was to determine the general free-streamMach number distribution that would prevent boundary-layer separation but still providethe required velocity diffusion. Then the cowl geometry was modified until the inviscid flow calculation produced the desired Mach number distribution along the cowl surface,including the boundary-layer displacement effect on the flow. The boundary-layer formfactor was maintained under a limiting value of 2 . 2 by judiciously varying the rate ofvelocity diffusion. Figure 3 shows the slight wavy-wall type of geometry that evolvedfrom calculations based on this design philosophy. This wavy-wall type of geometryoccurred almost immediately downstream of the vanes on the cowl surface. First, i twas necessary to take the maximum velocity diffusion as soon a s possible after thethroat while the turbulent boundary layer was still quite small. Then, before the formfactor H became too large (an indication of separation), the slight wavy-wall type ofgeometry was encountered, which reversed the direction of H (fig. 3). For the re maining portion of the diffuser only a small amount of velocity diffusion was required,which resulted in good control over the form factor and thereby the turbulent boundarylayer. Figure 3 also shows the resulting change in the free-stream Mach number afterthe throat that is required to reverse the direction of H. Surface coordinates of thecowl and hub centerbody a r e given in figure 2.The sonic inlet with the radial vanes in place a s shown in figure 2 is the approach(or landing) inlet configuration. The takeoff inlet configuration consists of this sameinlet but with the radial vanes removed o r retracted. The four landing vane configura tions were a 35-tapered-vane configuration, a 35-constant-thickness-vane configuration,a 54-tapered-vane configuration, and a 54-tapered-and-slanted-vane configuration.To obtain a true comparison of the tapered- and constant-thickness vanes, thetapered-thickness vane was designed with the same integrated, flow-blockage, crosssectional area a s the constant-thickness vane. The surface coordinates f o r the4
constant-thickness vanes, which have a td c of 1 0 percent, a r e given in figure 4.v, mIn figure 5, the surface coordinates a r e given for the tapered-thickness vanes, whichhave t,x/c of 6 percent at the hub to 14 percent at the tip. These vanes a r ev, mtapered with the thinnest section at the hub in order to produce the smallest possiblethroat flow blockage in a region where the cross-sectional flow area is the smallest.The slanted vanes were also designed with a tapered thickness and a r e slanted at a pproximately 28' (fig. 6 ) . The reason for testing a slanted vane configuration is thatsome unpublished results have suggested that improved aerodynamic performance canbe obtained with slanted blades. An angle view of a tapered vane and a vane with con stant thickness is shown in figure 7 .The 35-vane configuration was designed to choke the inlet with a weight flow that is80 percent of the fan design weight flow (32.2 kg/sec) f o r the two-stage fan with a tipspeed of 426 meters per second. Similarly, the 54-vane configuration was designed tochoke the inlet a t a weight flow that is 70 percent of the design weight flow. The 35- and54-vane configurations produce throat-area flow reductions of 19.23 and 29.67 percent,respectively. The 35-vane configuration installed in the sonic inlet is shown in figure 8.Likewise, figures 9 and 1 0 show the 54-vane configuration with tapered vanes and the54-vane configuration with tapered and slanted vanes , respectively, installed in thesonic inlet. For each configuration the vanes were pin-connected at the hub and boltedto a ring spacer a t the cowl.InstrumentationAxial locations of the survey rake instrumentation a s well a s the static pressuretaps a r e shown in figure 11, and their circumferential locations a r e shown in figure 12.In the plenum chamber, two pressure taps and two thermocouples were used to meas u r e the total pressure and total temperature. A calibrated orifice plate upstream of theplenum and the test section was used to measure the weight flow.The detailed dimensions of the five total pressure rakes at the fan entrance a r egiven in figure 1 2 . Each total pressure rake had six tubes that were designed to belocated a t the corresponding center of six equal cross-sectional areas, the sum of whichequals the total flow-passage area. This particular orientation of the total pressuretubes made it particularly simple to calculate the area-weighted average of all totalpressure rake measurements. The detailed dimensions of the three total pressureboundary-layer rakes a r e given i n figure 13, which shows one rake on the cowl surfaceand another rake on the hub surface a t the fan entrance axial location. The remainingboundary-layer rake is located on the cowl surface just a short distance from the diffu ser section, as already indicated in figure 11.5
The static and total pressure measurements were made with a strain-gage type oftransducer. A representative vane for each vane configuration was strain gaged in or der to observe vane stresses and to determine if a flutter problem existed, especiallynear the choking weight flow. A l l data were automatically and centrally recorded onmagnetic tape.Test ProcedureThe sonic inlet was operated over a wide range of average throat Mach numbers byaccurately regulating the a i r weight flow with the exhaust valve. After the exhaustvalve was set, the automatic, on-line, data reduction program was used to determinethe average throat Mach number and the total p m s s u r e recovery a s well as the exactmeasured experimental weight flow. Then, if necessary, a fine vernier change to theexhaust valve setting could be performed for a more accurate desired weight flow. Thistest procedure became particularly useful in obtaining the desired flow condition nearand at the choking weight flow, because a relatively small change in weight flow nowproduced a significant change in the total pressure recovery. After the desired flowcondition was obtained, the data were automatically and centrally recorded on magnetictape. Also, the s t r e s s e s on the instrumented vanes were checked at each flow condi tion.Data ReductionA l l measured data were converted to SI units and corrected to standard conditions.Calculation of flow properties and aerodynamic performance. - One-dimensionalflow equations along with the measured data w e r e used to calculate the velocity, Machnumber, temperature, and density along the hub and cowl surfaces. The averagethroat Mach number Mt, av was calculated from the following one-dimensional flowequation (ref. 6 ) :(See the appendix for definitions of all symbols.) The effective thmat area Aeff is6
where the total throat area Att without vanes isrA tt [ ( r - ) hJ2](3)The vane blockage area Avb a t the geometric throat isThe average throat Mach number is easily obtained from equation (1)with an itera tive procedure using the known values of measured weight flow, total plenum pressureand temperature, and effective throat area. A s used in reference 3 , the normalizedaverage throat Mach number, which is useful f o r comparing different inlet configura tions, is defined a sMt,n-((Mt,av)Mt,av max)where Mt, av max is the maximum value of the average throat Mach number, whichoccurs a t the fully choked flow condition.Total pressure rake measurements at the fan entrance a r e used to calculate thetotal pressure recovery,where Pa,, the area-weighted average total pressure, is2'aa-- i l.AiPi(7)7
Boundary-layer eElya&on. - At higher average throat Mach numbers (Mt, av 20.80) , large radial total pressure distortion from hub to cowl was measured a t the fanentrance. This large total pressure distortion reflects not only the total pressure lossdue to the turbulent boundary layer, but also a large loss due to the flow disturbance ofthe choking vanes upstream in the throat region. Therefore, it becomes a very diffi cult problem to separate the total pressure boundary-layer distribution from the rota tional, inviscid, total pressure distribution. This problem is further complicated bythe fact that not only is the usual boundary-layer thickness unknown, but also the freestream (edge of the boundary layer) velocity is unknown. To calculate the standardboundary-layer parameters from the measured boundary-layer data, it is necessary tofind some means of calculating o r approximating the boundary-layer edge velocity a swell a s separating the total pressure boundary-layer distribution from the inviscid totalpressure distribution. By using an approximate engineering approach, the followingturbulent-boundary-layer data reduction program was developed. It is roughly based onthe concept of "matched asymptotic expansions" a s described by Van Dyke (ref. 7). Aniteration procedure was used for establishing Ue that incorporated this general conceptof matched asymptotic expansions. The boundary-layer calculation is referred as "themethod of construction of the boundary layer from rotational core flows.From Van Dyke's original concept (ref. 7) and a s suggested f o r internal flows byMellor and Wood (ref. 8), the measured velocity across an annular passage with totalpressure variation is given by0um - Ub UhV- uewhere Um is the overall measured velocity profile, ub is the inner expansion orboundary-layer velocity profile, Uinv is the outer expansion o r inviscid velocity pro file, and Ue is the common asymptote o r boundary-layer edge velocity. Figure 14graphically describes this method of construction of the boundary layer from rotationalcore flows applied to the data for one rqresentative sonic-inlet flow condition.The measured velocity profile U,was determined from the standard compres sible flow relations by using the measured total and static pressures and the measuredplenum temperature. Since the boundary-layer total pressure measurements did notextend far enough into the inviscid core region, a n average of the five total pressurerake measurements at each radial position was used to determine the measured velocityprofile in the central core region of the channel (figs. 15 and 16). These total pressurerake measurements at the fan entrance axial location were assumed to be valid for sta tion 19 (just after the end of the diffuser). The loss o total pressure due to the supportstruts was assumed to be small such that the radial total pressure distribution in thecore flow at station 1 9 is essentially the same as a t the fan entrance. The inviscid8I
. .velocity profile Uinv was only known f a r from the cowl o r hub surface (equal to Umin the core of the annular passage) and outside the boundary layer. However, with aninitial value of Ue, the outer values of the inviscid velocity profile were curve fit witha quadratic equation to the wall value Cue). With distributions of Um, Uinv, and aninitially assumed value for Ue , the boundary-layer velocity profile Ub was calculatedfrom equation (8).A s previously suggested, some means of calculating o r approximating theboundary-layer edge velocity Ue is needed along with equation (8) to determine the ex perimental boundary-layer profile Ub. The general calculational procedure consistsof an iteration f o r Ue until the correct boundary-layer edge velocity is obtained.First, an initial value of Ue is assumed and the inviscid velocity profile' Uinv is ob tained by curve fitting the outer core velocities to the wall value Ue. Second, theboundary-layer profile Ub is calculated from equation (8) with the calculated Uinvand the assumed Ue. Then, the skin friction coefficient Cf can be approximated byusing the first two data points in a "law of the wall" model with Ue. The momentumthickness 8, the displacement thickness 6*, and the form factor H can be calculatedby using the calculated Ub and the assumed Ue. Finally, a new Ue can be obtainedfrom Ludwieg and Tillman's empirical relation (ref. 10) for the skin friction coefficientCf by using the previously calculated 8 , H, and Cf. Thereby, this process is re peated until the correct iterated value of Ue is calculated and hence the properboundary-layer profile ub is automatically obtained.A detailed account of this general iteration procedure f o r Ue is given by the fol lowing formulation of equations. By using the assumed Ue and the first two data pointsnearest the wall, the experimental skin friction coefficient can be calculated accordingto the law-of-the-wall model (ref. 9)U f - b'1 5.75l0%OYf 5.5(9)e'where the dimensionless wall distance parameter Y can be expressed a swhere Y is the boundary-layer distance, taw is the adiabatic wall temperature, te is9
the temperature a t the edge of the boundary layer, pe is the density a t the edge of theboundary layer, and paw is the dynamic viscosity based on the adiabatic wall temper ature.A f t e r rearranging equation (9), the skin friction coefficient is calculated from thefollowing equation:e\"/5.75 loglo Y 5 . 5Equation (11)is applied a t the f i r s t two data points and averaged to get Cf/2. Initially,a value f o r Cf/2 is assumed in equation (9), and the correct value of Cf/2 is found byiteration of equations (9) and (11).Since the Mach number was low in the straight annular section where the boundarylayer rakes were located, the flow was considered to be incompressible. The assumedUe and the calculated boundary-layer velocity profile ub were used to calculate thefollowing incompressible momentum and displacement thicknesses :Momentum thickness:TTDisplacement thickness:T7where Yinv is the distance from the wall associated with the maximum measured corevel0 city.The form factor H is defined a sH --- 6 *e10
The Ludweig- Tillman empirical relation for the skin friction coefficient from ref erence 10 is-1'561H)[-kfC 0.123(e2] ?Mi)k)l/(y-1) o*268(15)where po is the density based on total conditions, Me is the Mach number a t the edgeof the boundary layer, p ref is the dynamic viscosity based on reference temperature,and the reference temperature (ref. 11) is given by%ef tek-1 0.72Pr)1 / 3 ye.]22where the Prandtl number Pr is assumed to be 0.71.After solving for Ue in equation (15), the new velocity a t the edge of the boundarylayer becomeswhere Cf/2, 8 , H , and other terms in equation (17) have already been calculated forthe previously assumed value of Ue.After each new Ue is determined, a new total pressure Pe can be calculated, byusing the new Ue and the measured static pressure, from a n iteration of the followingequations:11
The general iteration procedure for Ue is summarized by the following steps:(1)The measured velocity profile Um is determined from the standard flow rela tions by using the measured static and total pressures and the measured plenum tem perature.(2) The inviscid velocity profile Uinv is obtained by curve fitting the outer corevelocities to the initially assumed wall value Ue.(3) The boundary-layer profile ub is calculated from equation (8) by using the cal culated Uinv and present value of Ue.(4) With Ue and the f i r s t two data points f o r Ub and Y known, equations (9)to (11)a r e solved for Cf.(5) By using Ue and Ub, the boundary-layer quantities 6*, 8, and H a r e calcu lated from equations (12) to (14).(6) With the calculated H , 8 , and Cf, equation (17) is solved for a new Ue.(7) By using the new Ue and equations (18) to (ZO), a new total pressure Pe iscalculated.(8) With the new Ue and Pe, steps 2 to 7 a r e repeated until the final iterated Ueis obtained.RESULTS AND DISCUSSIONThe aerodynamic performance of the sonic inlet (table I includes representativedata points) with the various vane configurations is discussed in terms of the total pres s u r e recovery, the radial distribution of total pressure a t the fan entrance, and theMach number distributions along the hub and cowl surfaces. The total pressure recov ery is presented a s a function of the average throat Mach number, which approaches amaximum value for each vane configuration a s the inlet reaches a choked flow condi tion. In addition, the aerodynamic performance is discussed in terms of the measuredwall boundary-layer characteristics, which can have a major influence on the aerody namic performance a s the choked condition is approached. The total pressureboundary-layer measurements were not used in calculating the total pressure recovery.Since the tubes of the total pressure rakes across the annulus a r e designed to be locatedon the basis of equal cross-sectional areas (fig. 12) , inclusion of the boundary-layermeasurements for the 35-tapered-vane configuration resulted in a negligible effect onthe total pressure recovery ( O. 5 percent).12
Although this experimental study is primarily directed a t aerodynamic perform ance, some estimate of the average throat Mach number at which a sonic inlet will sig nificantly reduce the engine noise radiated out the inlet is desirable. F o r this estimate,the noise results of reference 12 were used. The sonic-inlet noise tests of reference 12disclose that a significant noise reduction of 10 decibels o r greater occurs for Mt, av w0.80. A s M t , a v is increased above 0.80, the noise reductions also increase rapidly.Aerodynamic PerformanceIn addition to the aerodynamic performance of the sonic inlet for the takoff (novane) configur
less than 2.2. The turbulent-boundary-layer calculation method (ref. 5) was used to determine H and other boundary-layer parameters. The boundary layer, which starts near the stagnation point, was assumed to be turbulent over the entire length of the in let. The form factor H was found to be insensitive to the initially assumed value for