Transcription
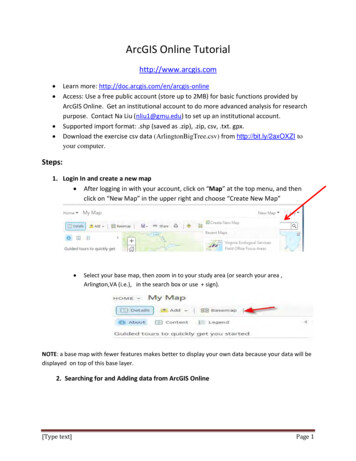
ArcGIS Online Tutorialhttp://www.arcgis.com Learn more: http://doc.arcgis.com/en/arcgis-onlineAccess: Use a free public account (store up to 2MB) for basic functions provided byArcGIS Online. Get an institutional account to do more advanced analysis for researchpurpose. Contact Na Liu (nliu1@gmu.edu) to set up an institutional account.Supported import format: .shp (saved as .zip), .zip, csv, .txt. gpx.Download the exercise csv data (ArlingtonBigTree.csv) from http://bit.ly/2axOXZI toyour computer. Steps:1. Login In and create a new map After logging in with your account, click on “Map” at the top menu, and thenclick on “New Map” in the upper right and choose “Create New Map” Select your base map, then zoom in to your study area (or search your area ,Arlington,VA (i.e.), in the search box or use sign).NOTE: a base map with fewer features makes better to display your own data because your data will bedisplayed on top of this base layer.2. Searching for and Adding data from ArcGIS Online[Type text]Page 1
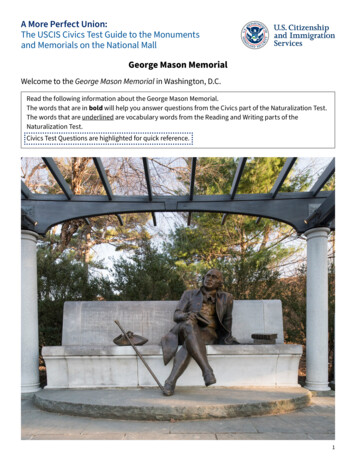
Click onbutton, choose Search for layers and type, “Arlington VA” inthe search box and select “ArcGIS Online” from the drop down menu, then click,GO (see the figure below)Select, “Arlington Boundaries and Facilities” layer (Choose the name of the layerto see more information on the layer in the item details) and click ADD to put thelayer on your map.Select another layer, “Soil” layerClick Done Adding LayersNote: if you choose not to add the layer, click the My Map button at the top of the screen toget back to your map (using your browsers’ back button will likely erase your map)3. Adding your own data. [Type text]To upload data that is stored on your computer, click Add Add Layer from FilePage 2
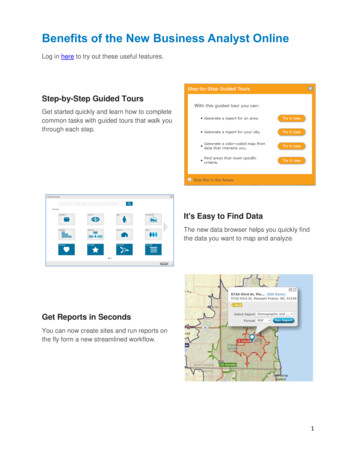
Select “ArlingtonBigTrees.csv” from your computer (or http://bit.ly/2axOXZI) and clickImport Layer. The layer will be automatically displayed on the map. Choose an attribute to show (Common Name, i.e.) Select another attribute (total point, i.e.) Explore to select both attributes (choose a drawing style as Types & Size as shownbelow), click DONE.Note: To change of the order of thelayers to be display: Click on . (ellipse)when you click the title of layer, chooseMOVE UP or DOWN option.Note: Click on Change Style arrow toget back to your previous optioninstead of your browser’s back arrowbutton if you don’t want to start it allover again4. Examine your own data Click on “ArlingtonBig Trees Layer” and find Table iconFind those trees that are not in Arlington CountyFind those name of trees having more than 300 total pointsNote: Use “Table Option” and use “sort descending/ascending” option.5. Identify a relation between the layers. Click on “ArlingtonBoundary and Facilities layer”, Uncheck All points and parcels. Parksand County boundary should be the only one selected.Click on “ArlingtonBig Tree layer” and choose Total point as attribute, see there is arelation between two layers (Park vs Big trees).[Type text]Page 3
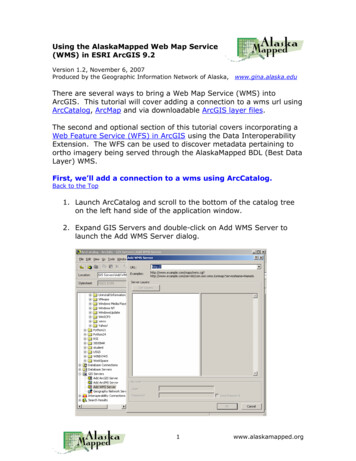
Click on “Soils (Arlington County)”, Soil Poly, andthen choose Change Style button (see the figureright). Choose SLOPE as an attribute to show andchoose, Type(Unique symbols) as a style option.Then click DONE.Choose SERIES as an attribute, choose Counts andAmounts as style option, then select OPTIONS again.You can change classification style (with Quantile method) and click OK. See whetherthere is a relation between two data.Note: Adjust Transparency level to see a visible content of yoursymbols in relation to the other layersNote: Layers created by other organizations often cannot be edited or customize. Layers thatyou uploaded can be edited and you can view the table and change how the data aredisplayed**[Type text]Page 4
6. Customizing how data layers are displayed (Pop-ups, change size andcolor of symbols)Make sure Details and Contents are selected from the top menu bars.a. Click layer name, you will see . (ellipses) and you will see a popup actions that you can take (Change the name of layer, labels, &configure pop-ups, etc).b. Choose Configure Pop-up, type “Arlington Big Trees.” ClickConfigure Attributes in the content sectionc. Change the attribute list so that it displays only theCommon Name (or play around other options)d. Click OK to see how the pop-up changed.e. Make other adjustment such as color, size, symbols by clickingSymbol.7. Finishing and save your map Click the legend tab to see information about how your data aredisplayed.From Add menu on the top, Choose Add Map Notes (in publishingmode) to add a title of you map and change color, size and other adjustments such aslabels.a. Click Createb. Click the Text buttons and click on the map to add a title of your mapc. Type “Big Trees” (or “Arlington County Big Trees”)d. Make other adjustments (size, color, etc.)e. Open “Configure Pop-up”, click on Configure Attributes to change a fieldClick Save. Enter a title, tags, and a description to your map.Click Share to share with certain group members, link to the map, or embed it in awebsite or create your map in web application format.Source : “ArlingtonBigTree” data was originally from http://bigtree.cnre.vt.edu and extractedonly for Arlington County, VA. Contact by Joy Suh (hsuh1@gmu.edu) for any questions related tothis tutorial.[Type text]Copyright @ Data Service Group, GMU Libraries.Page 5
the search box and select "ArcGIS Online" from the drop down menu, then click, GO (see the figure below) Select, "Arlington Boundaries and Facilities" layer (Choose the name of the layer to see more information on the layer in the item details) and click ADD to put the layer on your map. Select another layer, "Soil" layer