Transcription
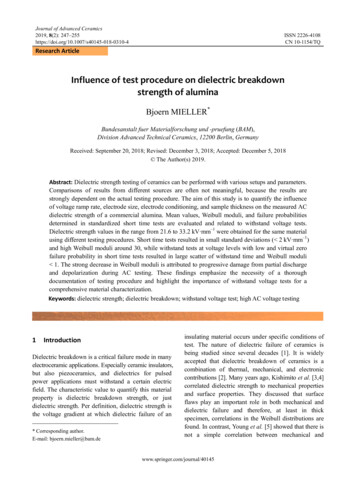
Journal of Advanced Ceramics2019, 8(2): ISSN 2226-4108CN 10-1154/TQResearch ArticleInfluence of test procedure on dielectric breakdownstrength of aluminaBjoern MIELLER*Bundesanstalt fuer Materialforschung und -pruefung (BAM),Division Advanced Technical Ceramics, 12200 Berlin, GermanyReceived: September 20, 2018; Revised: December 3, 2018; Accepted: December 5, 2018 The Author(s) 2019.Abstract: Dielectric strength testing of ceramics can be performed with various setups and parameters.Comparisons of results from different sources are often not meaningful, because the results arestrongly dependent on the actual testing procedure. The aim of this study is to quantify the influenceof voltage ramp rate, electrode size, electrode conditioning, and sample thickness on the measured ACdielectric strength of a commercial alumina. Mean values, Weibull moduli, and failure probabilitiesdetermined in standardized short time tests are evaluated and related to withstand voltage tests.Dielectric strength values in the range from 21.6 to 33.2 kV mm–1 were obtained for the same materialusing different testing procedures. Short time tests resulted in small standard deviations ( 2 kV mm–1)and high Weibull moduli around 30, while withstand tests at voltage levels with low and virtual zerofailure probability in short time tests resulted in large scatter of withstand time and Weibull moduli 1. The strong decrease in Weibull moduli is attributed to progressive damage from partial dischargeand depolarization during AC testing. These findings emphasize the necessity of a thoroughdocumentation of testing procedure and highlight the importance of withstand voltage tests for acomprehensive material characterization.Keywords: dielectric strength; dielectric breakdown; withstand voltage test; high AC voltage testing1IntroductionDielectric breakdown is a critical failure mode in manyelectroceramic applications. Especially ceramic insulators,but also piezoceramics, and dielectrics for pulsedpower applications must withstand a certain electricfield. The characteristic value to quantify this materialproperty is dielectric breakdown strength, or justdielectric strength. Per definition, dielectric strength isthe voltage gradient at which dielectric failure of an* Corresponding author.E-mail: bjoern.mieller@bam.deinsulating material occurs under specific conditions oftest. The nature of dielectric failure of ceramics isbeing studied since several decades [1]. It is widelyaccepted that dielectric breakdown of ceramics is acombination of thermal, mechanical, and electroniccontributions [2]. Many years ago, Kishimito et al. [3,4]correlated dielectric strength to mechanical propertiesand surface properties. They discussed that surfaceflaws play an important role in both mechanical anddielectric failure and therefore, at least in thickspecimen, correlations in the Weibull distributions arefound. In contrast, Young et al. [5] showed that there isnot a simple correlation between mechanical andwww.springer.com/journal/40145
J Adv Ceram 2019, 8(2): 247–255248dielectric failure in high voltage multilayer ceramiccapacitors. Different mechanisms and origins of failurewere observed in that study.Dielectric strength has also been related to fracturetoughness and wear [6,7]. Higher purity and ZrO2doping enhanced both fracture toughness and dielectricstrength in alumina [6]. Haddour et al. [7] discussedthat mechanical and dielectric phenomena are effectivein debris formation during wear. They concluded thathigh breakdown strength generally involves weak wear,although their data does not invariably follow thistendency. A proportionality of dielectric strength to the 0.5 power of relative permittivity is shown bydifferent groups of researchers [8,9]. Trapping ofcharges [10,11] and space charge limited conductivity[12–14] are recently discussed to be decisive forbreakdown channel formation in ceramics.A noteworthy characteristic of dielectric strength,especially with respect to test conditions, is its thicknessdependence. In contrast to common mechanical strengthconcepts, dielectric strength shows a 1/ d dependence,where d is the sample thickness [6,8,15]. Neusel andSchneider [15] concluded that the thickness dependencecannot be explained by the Weibull concept. Theyproposed a concept of conducting filaments that initiatebreakdown, with the minimum length of such filamentsbeing the reason for a thickness independent intrinsicbreakdown and a thickness dependent extrinsicbreakdown. Fischer and Schneider [16] experimentallydetermined the filament length in a commercialborosilicate glass to be around 20 µm.Besides these fundamental studies on the nature ofdielectric breakdown, several groups work on newmaterials with enhanced dielectric strength forinsulation [17,18] or energy storage in pulsed-powercircuits [19–22]. Although dielectric strength testingoften is a key feature of the publications in this field,testing procedures are strongly different and in manycases poorly described. With this study, we would liketo address this issue. If a ceramic material is supposedto be characterized with respect to its dielectricstrength for a practical application, many choices haveto be made regarding sample properties and testprocedure. The ASTM D149 [23] provides a decentbasis for choosing or developing an appropriate testdesign. But there are important criteria of a dielectricstrength test which are not unambiguously prescribedby the standard, including voltage ramp rate andelectrode size and condition.The aim of this study is to quantify the effect ofdifferent testing conditions, all within the frameworkof the valid standard, on the dielectric strength resultsfor a commercial alumina. Furthermore, we discuss therelevance of well-established short time tests and thefailure probabilities which can be derived from thesetests with respect to the durability of the material inconstant voltage gradients.22. 1Experimental procedureSample preparationCommercially available thickfilm substrates made of96% alumina (Rubalit 708S, CeramTec, Germany)were chosen as test material. Substrates with twodifferent thicknesses were used for different tests.Short time tests with varying voltage ramp rates wereperformed on samples with a nominal thickness of 380µm. For short time tests with different electrodes andfor withstand voltage tests, samples with a nominalthickness of 620 µm were used. The as-deliveredsubstrates were cut to square-shaped samples with50 mm edge length. An average surface roughness ofRa 0.3 µm with a standard deviation of 0.01 µm wasdetermined by measurements of 27 samples (threemeasurements per sample) using a tactile roughnesstester (Hommel-Etamic W10, Jenoptik, Germany).Before testing or metallization, the samples werecleaned in an ultrasonic bath using a 1:1 mixture ofethanol and acetone and subsequently dried at 105 for 2 h. One group of 56 samples was metallized byscreen printing of a 25 mm diameter sphericalpalladium/silver electrode (DuPont 6134, DuPont U.K.Limited, UK) and firing at 850 for 10 min.2. 2Dielectric strength testingA 35 kV alternating voltage measuring system (WGBS4.4/35-50 HPS, HIGHVOLT, Germany), operating atcommercial frequency of 50 Hz, was used for allmeasurements. Dielectric strength testing was performedaccording to ASTM D149 [23]. The thickness of eachspecimen was measured before testing using amicrometer screw. The sample to be tested was placedbetween two well aligned stainless steel cylinderelectrodes in a custom-made sample holder. If notstated otherwise, a new pair of electrodes was used foreach measurement. After carefully mounting thewww.springer.com/journal/40145
J Adv Ceram 2019, 8(2): 247–255249sample, the sample holder was placed in a bath ofinsulating oil (Diala S2 ZU, Shell). Short time testswere performed by increasing the voltage with adefined ramp until the current sensing element detectedthe dielectric breakdown. At dielectric breakdown, thevoltage was shut off immediately by a circuit breakingdevice. The actual voltage value at breakdown wasrecorded. Dielectric strength was the quotient ofbreakdown voltage and sample thickness. Withstandvoltage tests were performed by increasing the voltageby a defined ramp rate to a defined value. The voltagewas held constant until breakthrough was detected. Thewithstand time at the voltage plateau was recorded.To study the influence of the voltage ramp rate ondielectric strength, short time tests with voltage ramprates of 0.5, 1, and 2 kV/s were performed. Accordingto ASTM D149, a voltage ramp rate should be chosenthat leads to dielectric breakthrough within 10–20 s.Groups of 25 samples of 380 µm thick substrates weretested with each ramp rate using cylinder electrodeswith 6.4 mm diameter.The influence of electrode configuration on dielectricstrength was studied by four different electrodearrangements on 620 µm thick samples. One group of20 samples was tested using a new pair of 6.4 mmcylinder electrodes for each sample (Fig. 1(a)). Asecond group of 20 samples was tested using a newpair of 25 mm for each sample (Fig. 1(b)). The thirdgroup of 20 samples was tested using the same pair of6.4 mm cylinder electrodes for the entire group. Aftereach test, the electrodes were cleaned with ethanolsoaked tissue to remove adherent insulating oil. Thefourth group consisted of 56 samples metallized with a25 mm circular silver electrode. These samples weremounted on a sphere-on-plate sample holder (Fig. 1(c)).Therefore, a sample was placed on the stainless-steelplate and the stainless-steel sphere was placed in thecenter of the screen-printed electrode. The same plateand sphere were used for the entire group. With all fourelectrode configurations, short time tests with a voltageramp rate of 1 kV/s were performed to determine thedielectric strength.Withstand voltage tests were performed using6.4 mm cylinder electrodes and a voltage ramp rate of1 kV/s. A group of ten 620 µm thick samples wastested at 14 kV, which equals a voltage gradient of23 kV/mm with respect to the sample thickness.A second group of nine samples (thickness 620 µm)was tested at 12.4 kV (20 kV/mm). A time limit of 5 hwas set for these measurements.2. 3EvaluationCross-sections of several broken samples were preparedby cutting and polishing to the center of the breakdownchannel. Images of the breakdown channels were takenafter carbon vapor deposition using a scanning electronmicroscope (SEM, Gemini Supra 40, Zeiss, Germany)with secondary electron detector. For the statisticalevaluation of the dielectric strength results, thesoftware Origin 2018 (OriginLab Corporation, USA)was used. The level of significance was set to 0.05 forall statistical tests.Dielectric strength values of a group of samplestypically show a certain distribution. Two types ofprobability distributions have been considered in thisstudy to describe the data: normal (or Gaussian)distribution and Weibull distribution. A normaldistribution is characterized by a mean value x and astandard deviation σ . The probability densityfunction isf ( x) ( x x )21σ 2πe2σ 2(1)The Weibull distribution is commonly applied todescribe the distribution of mechanical strength, timeto failure, or even dielectric strength. It is characterizedby a Weibull modulus m and a scale parameter σ 0 , inmaterials science often termed characteristic strength.The Weibull probability density function isFig. 1 Schematic drawings of electrode setups: (a)6.4 mm cylinder electrodes on 50 mm sample, (b) 25 mmcylinder electrodes on 50 mm sample, (c) 50 mm samplewith 25 mm thickfilm electrode and ball-on-sphere sampleholder.m 1 x σe 0 mm x(2) σ0 σ0 The density functions appear as lines if plotted inwww.springer.com/journal/40145f ( x)
J Adv Ceram 2019, 8(2): 247–255250specific probability grids. Thus, graphing in probabilitygrids is a convenient way to visualize if experimentaldata follows the respective distribution. Figures 4, 6,and 7 show the experimental data plotted in Weibulland normal probability grids as data points. Thereference lines in the graphs show the ideal slope of thedensity functions with the characteristic parametersdetermined from the experimental data. Additionally,Kolmogorov–Smirnov test was used to test if the datais normally (or Gaussian) distributed.3ResultsDisruptive discharge at breakdown leads to theformation of a breakdown channel in all testedspecimens. Figure 2 shows a representative image ofsuch a channel. Channel formation is accompanied bylight and noise emission and characterized by materialremoval, melt formation, and cracking. The location ofthe breakdown is often, but not always, near the edgeof the electrode. No obvious differences in thebreakdown event and the resulting channel with respectto voltage ramp, electrode size, or withstand time areobserved.The results of dielectric strength tests with differentvoltage ramp rates are shown in Fig. 3. A normaldistribution of the data cannot be rejected (Kolmogorov–Smirnov, α 0.05). No clear trend regarding the influenceof voltage ramp can be found. With increasing ramprate, the mean values change from 31.8 to 31.1 kV mm–1and further to 32.2 kV mm–1. The standard deviation is 2 kV mm–1 for all three test conditions. One upperoutlier is detected for 1 and 2 skV –1. Although theabsolute differences are small, the difference betweenFig. 2 Section of a channel formed by disruptivedischarge in Al2O3 (SEM, SE-detector).0.5 and 2 kV s–1, as well as the difference between 1and 2 kV s–1 are statistically significant (two-samplet-test, α 0.05). The mean values for 0.5 and 1 kV s–1are not significantly different. The time to failure is toolong (22–28 s) for 0.5 kV s–1 and too short (6–7 s) for2 kV s–1 regarding the specification the standard. At1 kV s–1 breakdown occurs after 11–13 s.The Weibull plots of these data are shown in Fig. 4.The experimental data poorly fit the reference lines.With respect to the voltage ramps of 0.5, 1, and2 kV s–1, the Weibull moduli are 17.0, 19.6, and 18.7.The characteristic dielectric strength at 63% failureprobability is 32.7, 31.9, 34.0 kV mm–1, respectively.Figure 5 shows the results of dielectric strength testsperformed with different types of electrodes. StandardFig. 3 Dielectric strength (AC) of 380 µm thick Al2O3tested with different voltage ramp rates. Arithmetic meanvalues are drawn as black dot and written in the diagram,standard deviation in parentheses. Boxes show the median,5%, and 95% percentiles, and whiskers show minimumand maximum values. Outliers are drawn as blackdiamonds.Fig. 4 Weibull probability grid plot of dielectric strength(AC) of 380 µm Al2O3 for different voltage ramp rates.www.springer.com/journal/40145
J Adv Ceram 2019, 8(2): 247–255251Fig. 5 Dielectric strength (AC) of 620 µm thick Al2O3measured with different electrodes. Arithmetic meanvalues are drawn as black dots and written in the diagram,standard deviation in parentheses. Boxes show the median,5%, and 95% percentiles, whiskers show minimum andmaximum values.deviations are similar and 1.2 kV mm–1 for all testconditions. The mean values change with respect to theelectrode setup. Normal distribution of the data cannotbe rejected for all test conditions (Kolmogorov–Smirnov, α 0.05). A normal probability plot of thedata is shown in Fig. 6. Differences in mean values aresignificant for all comparisons (two-sample t-test,α 0.05). Best practice testing, that is new electrodesfor each test, results in a dielectric strength of 24.8kV mm–1 for 6.4 mm electrodes and 22.4 kV mm–1 for25 mm electrodes, respectively. This is a 9.6% decreaseof 2.4 kV mm–1 with respect to the smaller electrodes.Reusing the same pair of 6.4 mm electrodes results inan increase of the mean value of 1.9 (7.6%) to26.7 kV mm–1. Testing with 25 mm thickfilm electrodesresults in 21.6 kV mm–1, which is 0.7 kV mm–1 (3.4%)lower than for 25 mm cylinder electrodes and3.2 kV mm–1 (12.9%) lower than for best practicetesting with 6.4 mm cylinders. Comparing reused6.4 mm electrodes with printed 25 mm electrodes, aconsiderable difference of 5.1 kV mm–1 is observed,which corresponds to more than 22% of the total meanvalue.The Weibull probability plot of dielectric strengthdata determined by short time tests with differentelectrode configurations is shown in Fig. 7. Weibullmoduli differ between 21.4 for reused 6.4 mmelectrodes and 31.7 for 25 mm thickfilm electrodes.Best practice testing results in Weibull moduli of 29.5Fig. 6 Normal probability grid plot of dielectric strength(AC) of 620 µm Al2O3.Fig. 7 Weibull probability grid plot of dielectric strength(AC) of 620 µm Al2O3.for 6.4 mm cylinders and 28.3 for 25 mm cylinders.The characteristic dielectric strength at 63% failureprobability is the highest for reused 6.4 mm cylinders(27.2 kV mm–1) and the lowest for the 25 mm thickfilmelectrodes (22.0 kV mm–1). The difference amounts to5.3 kV mm–1. The difference of characteristic dielectricstrength determined with small (25.2 kV mm–1) andbig electrodes (22.8 kV mm–1) amounts to 2.4 kV mm–1.Two series of withstand voltage tests have beenconducted. The results are shown in Fig. 8. A broaddistribution of withstand time is observed. In a voltagegradient of 23 kV mm–1, the withstand time scattersbetween 7 s and 7 min (422 s). Five samples (50%) failwithin 47 s. Of the nine samples tested in the lowervoltage gradient of 20 kV mm–1, three samples do notfail over a period of five hours. One sample failsalready after 2.12 min. Three of nine samples failwithin 10 min.www.springer.com/journal/40145
J Adv Ceram 2019, 8(2): 247–255252Fig. 8 Cumulative frequencies of withstand time of 620µm Al2O3 tested under different AC voltage gradients.4DiscussionSignificantly different values of dielectric strength forthe same material have been determined with respect tothe different measurement conditions. The expectationsregarding the basic effect of the parameters could beconfirmed: thinner samples, smaller electrodes, andfaster voltage ramp rates result in higher dielectricstrength values. Voltage ramp shows only a minorinfluence in this study. But the bandwidth of ramp ratestested is rather small. In lab testing facilities, oftenslower ramp rates are used for characterization, whichmay affect the results substantially. For a betteroverview, all short time test results and the respectivetest conditions are summarized in Table 1. The highestdielectric strength measured in this study (33.24kV mm–1) is determined on 380 µm thin samples usingsmall 6.4 mm electrodes and a voltage ramp of2 kV s–1. In contrast, measurements of 620 µm thicksamples using 25 mm thickfilm electrodes and a voltageTable 1 Summary of all short time test conditionsand resultsSample ElectrodeVoltage NumberStandardElectrodeEDdeviationthickness diameterramp rate ofcondition(kV mm–1)–1(mm)(kV mm–1)(µm)(kV s ) 25Thickfilm1.05621.610.76ramp of 1 kV s–1 result in 21.61 kV mm–1. Thedifference amounts to 11.63 kV mm–1, which is a53.8% deviation related to the smaller value and a34.9% deviation related to the larger value, respectively.The major contribution to the difference in thiscomparison is the sample thickness. Comparing thetwo substrate types measured with the same setup(6.4 mm electrodes and 1 kV s–1), a difference of6.28 kV mm–1 is found. This is already a relativedifference of 20.2% related to the large value, and25.3% related to the small value, respectively. Asdescribed in the introduction, dielectric strength isindirectly proportional to the square root of the samplethickness [6,8]. Based on this relationship, a normalizeddielectric strength Ed,n with respect to a normalizedthickness tn can be calculated according to Eq. (3)[11,17], where Ub is the breakdown voltage and t is theactual thickness of the sample.Ed,n Ubt ttn(3)The normalized dielectric strength of 380 µmsubstrates (6.4 mm electrodes and 1 kV s–1) with tn 620 µm amounts to 24.4 kV mm–1 ( 1.2 kV mm–1).This is in very good agreement with 24.8 kV mm–1( 0.96 kV mm–1) for real 620 µm substrates testedwith the same setup. The difference of these meanvalues is not statistically significant (two-sample t-test,α 0.05).The Weibull plot for different electrode configurations(Fig. 7) shows significantly reduced characteristicdielectric strength for larger electrodes. This result is inaccordance with the work of Neusel et al. [8], whopredicted an increasing failure probability for breakdownwith increasing electrode area based on rearrangementsof the basic equations of the Weibull distribution. Theincrease of characteristic dielectric strength by reusingthe electrodes is an unexpected result. The standardrecommends substituting the electrodes if burn-off isvisible [23]. In our test, disruptive discharge duringbreakdown leads to the formation of pits at theelectrode surface, mostly located near the electrodeedge. These pits appear as innocuous black spots to thenaked eyes. But optical profilometry of used electrodesshows removal of material at these locations. Interestingly,discharge never happens twice at the same location onthe electrode surface. Still, the deterioration of electrodesurface quality due to disruptive discharge causessignificantly higher measurement results (Fig. 5).www.springer.com/journal/40145
J Adv Ceram 2019, 8(2): 247–255253Moreover, dielectric strength values appear to increasewith increasing number of tests. In the group of 20samples, the mean value of the first ten samples(26.2 0.9 kV mm–1) is significantly lower than themean value of the last ten samples (27.3 1.2 kV mm–1)(two-sample t-test, α 0.05). The outer diameter of theelectrode remains unchanged during continuous usage.Thus, a reduction of electrode area is probably not thereason for this effect. Differences in electric fielddistribution due to degrading surface smoothness of theelectrode and contamination in the surface pits may bethe cause for successively increasing results.Testing with thickfilm electrodes is faster and morecost-effective than testing with constantly replacedstainless-steel cylinders, especially for large numbers ofsamples. This study shows that only a minor differencein Weibull modulus and characteristic strength is foundcompared to cylinder electrodes of the respectivediameter, although the difference in mean values issignificant. The similarity of results determined withcylinder and thickfilm electrodes is interesting becauseof the location of the discharges. The edge of the25 mm cylinders is rounded to a radius of 3.2 mm anddischarge occurs often but not always near the edge.On all 56 thickfilm samples, the discharge occurs at thesharp edge of the printed electrode. One can assumethat distribution and concentration of the electric fieldis different at the different electrode edges (printed andcylinder), and more inhomogeneous at thickfilmelectrodes. This would be a clear disadvantage of printedelectrodes. Still, difference in the results is smallercompared to the difference between new and reused6.4 mm electrodes. Testing of hemispherically recessedand metallized samples is possible to eliminate thisedge effect. But the sample preparation is intricate.More studies are necessary to validate the suitability offlat, thickfilm metallized samples for dielectric strengthtesting.The voltage gradients for the withstand tests werechosen based on the results of the short time tests withthe respective setup (6.4 mm electrodes and 1 kV s–1).A voltage gradient of 23 kV mm–1 equals the smallestdielectric strength measured in the short time test. Theprobability of failure at 23 kV mm–1 is 5%. Still, 70%of the samples failed within one minute and no samplelasted longer than 10 minutes. Apparently, dielectricstrength and failure probabilities cannot easily betransferred from short time tests to withstand tests.This hypothesis is substantiated by the results of the20 kV mm–1 tests. Although the failure probabilityfrom short time tests is virtually zero, roughly everysecond sample fails within several minutes. The meandielectric strength and Weibull distribution from shorttime tests of 20 samples suggest a safe use of thesubstrate at 20 kV mm–1, but the withstand tests show abroad distribution of withstand time. A Weibullevaluation of the withstand time results in Weibullmoduli of 0.9 for 23 kV mm–1 and 0.7 for 20 kV mm–1.Please note that nine and ten samples are too few for areliable Weibull evaluation. Still, these low moduli arecontrary to the comparatively high Weibull modulidetermined in the short time tests.Frequent depolarization and partial discharge at poresand defects during AC testing cause an increasingdamage of the material throughout the test. Thus,breakdown strength is lower for slower ramp rates andfailure probability is higher at lower voltage levels inwithstand tests than in short time tests. Apparently,time dependent progressive degradation is more sensitiveto microstructural defects than short time failure at peakvoltage. The large scatter of withstand time then reflectsthe uneven distribution of defect size and density in thedifferent samples. This implies that withstand testing atintermediate voltage is better suited for studyingmicrostructural influence on dielectric breakdown andevaluating homogeneity and reliability of materialbatches.5Summary and conclusionsDielectric strength values are significantly affected bythe sample thickness, voltage ramp rate, electrode size,and electrode conditioning used for testing. The 1/ tdependence of dielectric strength is confirmed in thisstudy. Thinner samples, smaller electrodes, and fastervoltage ramps lead to higher breakdown voltages andthus higher dielectric strength values. Although theseissues are well known for a long time, quantification ofthese effects is hardly discussed in literature and, evenmore remarkable, important details of the testingprocedure are missing in many current publications. Ameaningful comparison of results from different sourcesis therefore often not possible. In this study, variationsof the testing procedure resulted in differences ofdielectric strength of 50% for the exact samematerial. Changing the electrode size and conditioningresulted in deviations of 22% from the overall meanwww.springer.com/journal/40145
J Adv Ceram 2019, 8(2): 247–255254value of samples of the same material and geometry. Itappears obvious that it is not sensible to provide avalue of dielectric strength for a given material withoutproper description of the measurement. To avoiduncertainties regarding the influence of degradingelectrode surface quality on the measurement result, theuse of new electrodes for each test is recommendable.Moreover, we show a stark contrast in Weibull modulidetermined in standardized short time tests (modulus 30) and withstand voltage tests (modulus 1) using thesame testing setup and voltage levels. Consequently,safe operation voltages determined in short time testsshould not be transferred to continuous operation. Theseresults give cause for the development of new testingstrategies to reliably, comprehensively, and comparablycharacterize the dielectric strength of ceramic he author likes to thank W. Guether and J. Biberstein forperforming the numerous measurements and S. Benemann(BAM Division 6.1) for SEM ]Gerson R, Marshall TC. Dielectric breakdown of porousceramics. J Appl Phys 1959, 30: 1650–1653.Owate IO, Freer R. AC breakdown characteristics ofceramic materials. J Appl Phys 1992, 72: 2418–2422.Kishimoto A, Koumoto K, Yanagida H. Mechanical anddielectric failure of BaTiO3 ceramics. J Mater Sci 1989, 24:698–702.Kishimoto A, Koumoto K, Yanagida H. Comparison ofmechanical and dielectric strength distributions forvariously surface-finished titanium dioxide ceramics. J AmCeram Soc 1989, 72: 1373–1376.Young AL, Hilmas GE, Zhang SC, et al. Mechanical vs.electrical failure mechanisms in high voltage, high energydensity multilayer ceramic capacitors. J Mater Sci 2007, 42:5613–5619.Malec D, Bley V, Talbi F, et al. Contribution to theunderstanding of the relationship between mechanical anddielectric strengths of alumina. J Eur Ceram Soc 2010, 30:3117–3123.Haddour L, Mesrati N, Goeuriot D, et al. Relationshipsbetween microstructure, mechanical and dielectricproperties of different alumina materials. J Eur Ceram Soc2009, 29: 2747–2756.Neusel C, Jelitto H, Schmidt D, et al. Thicknessdependence of the breakdown strength: Analysis of thedielectric and mechanical failure. J Eur Ceram Soc 2015,[17][18][19][20][21][22][23]35: 113–123.Hoshina T, Yamazaki M, Takeda H, et al. Dielectricbreakdown mechanism of perovskite-structured ceramics.Additional Conferences (Device Packaging, HiTEC,HiTEN, & CICMT) 2015, 2015: 000116–000120.Touzin M, Goeuriot D, Fitting HJ, et al. Relationshipsbetween dielectric breakdown resistance and chargetransport in alumina materials—Effects of the microstructure.J Eur Ceram Soc 2007, 27: 1193–1197.Liebault J, Vallayer J, Goeuriot D, et al. How the trappingof charges can explain the dielectric breakdownperformance of alumina ceramics. J Eur Ceram Soc 2001,21: 389–397.Suo Z. Models for breakdown-resistant dielectric andferroelectric ceramics. J Mech Phys Solids 1993, 41:1155–1176.Schneider GA. A Griffith type energy release rate model fordielectric breakdown under space charge limitedconductivity. J Mech Phys Solids 2013, 61: 78–90.Neusel C, Jelitto H, Schneider GA. Electrical conductionmechanism in bulk ceramic insulators at high voltages untildielectric breakdown. J Appl Phys 2015, 117: 154902.Neusel C, Schneider GA. Size-dependence of the dielectricbreakdown strength from nano- to millimeter scale. J MechPhys Solids 2014, 63: 2
Withstand voltage testwere performs ed by increasing the voltage by a defined ramp rate to a defined value. The voltage was held constant until breakthrough was detected. The withstand time at the voltage plateau was recorded. To study the influence of the voltage ramp rate on dielectric strength, short time tests with voltage ramp