Transcription
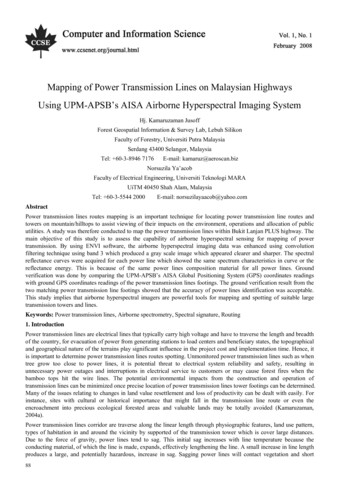
Vol. 1, No. 1Computer and Information ScienceMapping of Power Transmission Lines on Malaysian HighwaysUsing UPM-APSB’s AISA Airborne Hyperspectral Imaging SystemHj. Kamaruzaman JusoffForest Geospatial Information & Survey Lab, Lebuh SilikonFaculty of Forestry, Universiti Putra MalaysiaSerdang 43400 Selangor, MalaysiaTel: 60-3-8946 7176E-mail: kamaruz@aeroscan.bizNorsuzila Ya’acobFaculty of Electrical Engineering, Universiti Teknologi MARAUiTM 40450 Shah Alam, MalaysiaTel: 60-3-5544 2000E-mail: norsuzilayaacob@yahoo.comAbstractPower transmission lines routes mapping is an important technique for locating power transmission line routes andtowers on mountain/hilltops to assist viewing of their impacts on the environment, operations and allocation of publicutilities. A study was therefore conducted to map the power transmission lines within Bukit Lanjan PLUS highway. Themain objective of this study is to assess the capability of airborne hyperspectral sensing for mapping of powertransmission. By using ENVI software, the airborne hyperspectral imaging data was enhanced using convolutionfiltering technique using band 3 which produced a gray scale image which appeared clearer and sharper. The spectralreflectance curves were acquired for each power line which showed the same spectrum characteristics in curve or thereflectance energy. This is because of the same power lines composition material for all power lines. Groundverification was done by comparing the UPM-APSB’s AISA Global Positioning System (GPS) coordinates readingswith ground GPS coordinates readings of the power transmission lines footings. The ground verification result from thetwo matching power transmission line footings showed that the accuracy of power lines identification was acceptable.This study implies that airborne hyperspectral imagers are powerful tools for mapping and spotting of suitable largetransmission towers and lines.Keywords: Power transmission lines, Airborne spectrometry, Spectral signature, Routing1. IntroductionPower transmission lines are electrical lines that typically carry high voltage and have to traverse the length and breadthof the country, for evacuation of power from generating stations to load centers and beneficiary states, the topographicaland geographical nature of the terrains play significant influence in the project cost and implementation time. Hence, itis important to determine power transmission lines routes spotting. Unmonitored power transmission lines such as whentree grow too close to power lines, it is potential threat to electrical system reliability and safety, resulting inunnecessary power outages and interruptions in electrical service to customers or may cause forest fires when thebamboo tops hit the wire lines. The potential environmental impacts from the construction and operation oftransmission lines can be minimized once precise location of power transmission lines tower footings can be determined.Many of the issues relating to changes in land value resettlement and loss of productivity can be dealt with easily. Forinstance, sites with cultural or historical importance that might fall in the transmission line route or even theencroachment into precious ecological forested areas and valuable lands may be totally avoided (Kamaruzaman,2004a).Power transmission lines corridor are traverse along the linear length through physiographic features, land use pattern,types of habitation in and around the vicinity by supported of the transmission tower which is cover large distances.Due to the force of gravity, power lines tend to sag. This initial sag increases with line temperature because theconducting material, of which the line is made, expands, effectively lengthening the line. A small increase in line lengthproduces a large, and potentially hazardous, increase in sag. Sagging power lines will contact vegetation and short88
Computer and Information ScienceFebruary, 2008circuit. This causes power interruptions and forest fires. On the other hand, the suitable sites for new transmission lineshave been getting restricted, because of development of a rural areas and the growing concern over environmentalissues. Power transmission lines should avoid the main settlements but there is a possibility that they pass over somehouses scattered over the hill, grazing and pastureland and terrace farm this is cause by not well spotted during theplanning stage. In lieu of the above problems, an urgent need for a remote sensing data is important to aid the spottingof power transmission footings on relatively high spots such as over the hills maintaining similar height. In Malaysia,the only alternative remote sensing data source is the UPM-APSB’s AISA airborne hyperspectral imaging which carriesan optical sensor and proven to be useful for different applications (Kamaruzaman, 2004b, 2004c; and Kamaruzaman,2008).The general objective of this study is to assess the capability of airborne hyperspectral sensing for TNB powertransmission lines mapping and spotting in Bukit Lanjan, Selangor. Meanwhile, the specific objective is to preciselylocate and map the power transmission line route over the thick dense forested hills mountains and highway.2. Methods and materials2.1 Description of study areaThe study was conducted in Bukit Lanjan (Figure 1), situated in the state of Selangor and approximately 47 km fromKuala Lumpur’s capital city. It lies roughly between latitudes 3º10’40’’ and 3º11’02’’ North and longitudes 101º35’50’’and 101º36’26’’ East. Bukit Lanjan is almost in the midst of affluence Petaling Jaya, is the highest lone peak in theKlang Valley. There is a small patch of pristine tropical forest at the peak. The road in Bukit Lanjan is currently underthe maintenance of The North South Expressway (PLUS).2.2 Equipment and software2.2.1 Description of UPM-APSB’s AISA SensorUPM-APSB’s AISA is a solid-state, commercially produced inexpensive hyper spectral push-broom imaginginstrument to recording remote sensing images over a large spectrum wavelengths from the visible (VIS) to nearinfrared (NIR) which is 400-1000 nm. Images have a ground pixel size of 1 m x 1 m with a flight altitude of 1,000 ma.s.l and a constant flight speed of 120 knots (Kamaruzaman, 2004a). It is designed to provide a near real-time, frequent,repetitive, accurate and reliable push-broom instrument that acquire images in 288 registered, contiguous narrowspectral band passes such that for each element it is possible to derive a complete reflectance spectrum. TheUPM-APSB’s AISA hyperspectral imager is a complete system that consists of a compact hyperspectral imager head,miniature Global Positioning System (GPS)/Integrated Navigation System (INS) sensor for precise positioning, dataacquisition unit and CaliGeo pre-processing software. This small portable instrument, with a total weight of only 15 kgwas mounted on an aluminium metal plate that is compatible with a standard aerial camera mount, available in anyfixed wing aircrafts such as that of a Pan Malaysia Air Transport (PMAT) Short SkyVan SC7, a Sabah Air GAF NomadN22B or a RMAF C402B. Swath width is 360 pixels and field of view (FOV) in cross track direction 20 which makesground resolution from 1 km altitude approximately 1 m at a flight speed 120 knots (60 m/s).The versatile graphical user interface (GUI) provides flexible, easy-to-use instrument with several efficient operatingmodes and features that may be changed during flight within seconds. The data is stored as a default to a large capacityhard disk, which is providing higher frame rates compared to traditional tape storage based systems. The refractiveproperties of the two opposing prisms allow for a linear projection of light onto the charged coupled device (CCD) array.The two-dimensional array consists of a spatial axis of 364 detectors, and a spectral axis of 286 detectors. TheUPM-APSB’s AISA sensor system with 20 pixels per swath for downwelling irradiance system was acquired via a fiberoptic irradiance sensor (FODIS) on the N22B aircraft. The FODIS allows for the concurrent measurement ofdownwelling and upwelling radiance by the UPM-APSB’s AISA sensor head. The calibration of the FODIS coupledwith the UPM-APSB’s AISA sensor allows for the calculation of apparent at-platform reflectance. Normally,downwelling irradiance system is needed so that the upwelling and downwelling measurements can be compareddirectly (Figure 1).UPM-APSB’s AISA is capable of collecting data within a spectral range of 430 to 900 nm. Although UPM-APSB’sAISA is capable of collecting up to 286 spectral channels within this range, the data rate associated with the shortintegration times (sampling rates) required of the sensor in most operational/flight modes, limits the number of channels.Spectral resolution is important for detecting fine spectral features that can identify specific materials. The full spectralmode, however, is useful for acquiring 286 band spectral signatures of specific targets that can be used to generate pureend members as well as for band selection purposes. Current operational collection configurations range from 10 to 70spectral bands depending on the aircraft speed, altitude and mission goals. Table 1 shows the spectral and spatialresolutions achievable when holding ground speed constant, in this case 120 Knots (Table 1).89
Vol. 1, No. 1Computer and Information Science2.2.2 Softwares: The Caligeo and ENVI Version 4.0CaliGeo is a software package designed to process raw UPM-APSB’s AISA sensor data quickly and accurately to aformat that can be read using a data analysis package and analyzed using the latest data processing and analysismethods into the final data products. The process follows few simple steps that included radiometric correction,geometric correction, rectification and geo-referencing. After these steps were completed, the data were visualized on auser-friendly interface that runs interactively. This means that the data can be viewed without a need to transfer data andlarge files from one program to another reducing the amount of inconvenience for the user. Most of the processing isrelatively straightforward and automatic, and the graphical user interface (GUI) makes it easy for any one to learn andto use. After CaliGeo processing the data was then analyzed using ENVI.ENVI software version 4.0 which is a unique approach and user friendly to search for images spectral signatures, inaddition to the geospatial capabilities, which result in an effective identification, visualization, spatial and spectral datareduction and management tool with integrated decision-making capabilities. ENVI is used to find hidden targets(including sub-pixel targets), identify terrain features, visualize 3D terrain, and perform line-of-sight analysis. ENVI isalso the undisputed leader in hyperspectral image analysis, providing the only environment capable of fully utilizing thefeature identification power of hyperspectral data. Easily ingest panchromatic, multispectral, hyperspectral, radar,elevation images, or vector GIS data.2.3 Airborne data acquisition and data pre-processingThe calibration flight by UPM’s FGISL/Aeroscan Precision (M) Sdn.Bhd. took place on 19 February 2004 in BukitLanjan using a SC-7 aircraft with flight altitude of 1,000 m a.s.l and 1m x 1m ground spatial resolution. Missionprofiles were planned using high-resolution digital maps of the operating area. The flight path lines (FPL) wereidentified using a specialized GPS software and 20 operational bands ranging between 438.8 nm to 894.1 nmwavelengths including visible light (red, green, blue) and near infrared were selected and configured. Data delivery oversome the selected Area of Interest (AOI’s) i.e Bukit Lanjan was accomplished within 24 hours of completion of dataacquisition.The UPM-APSB’s AISA imaging spectrometer was configured to measure 20 spectral bands. The data was firstpre-processed using a CaliGeo software (a plug in of the latest ENVI version 4.0) for a calibrated and provides for theautomatic geometric and radiometric correction, rectification, mosaicking, and calculation of radiance or apparentat-platform reflectance (FODIS ratio). The program uses the GPS and attitude information from the INS to perform thegeometric, geo-referencing and mosaicking operations. Automated batch processing provides for rapid turnaround timesfor data delivery.Geometric correction is an error on its image between the actual image coordinates and the ideal image coordinates. Thedistortions are in form of internal distortion resulting from the geometry of the sensor and external distortion due to thealtitude of the sensor or the shape of the object. Meanwhile, radiometric correction is to correct for the varying factorssuch as scene illumination, atmospheric conditions, viewing geometry and instrument response. Radiometric correctionalso detects and measures the radiant energy, either as separate wavelengths or integrated over a broad wavelength band,and the interaction of radiation with matter in such ways as absorption, reflectance and emission. All the three types ofradiometric correction i.e., radiometric correction due to sensor sensitivity, sun angle and topography, atmosphericcorrection due to absorption and scattering were corrected on-board the aircraft during image pre-processing using theCaligeo software.Rectification is the process by which the geometry of an image is made planimetric using GCP’s to transform thegeometry of an image, so that each pixel corresponds to a position in a real world coordinate system. However,UPM-APSB’s AISA sensor is unique in the sense that no GCP’s were required with the available GPS/INS uniton-board the aircraft to automatically calculate the position of the aircraft.2.4 Ground verificationGround data verification was conducted to determine the mapping accuracy and exact location of the powertransmission lines on the ground using a handheld differential GPS.2.5 Image processing and final outputThe UPM-APSB’s AISA data were processed digitally using a user friendly ENVI version 4.0 to develop the imagespectral signatures in addition to the geospatial capabilities, which result in an effective identification, visualization,spatial and spectral data reduction and management tool with integrated decision-making capabilities. The data weresubjected to the minimum noise fraction transformation, pixel purity index, n-dimension visualizer, identification;spectral angle mapper and mixture tuned matched filtering processing. The final output is the AeroMAPTM productthat shows the location and routing of power transmission lines tower footings which is useful for developing asystematic management of the distribution and position of power transmission lines.90
Computer and Information ScienceFebruary, 20083. Results and discussion3.1 Band Combination without Image EnhancementGenerally, there are 20 different bands in UPM-APSB’s AISA data that can be combined to produce false colorcomposite images. Figure 2 shows the pre-processed image of power transmission lines using band combination19-11-2 (RGB) without enhancement. From the raw image, there is no indication that the power transmission linesare detected.There are three sets of false color composites selected consisting of band combinations 3-3-3, 8-8-8 and 9-9-9. ContrastStretching and Quick Filter with band combinations was applied to adjust the color or gray scale range of a selectedimage. By applying this technique, the computer display's dynamic range can be filled and the selected contrast of theimage can be improved as shown in Figure 3. There are several default stretching options consisting of Linear 0–255,Linear 2%, Gaussian, Equalization, and Square Root. The image showing the power transmission lines routings andfootings in the gray scale appear sharper and clearer compared to the other band combinations.3.2 Spectral library profilesBy using the ENVI software, the image spectral reflectance curves for each power transmission lines were acquired(Figure 4). From the spectral library profiles, the spectral reflectance of each power lines shows a relatively highspectral signature profile which is between the frequency ranges of 450-900 nm. This is due to the aluminium materialused by the power transmission lines which has a shiny surface that reflects every visible and near infrared wavelengthrange (Baskar, 2000). (Figure 2, Figure 3, Figure 4).3.3 Ground truth/verificationThe ground verification was done by comparing the UPM-APSB’s AISA Differential GPS coordinates readings withthe handheld ground DGPS coordinates of power transmission lines footings. From the airborne hyperspectral data, thelocations of power transmission lines footings lies between latitudes 3º 10’ 57’’ and 3º 10’ 58’’ North and longitudes101º 36’ 4’’ and 101º 36’5’’ East. Meanwhile, the ground GPS readings for No. 1 footing is latitude 3º 10’ 57.4’’North and longitude 101º 36’ 04.9’’ East, No. 2 footing is latitude 3º 10’ 57.3’’ North and longitude 101º 36’04.3’’ East (Figure 5). The ground verification result from both power transmission lines footings show that theaccuracy is acceptable and was used to support the capability of airborne hyperspectral data in mapping powertransmission lines routing (Figure 5)4. Conclusions and recommendationFrom the study carried out on mapping of power transmission lines routing and spotting using UPM-APSB’s AISAsensor in Bukit Lanjan PLUS highway, the following conclusions can be derived from this study, namely (i) airbornehyperspectral imaging can locate and map the power transmission lines, and (ii) Image enhancement filtering usingconvolution technique with band 3 produced gray scale image was found to be the best technique for powertransmission lines mapping. UPM-APSB’s AISA hyperspectral imagery should be used for power transmission linesmapping over thick dense forested hills and highway.ReferencesBhaskar, S.D. (2000). Sub-pixel analysis of urban surface material: A case study of Perth, Western Australia. (StudentPrize Competition) 24rth-29th July, 2000 IEEE/IGARSS, Honolulu, USA.Kamaruzaman Jusoff, (2004a). AISA Airborne Hyperspectral Imaging for Highway Transportation Planning andManagement. Poster paper presented at International Seminar Geospatial 2004, Istana Hotel, Kuala Lumpur. 8p.Kamaruzaman Jusoff, (2004b). The Potential of Utilizing Hyperspectral Remotely Sensed Data Integrated CoastalManagement with Special Emphasis on Airborne Imaging Spectrometry. Invited paper presented the KUSTEM 3rdAnnual on Science, Sustainability & Management, 4-5 May, 2004, Primula Beach Resort, Kuala Terengganu. 6p.Kamaruzaman Jusoff, (2004c). AISA Airborne Hyperspectral Imaging for Precision Agriculture and Forestry. An oralpaper presented at 4th KUSTEM Annual Seminar Sustainability Science and Management Meeting Challenges inSustainability Agrotechnology, 2-3 May, 2004, Primula Beach Resort, Kuala Terengganu. 6p.Kamaruzaman Jusoff, (2008). Search and Rescue (SAR) Operations for the Missing Bell 206 Long Ranger. Helicopterin Sarawak, Malaysia Using UPM-APSB’s AISA Airborne Hyperspectral Imaging Data. An Int. J. Disaster Prevention& Management (In Press).91
Vol. 1, No. 1Computer and Information ScienceTable 1. Spectral and spatial resolutions with ground speed of 120 knotsAltitudeSpatial ResolutionNumbers of spectral bands1,000 m (3,280 ft)1.0 m201,500 m (4,920 ft)1.5 m262,000 m (6,560 ft)2.0 m342,500 m (8,200 ft)2.5 m553,000 m (9,840 ft)3.0 m584,000 m (13,120 ft)4.0 m70BukitDrawn NotFigure 1. A map of Peninsular Malaysia showing the location of the study site92
Computer and Information ScienceFebruary, 2008Figure 2. Pre-processed image band combination 19-11-2 (RGB) without enhancementFigure 3. Image enhancement and filtering using convolution technique93
Vol. 1, No. 1Computer and Information ScienceFigure 4. Image Spectral Signatures Developed and Definedfor Power Transmission lines Features in Bukit Lanjan PLUS HighwayFigure 5. Field DGPS Readings of Power Transmission Lines Footings94
the only alternative remote sensing data source is the UPM-APSB's AISA airborne hyperspectral imaging which carries an optical sensor and proven to be useful for different applications (Kamaruzaman, 2004b, 2004c; and Kamaruzaman, 2008). The general objective of this study is to assess the capability of airborne hyperspectral sensing for TNB power