Transcription
Field and Forage CropsJournal of Economic Entomology, 113(2), 2020, 800–807doi: 10.1093/jee/toz344Advance Access Publication Date: 27 December 2019ResearchKira L. Nagoshi,1,2 Sandra A. Allan,1,3 and Robert L. Meagher1,1Center for Medical, Agricultural, and Veterinary Entomology, USDA Agricultural Research Service, Gainesville, FL 32608,2BuchholzHigh School, Gainesville, FL 32606, and3Corresponding author, e-mail: sandy.allan@usda.govSubject Editor: Allan ShowlerReceived 11 September 2019; Editorial decision 2 December 2019AbstractThe fall armyworm (Spodoptera frugiperda) (J. E. Smith) (Lepidoptera: Noctuidae), a major agricultural pestin the Western Hemisphere, has recently become established in Africa and Asia. This highly polyphagous species has potential to economically harm multiple crops. Contributing to this host range are two fall armywormpopulations historically called ‘host strains’ that differ in host specificity. Understanding behaviors of the twostrains is crucial to effective management of this pest. A major difficulty in such studies is that strains havelong been considered morphologically indistinguishable, with molecular markers the only reliable means ofidentification. However, studies of fall armyworm in Colombia reported strain differences in wing morphologysufficiently large to potentially provide a more economical alternative method to determine strain. This studytested whether a similar phenotypic difference was present in Florida populations using geometric morphometric analysis of 15 anatomical landmarks on forewings of 182 specimens from three habitats associated withdifferent host plants. Principle component and linear discriminant analyses identified significant differences inwing size and shape in comparison of strains from different habitats, but not between strains within the samehabitat. Data indicate that apparent strain distinctions in wing phenotype are most likely a secondary consequence of differences in developmental growth patterns on different host plants combined with strain-biasedhost choice. Furthermore, Florida specimens showed much larger phenotypic overlap than observed for strainsfrom Colombia. Together these findings suggest that wing morphology is probably not a reliable indicator ofstrain identity in field populations where different host plants are available.Key words: Spodoptera frugiperda, geometric morphometrics, wings, host strains, pestSpodoptera frugiperda (J. E. Smith) (Lepidoptera: Noctuidae), commonly called fall armyworm, is native to the Western Hemispherewhere it is the primary insect pest of corn in the southeasternUnited States, the Caribbean, and South America (Andrews 1988).Populations were first detected in western Africa in 2016 (Goergenet al. 2016), followed by subsequent observations of substantial infestations throughout sub-Saharan Africa(Cock et al. 2017, FAO2017, du Plessis et al. 2018), India (Ganiger et al. 2018, Shyleshaet al. 2018, Swamy et al. 2018), and most recently southeastern Asia(Li et al. 2019). Economic damage in the Eastern Hemisphere has sofar been primarily in corn, Zea mays L. with costs estimated to be inthe billions USD (Stokstad 2017). The potential for losses in othercrops has yet to be determined but is expected to be significant giventhat fall armyworm is capable of feeding on over 80 plant species,periodically causing significant economic damage to rice, Oryza spp.;sorghum, Sorghum spp.; millet, Panicum spp.; soybean, Glycine max(L.) Merr.; wheat, Triticum spp.; alfalfa, Medicago sativa L.; cotton,Gossypium spp.; turf, and feed grass crops (Luginbill 1928). Thisbroad host range is in part due to the existence of two populationsthat differ in their distribution between host plants (Pashley 1986,Pashley and Martin 1987).The two groups were historically designated ‘host strains’ andhave long been considered morphologically indistinguishable. Howthey differ biologically remains uncertain. A variety of strain-specificcharacteristics are reported that include differences in female pheromone, mating behaviors, and developmental rates on different hostplants (Pashley and Martin 1987, Pashley 1988, Groot et al. 2008,Lima and McNeil 2009, Schöfl et al. 2009, Groot et al. 2010, RiosDiez and Saldamando-Benjumea 2011, Schöfl et al. 2011, Rios-Diezet al. 2012). However, fall armyworm exhibits substantial variabilitybetween geographical populations independent of strain differencesthat have made characterizing the two populations problematic (e.g.,Published by Oxford University Press on behalf of Entomological Society of America 2019.This work is written by (a) US Government employee(s) and is in the public domain in the US.800Downloaded from 2/800/5687876 by ESA Member Access user on 10 April 2020Assessing the Use of Wing Morphometrics to Identify FallArmyworm (Lepidoptera: Noctuidae) Host Strains in FieldCollections
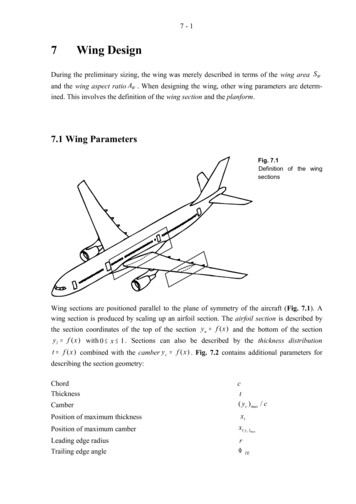
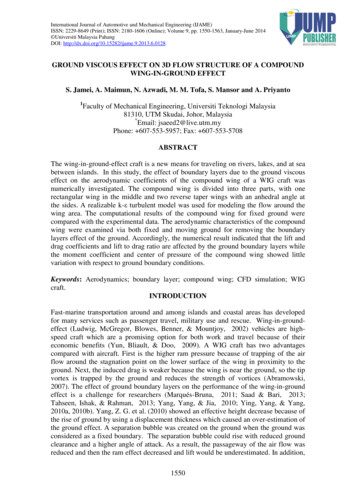
Journal of Economic Entomology, 2020, Vol. 113, No. 2In the present study, pheromone trap collections were madefrom three habitats in Florida that differed in the predominant hostplant present and in strain composition of the fall armyworm infestation. This made possible comparisons of wing morphology betweenstrains collected from different habitats or within the same habitat.The methodology was designed for direct testing of molecular identification of strain for each individual wing against wings from fieldspecimens without intervening artificial. The results were used to testwhether the wing differences observed in Colombia are also presentin Florida populations, and the degree to which the wing phenotypewas dependent on habitat as opposed to strain identity.Materials and MethodsFall Armyworm CollectionAdult male fall armyworms were collected from pheromone traps atthree locations representing distinct habitats based on the majorityhost plant species present (Fig. 1). Collections were made in Mayand June 2019 in cornfields in Manatee County, FL (29.3179 N,82.8210 W), in pasture areas from December 2018 to June 2019in Hardee County, FL (27.4820 N, 81.9190 W), and in peanutfields from August to October, 2009 in Levy County, FL (29.3875 N, 82.4468 W). The pasture and corn dominated areas were approximately 50 km apart, while the peanut site is located about 200km to the north. These habitats should be considered complex asother plant species are present that could contribute as hosts, thoughour expectation is that most of the collection will have arisen fromthe indicated predominant plant type. Fall armyworms from all threelocations were presumed to have annually migrated from the sameoverwintering population in southern Florida and are expected to begenetically similar (Nagoshi et al. 2008b).Trap collections were performed using Universal moth traps(Great Lakes IPM, Vestaburg, MI) that were either a standardFig. 1. Map of collection sites used in this study. Circled area approximateswhere fall armyworm populations are consistently found during the winterseason.Downloaded from 2/800/5687876 by ESA Member Access user on 10 April 2020see Unbehend et al. 2014). Productive mating between the strainscan occur as observed in the laboratory and suggested by geneticstudies in the field, but is more restrictive and less frequent thanmating within a strain (Pashley and Martin 1987, Schöfl et al. 2009,Groot et al. 2010, Nagoshi 2010, Schöfl et al. 2011, Kost et al. 2016,Nagoshi et al. 2017a).The strains were originally identified by genetic marker differences between larval specimens collected from rice and corn plants,which gave rise to the designation ‘rice-strain’ and ‘corn-strain’(Pashley et al. 1987). Subsequent studies showed the rice-strain hadvariable specificity to rice (Juárez et al. 2012, Murúa et al. 2015).Because the description of host plant specificity continues to evolveand the rice-strain designation is potentially inaccurate, we will herewith refer to the two subpopulations as the C-strain and R-strain.Field studies have demonstrated that the C-strain is preferentiallyfound in corn, sorghum, and cotton while the R-strain predominatesin pastures and millet (Pashley et al. 1987, Nagoshi et al. 2007b,Juárez et al. 2012, Murúa et al. 2015). Other crops, such as peanuts,Arachis spp., are only sporadically infested by fall armyworm andthe preference of the two strains to such hosts have generally, notbeen described. Genetic markers remain the most consistent determinant of strain identity. The best characterized markers are singlebase substitutions found as haplotypes, with those most useful forour studies derived from portions of the mitochondrial Cytochromeoxidase sSubunit I gene (COI) (Levy et al. 2002) and the nuclear Triosephosphate isomerase gene (Tpi) (Nagoshi et al. 2006a,Nagoshi 2010).Host plant preference is the most consistent behavioral phenotype distinguishing the two strains with the correspondence between markers and host plant observed throughout the WesternHemisphere (Nagoshi and Meagher 2004a,b; Nagoshi 2010). Yeteven here the correspondence is not absolute, with on averageabout 20% of larvae from corn expressing R-strain markers andsporadic observations of more substantial divergence from expectations in field surveys (Nagoshi and Meagher 2004a, Prowell et al.2004,Nagoshi, 2010 #1052, Juárez et al. 2014). This lack of correspondence suggests either inaccuracy in the markers or plasticity inhost plant choice. Despite this variability, the association of the COI(and Tpi) markers with host strains has been sufficiently robust todemonstrate marker-defined differences in female pheromone constitution, mating behavior, and mating compatibility between strains(Schöfl et al. 2009, Schöfl et al. 2011, Unbehend et al. 2013, Kostet al. 2016).Studies of fall armyworm in Colombia have reported the firstindication of anatomical differences between the strains. CañasHoyos et al. (2014, 2016) described strain differences in wing sizeand shape that were detected using geometric morphometric analysis (Cañas-Hoyos et al. 2014, 2016). In addition to potentiallyproviding a nonmolecular means of strain identification, differencesin wing morphology could impact flight performance and therebymigratory capability. If such differences are significant, then thestrains would need to be analyzed differently when modeling migration and projecting the risk of fall armyworm infestations. However,such considerations first require establishing that strain differencesin wing morphology are a general characteristic of the species ratherthan a regional variation specific to Colombian populations. Geneticvariability between geographically distant populations has previously complicated identification of strain-specific traits (Unbehendet al. 2014). In addition, examining the degree to which the wingphenotypic differences are independent of strain biases in habitatchoice has implications for the accuracy of strain identification bywing morphometrics and its biological relevance.801
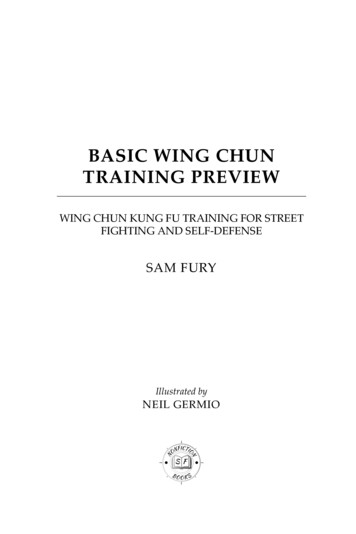
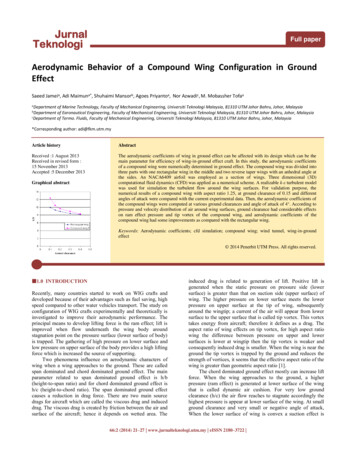
802Wing Morphology AnalysisLeft wings were obtained from 182 wild-caught specimens (n 60from cornfields, n 55 from pasture areas, n 67 from peanutfields). To remove both wing scales and pigment and make landmarks clear, wings were soaked in sodium hypochlorite (5.25%) andbrushed with a camel hair brush. Wings were then rinsed in water andmounted in Mirsky’s Fixative (National diagnostics, Atlanta, GA)on the slide with the cover slip sealed using clear fingernail polish.Wing digital images were recorded using a digital microscope (VHX5000, Keyence, Osaka, Japan). For each wing, a set of 15 anatomical landmarks (Fig. 2) previously described by Cañas-Hoyos et al.(2016) were digitized as x- and y-coordinates in a Cartesian spaceusing ImageJ software (NIH, Bethesda, MD) in conjunction with theplugin Point Picker (http://bigwww.epfl.ch/thevenaz/pointpicker/).Raw coordinates were converted to .txt file format and importedinto MorphoJ v1.07a (Klingenberg 2011), which was used for allsubsequent analyses. A full generalized Procrustes fit, or superimposition, was performed on the raw coordinates, which eliminatednonshape variables from the dataset (Rohlf and Slice 1990).Wing size comparisons were made using centroid size, which isa unit-less metric defined as the square root of the sum of squaresof the distances of each landmark to the centroid/center of all landmarks (Zelditch et al. 2012). Centroid size was calculated for eachwing and groups were compared by ANOVA and Tukey tests ort-tests. Variations in wing shape were compared by linear discriminant function analysis performed on subsets of the Procrustestransformed coordinates. The degree of dissimilarity was estimatedby Mahalanobis distances through a permutation test with 10,000randomizations. Pairwise shape comparisons were tested for significance using Hotelling’s T2 distribution, which characterizes the differences between multivariate means of the two groups. The resultswere visualized through histograms showing the number and type ofindividuals relative to the Procrustes-derived shape classes (x-axis).To assess allometry, multivariate regression analysis was performedusing the Procrustes shape coordinates as the dependent variablesand centroid size as the independent variables, followed by permutation tests (10,000 randomizations) against the null hypothesis ofindependence between wing shape and size to determine statisticalsignificance.DNA Preparation and PCR AmplificationDNA was prepared using a simplified modification of previousmethods (Nagoshi et al. 2008a). Individual carcasses were homogenized in a 5-ml Potter Homogenizer (Bellco Glass, Inc, Vineland, NJ)in 800 µl cell lysis buffer (0.2 M sucrose, 0.1 M Tris–HCl at pH 8.0,0.05 M EDTA, and 0.5% sodium dodecyl sulfate), transferred to a2.0-ml microcentrifuge tube and incubated at 55 C for 1 h. Debriswas pelleted by centrifugation at 14,000 rpm (about 9,000 g) for5 min. at room temperature. The supernatant was transferred to aZymo-Spin III column (Zymo Research, Orange, CA) and processedaccording to manufacturer’s instructions. The DNA preparation wasincreased to a final volume of 200 µl with distilled water. GenomicDNA preparations of fall armyworm samples were stored at 20 Cand analyzed as needed.PCR amplification of the mitochondrial COI gene was performedin a 30 µl reaction mix containing 3 µl 10X manufacturer’s reactionbuffer, 0.5 µl 10mM dNTP, 0.5 µl 20 µM primer mix, 1–2 µl DNAtemplate (between 0.05 and 0.5 µg), 0.5 unit Taq DNA polymerase(New England Biolabs, Beverly, MA). The thermocycling programwas 94 C (1 min), followed by 30 cycles of 92 C (30 s), 56 C (45 s),72 C (45 s), and a final segment of 72 C for 3 min. Typically 96PCR amplifications were performed at the same time using either0.2-ml tube strips or 96-well microtiter plates. Amplification ofthe COI region used the primer pair COI-891F (5′-TACACGAGCATATTTTACATC-3′) and COI-1303R (5′-CAGGATAGTCAGAATATCGACG-3′) to produce a 410-bp fragment. Amplificationof the Tpi exon–intron segment used the primers Tpi412F (5′CCGGACTGAAGGTTATCGCTTG -3′) and Tpi1140R (5′GCGGAAGCATTCGCTGACAACC-3′) to produce a variable lengthfragment due to insertion and deletion mutations. It was sometimesnecessary to use nested PCR to obtain the Tpi amplified fragment. InFig. 2. Diagram of wing landmarks used for the geometric morphometric analysis. The landmarks are as described in Cañas-Hoyos et al. (2014, 2016).Downloaded from 2/800/5687876 by ESA Member Access user on 10 April 2020configuration (green top, yellow funnel, white bucket) or entirelygreen (Meagher 2001). These were baited with a commercially available fall armyworm pheromone (Scentry Biologicals, Inc., Billings,MT and Trécé, Inc., Adair, OK). Each trap contained insecticide strips containing 10% 2,2-dichlorovinyl dimethyl phosphate(Hercon Environmental, Emigsville, PA) to kill moths. Collectionswere made using 3–4 traps per site. The collected specimens wereidentified as fall armyworm based on morphological criteria andstored at 20 C before subsequent analysis.The collections were screened for specimens with intact leftwings. These wings were detached and used for the morphometricanalysis while the carcass was stored in 80% ethanol prior to DNAprocessing and strain identification. Specimens were labeled so thatthe wing and strain identification could be matched.Journal of Economic Entomology, 2020, Vol. 113, No. 2
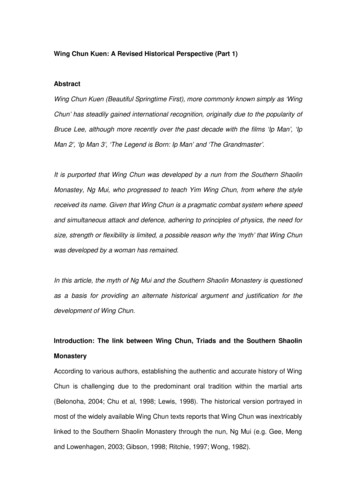
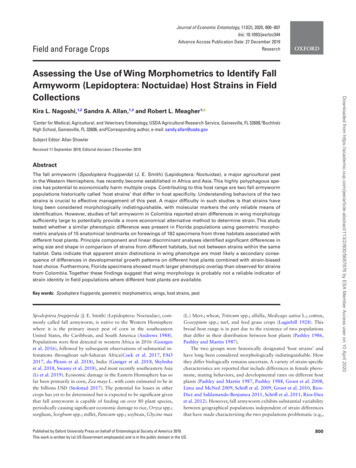
Journal of Economic Entomology, 2020, Vol. 113, No. 2this case, the first PCR was performed with the primers Tpi634F andTpi780R. The reaction mix was then diluted with the addition of100 µl of water and 1 µl of this mix was used in the second PCR withprimers Tpi412F and Tpi1140R. Primers were synthesized commercially (Integrated DNA Technologies, Coralville, IA).Strain Identification and DNA Sequence Analysispresent in one copy in females and two copies in males. Since malescan be heterozygous for Tpi, there is the potential for the simultaneous display of both alternative nucleotides at gTpi183Y (denoted asTpiH), which would be indicated by an overlapping C and T DNAsequence chromatograph (Nagoshi et al. 2017a). These were foundin about 10% of the specimens and were not included in the Tpistrain data. Useable Tpi sequence was obtained from 159 specimens.DNA alignments and consensus building were performed usingMUSCLE (multiple sequence comparison by log-expectation), apublic domain multiple alignment software incorporated into theGeneious Pro 10.1.2 program (Biomatters, New Zealand, http://www.geneious.com) (Kearse et al. 2012). Generation of graphswas done using Excel and PowerPoint (Microsoft, Redmond, WA).Other statistical analyses including t-tests and χ 2 were performedusing GraphPad Prism version 6.00 for Mac (GraphPad Software,La Jolla, CA).ResultsDistribution of COI and Tpi Strain DiagnosticMarkers in Field CollectionsIn total, 182 specimens were characterized for strain identityusing the mitochondrial COI marker diagnostic of strain identity(Fig. 3A). The expected biased distribution associated with the hoststrains was observed for these collections with COI-CS (the C-strainmarker) predominating in the corn habitat while COI-RS (R-strain)was the majority haplotype in the pasture collections. Both strainswere present in near equal proportions in the peanut habitat. As anadditional test, we examined a subset of the specimens with the Tpistrain marker. The results were similar to that found with COI as theC-strain marker (TpiC) predominated in corn, the R-strain marker(TpiR) was the majority in pasture, and both markers were equallypresent in peanut (Fig. 3B). Overall, these observations demonstratethat the two strains as defined by COI markers are present in thecollections and were behaving as expected. Furthermore, there is noevidence that either strain exhibited preference for peanuts and thesubstantial presence of both strains in this collection provides an opportunity to test for phenotypic differences between strains capturedin the same habitat (peanut), thereby minimizing geographical andhost plant effects.Fig. 3. Bar graphs showing frequency of COI and Tpi strain diagnostic haplotypes in different habitats. (A) COI analysis. (B) A subset of specimens analyzed forCOI were retested with Tpi. Comparisons were tested by χ 2 analysis.Downloaded from 2/800/5687876 by ESA Member Access user on 10 April 2020A total of 192 specimens from the field collections, including all 182specimens examined for wing morphology, were analyzed for strainidentity by restriction fragment length polymorphism (RFLP) analysis. Within the 434-bp COI segment amplified by COI-891F/COI1303R is an EcoRV site present only in the COI-RS group thatproduces two fragments of 290 bp and 144 bp (Nagoshi et al.2008b). Five microliters of the COI PCR reaction was digested with5 units of the restriction enzyme EcoRV (New England Biolabs,Beverly, MA) in a 20 µl of 1X manufacturer recommended restriction enzyme buffer. For each reaction, 5 µl of 6X gel loading bufferwas added and the entire sample run on a 1.8% agarose horizontalgel containing GelGreen (at one-third the concentration recommended by manufacturer’s instructions, Biotium, Hayward, CA) in0.5 Tris–borate buffer (TBE, 45 mM Tris base, 45 mM boric acid,1 mM EDTA pH 8.0). Fragments were visualized on a blue-light box.A subset of 160 specimens was further analyzed by DNAsequencing of the COIB segment to confirm species and strain identity. In these cases, the PCR fragments visualized during the RFLPanalysis were cut out of the gel and DNA isolation was performedusing Zymo-Spin I columns (Zymo Research, Orange, CA) according to manufacturer’s instructions. The isolated fragments wereanalyzed by DNA Sanger sequencing (Genewiz, South Plainfield,NJ). Strain identification was confirmed by identifying straindiagnostic polymorphisms in the amplified region (Nagoshi et al.2006b, Nagoshi et al. 2007a).The field collections were also tested for strain identificationusing the Tpi markers as described previously (Nagoshi et al. 2019).Polymorphisms in the fourth exon of the Tpi protein-coding regionidentify host strain with results generally comparable with the COImarker (Nagoshi 2010). Site gTpi183Y located 183 bp from the 5′splice site of the fourth exon is diagnostic, with the C-strain allele(TpiC) indicated by a C and the R-strain (TpiR) by a T (Nagoshi2010). The Tpi gene is located on the Z sex chromosome that is803
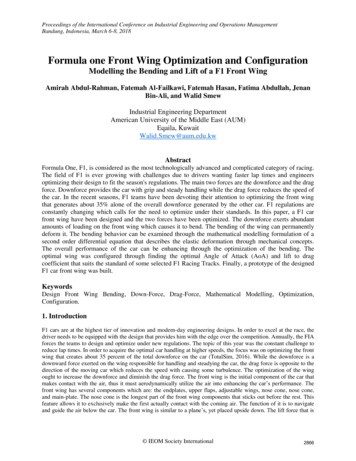
804Comparisons of Wing Size by Habitat and StrainComparisons of Wing Shape by Habitat and StrainPairwise comparisons of wing shape between the various groups performed by linear discriminant analysis of shape variables obtainedfrom the full Procrustes fit algorithm detected significant differences(Fig. 5). The Hotelling’s T2 test based on Mahalanobis distancesrevealed statistically significant differences between all pairwiseshape comparisons between habitats (Fig. 5A–C), including cornversus peanut where no significant differences were found betweentheir mean centroid sizes (Fig. 4A). When specimens from all threehabitats were pooled a significant difference was found betweenstrains, COI-CS versus COI-RS (Fig. 5D). However, when the COIcomparison was limited to the peanut collection, the shape difference between strains was not statistically significant (Fig. 5E).Multivariate regression analysis revealed that wing size explained1.9% of wing shape variation with a P-value of 0.002, indicatinga statistically significant but relatively minor dependence of wingshape on size.DiscussionStudies of fall armyworm populations from central Colombia reported evidence from wing morphometric studies of strain differences in both wing size and shape that were of sufficient magnitudethat they could potentially substitute for the genetic markers currently used to identify strains (Cañas-Hoyos et al. 2014, 2016).A method of strain identification that did not require molecularanalysis could provide more timely and affordable characterizationof fall armyworm infestations, a particular benefit in the EasternHemisphere where fall armyworm is newly arrived and a target ofenhanced monitoring.The present study demonstrated that wing differences in size andshape can be found between populations of wild fall armyworm inFlorida, which are almost certainly isolated from those in Colombia(Nagoshi et al. 2017b), indicating this is likely to be a general characteristic of the species. However, our data indicate substantialoverlap in the wing phenotypes between strains that was muchlarger than that observed in the Colombia studies, suggesting that inFlorida populations the strain differences in wing morphology are asecondary consequence of host plant preference combined with differences between fall armyworm growth patterns on different hosts.When both habitat and strain are taken into account, significant differences between C-strain wings were only found in comparisonswith R-strain from the pasture collection, while no significant differences were found in strain comparisons between the corn and peanutcollections or between the two strains in the peanut collection. Thissuggests that pasture grasses give rise to fall armyworms with alteredwing size relative to those that developed on corn and peanut hostsregardless of strain identity. It, therefore, appears that host plant species, rather than strain identity, is strongly associated with wing sizedifferences in the Florida field collections.Fig. 4. Bar graphs of mean centroid sizes for groups defined by COI strain, habitat, or both. The mean standard error of the mean is shown above each bar. Foreach figure means with the same letter are not significantly different. Analysis for (A) and (C) was done by one-way ANOVA and Tukey’s multiple comparisontest, while (B) used a two-tailed t-test.Downloaded from 2/800/5687876 by ESA Member Access user on 10 April 2020Centroid size (Klingenberg 2016) for each specimen was calculatedbased on the same 15 forewing landmarks previously used to demonstrate strain differences in wing morphology (Cañas-Hoyos et al.2014, 2016) (Fig. 4). Statistically significant differences were foundin comparisons between collections from the corn and pasture sitesand as well as between the pasture and peanut collections, but notbetween corn and peanut (Fig. 4A). Using the same data set we alsocompared the centroid sizes between COI groups from all habitats.The mean for the COI-CS group was significantly higher than thatof COI-RS specimens (Fig. 4B).To assess the relative importance of habitat and strain, comparisons were made using the same data set but now grouped byboth factors. There were four groups with sufficient sample size (n 30) for comparisons, COI-CS from corn, COI-RS from pasture, andboth COI types from peanuts, with the latter providing an opportunity to compare strains arising from the same habitat. The COI-RSfrom pasture group had the lowest mean centroid size, which wassignificantly different from the same strain COI-RS specimens frompeanut, as well as the different strain COI-CS from corn and peanutgroups (Fig. 4C). Further evidence for the influence of habitat wasthe observation that the COI-RS from peanut group was not significantly different in wing size from the COI-CS specimens fromeither peanut or corn despite the strain differences. These results indicate that it is habitat, or more specifically the host plant, ratherthan strain that is the primary determinant of wing size differencesin the field collections.Journal of Economic Entomology, 2020, Vol. 113, No. 2
Journal of Economic Entomology, 2020, Vol. 113, No. 2805Downloaded from 2/800/5687876 by ESA Member Access user on 10 April 2020Fig. 5. Results of linear discriminant analysis displayed as histograms. The x-axis denotes the vectors created by linear discriminant analysis based on thevariables used and their importance in defining category differences. The y-axis represents the proportion of each vector in a given category.Comparisons of wing morphology by linear discriminant analysis supported this conclusion. Statistically significant differences inwing shape were found in all comparisons of moths collected fromdifferent plant hosts. However, because the collections also differ instrain composition, these comparisons cannot differentiate betweenhost plant and strain identity as the primary determinant of the
806AcknowledgmentsWe thank Dr. J. M. G. Thomas for technical assistance in preparingthe specimens and Dr. R. Nagoshi for technical assistance and contributions to the manuscript. We thank Dr. R. Mankin and Dr.S. Valles for suggestions for the manuscript. The use of trade, firm,or corporation names in this publication is for the informationand convenience of the reader. Such use does not constitute an official endorsement or approval by the United States Department ofAgriculture or the Agricultural Research Service of any product orservice to the exclusion of others that may be suitable.References CitedAndrews, K. L. 1988. Latin-American research on Spodoptera frugiperda(Lepidoptera, Noctuidae). Fl. Entomol. 71: 630–653.Cañas-Hoyos, N., E. J. Marquez, and C. I. Saldamando-Benjumea. 2014.Differentiation of Spodoptera frugiperda (Lepidoptera: Noctuidae) cornand rice strains from central Colombia: a wing morphometric approach.Ann. Entomol. Soc. Am. 107: 575–581.Cañas-Hoyos, N., E. J. Márquez, and C. I. Saldamando-Benjumea. 2016.Heritability of wing size and shape of the rice and corn strains ofSpodoptera frugiperda (J.E. Smith) (Lepidoptera: Noctuidae). Neotrop.Entomol. 45: 411–419.Cock, M. J. W., P. K. Beseh, A. G. Buddie, G. Cafa, and J. Crozier. 2017.Molecular methods to detect Spodoptera frugiperda in Ghana, and implications for monitoring the spread of invasive species in developing countries. Sci. Rep. 7: 1–10.FAO. 2017. Briefing Note on FAO Actions on Fall Armyworm in Africa, 1October 2017. In Food and Agriculture Organization of the UnitedNations (ed.), FAO Briefing Note on FAW. United Nations, Rome, Italy.Ganiger, P. C., H. M. Yeshwanth, K. Muralimohan, N. Vinay, A. R. V. Kumar,and K. Chandrashekara. 2018. Occurrence of the new invasive pest, fallarmyworm, Spodoptera frugiperda (J.E. Smith) (Lepidoptera: Noctuidae),in the maize fields of Karnataka, India. Curr. Sci. 115: 621–623.Goergen, G., P. L. Kumar, S. B. Sankung, A. Togola, and M. Tamo. 2016.First report of outbreaks of the fall armyworm Spodoptera frugiperda (J.E.Smith) (Lepidoptera, Noctuidae), a new alien invasive pest in West andCentral Africa. PLoS One 11. doi:10.1371/journal.pone.0165632.Groot, A. T., M. Marr, D. G. Heckel, and G. Schofl. 2010. The roles andinteractions of reproduct
Wing digital images were recorded using a digital microscope (VHX-5000, Keyence, Osaka, Japan). For each wing, a set of 15 anatom-ical landmarks (Fig. 2) previously described by Cañas-Hoyos et al. (2016) were digitized as x- and y-coordinates in a Cartesian space using ImageJ software (NIH, Bethesda, MD) in conjunction with the