Transcription
doi: 10.1111/age.12731Genome-wide differential DNA methylation in tropically adaptedCreole cattle and their Iberian ancestorsN. Sevane*, R. Mart ınez† and M. W. Bruford*‡ n Colombiana De Investigacio n Agropecuaria*School of Biosciences, Cardiff University, Cathays Park, Cardiff, CF10 3AX, UK. †Corporacio(Corpoica), Centro de Investigaciones Tibaitat a, km 14 via Bogot a, 250047 Mosquera, Colombia. ‡Sustainable Places Research Institute,Cardiff University, Cardiff, CF10 3BA, UK.SummaryEnhancing climate resilience and sustainable production for animals in harsh environmentsare important goals for the livestock industry given the predicted impacts of climate change.Rapid adaptation to extreme climatic conditions has already been imposed on livestockspecies, including those exported after Columbus’s arrival in the Americas. We compared themethylomes of two Creole cattle breeds living in tropical environments with their putativeSpanish ancestors to understand the epigenetic mechanisms underlying rapid adaptation ofa domestic species to a new and more physiologically challenging environment. Reducedrepresentation bisulfite sequencing was used to assess differences in methylation in Creoleand Spanish samples and revealed 334 differentially methylated regions using highstringency parameters (P-value 0.01, 4 CpGs within a distance of 200 bp, meanmethylation difference 25%) annotated to 263 unique features. Gene ontology analysisrevealed candidate genes involved in tropical adaptation processes, including genesdifferentially hyper- or hypomethylated above 80% in Creole samples displaying biologicalfunctions related to immune response (IRF6, PTGDR, FAM19A5, PGLYRP1), nervoussystem (GBX2, NKX2-8, RPGR), energy management (BTD), heat resistance (CYB561) andskin and coat attributes (LGR6). Our results entail that major environmental changesimposed on Creole cattle have had an impact on their methylomes measurable today, whichaffects genes implicated in important pathways for adaptation. Although further work isneeded, this first characterization of methylation patterns driven by profound environmentalchange provides a valuable pointer for the identification of biomarkers of resilience forimproved cattle performance and welfare under predicted climatic change models.Keywords Bos taurus, Criollo, epigenomics, livestock, reduced-representation bisulfitesequencingIntroductionAssessment of climate change impacts predicts a progressiveupward trend in average temperatures over the comingcentury with climatic fluctuations that may lead to asimplification of vegetation, a decrease in forage productionand quality, and changes in organismal life cycles (Ciscaret al. 2014). For animal health, the distribution and extentof parasitic and infectious disease may increase, as naturalcontrol via low winter temperatures will be reduced. Thisincreased disease risk and the adverse effects of extremehumidity on health may also affect temperate regions,Address for correspondenceN. Sevane, School of Biosciences, Cardiff University, Cathays Park,Cardiff, CF10 3AX, UK.E-mails: nsevane@ucm.es; sevane-fernandezn@cardiff.ac.ukAccepted for publication 28 August 2018 2018 Stichting International Foundation for Animal Genetics, 50, 15–26where rainfall is predicted to increase. Moreover, stressgenerated by adaptation to changing conditions coupledwith temperature increase may compromise immuneresponses to pathogens and external challenges and maylead to reduction in food intake, growth, milk yield andreproductive efficiency (Hahn 1999), jeopardizing animalwelfare. Thus, improving climate resilience and enhancingsustainable production are important goals for the livestockindustry. However, classical breeding programs may notprovide efficient medium- to long-term strategies equippedto counter the expected pace of climate change. Relying onshort-term responses coupled with the ability to conveyheritable phenotypic plasticity to future generations (Weyrich et al. 2016) could provide a better alternative for facingthis imminent challenge.Events in human history have included episodes whenrapid adaptation to extreme climatic conditions has beenimposed on a limited number of domestic animals. One15
16Sevane et al.example of such an event is Columbus’s arrival in theAmericas. Livestock species were brought from the IberianPeninsula to the Americas on Columbus’s second journey in1493 (Rodero et al. 1992) and spread throughout thecontinent, adapting to a wide range of alien environmentalconditions and giving rise to ‘Creole’ animal populations(Rouse 1997). The total number of Iberian cattle brought tothe Americas is estimated to have been less than 1000(Rodero et al. 1992). After nearly 300 years of Creole cattleexpansion, several other European breeds were introducedand crossed with local populations (Willham 1982) as wellas with Indian Zebu cattle, especially in tropical areas(Santiago 1978). Creole cattle were subsequently displacedinto marginal, demanding environmental areas where theystill exist. Examples include the Coste no con Cuernos andSan Martinero breeds of Colombia, which descend fromSpanish cattle and also have minor influences from continental and/or zebu breeds (Mart ınez et al. 2012; Ginja et al.2013). These breeds are therefore the product of severalcenturies of adaptation to new, local and challengingenvironments. The Coste no con Cuernos breed, whichtolerates high temperatures and humidity, was developedin Caribbean Colombia and is found from the swamp areasof C ordoba and Magdalena to the dry savannah of Sucreand Bol ıvar (Pinz on 1984). The San Martinero wasdeveloped in the Colombian Orinoquia region in the 17thcentury and is almost uniquely adapted to tropical rainforests (Holdrige & Hunter 1961).A central goal of evolutionary biology, and an increasingly relevant one to agriculture, is to elucidate the geneticarchitecture of adaptation. The past decade has yielded anincreasing number of examples for which regulatorychanges have been shown to contribute to species-specificadaptations and to reproductive isolation (Blekhman et al.2008). There is mounting evidence that heritable variationin relevant traits can be generated through a suite ofepigenetic mechanisms, even in the absence of geneticvariation, which eventually might promote permanentchanges in DNA sequence (Varriale 2014; Fagny et al.2015). Among epigenetic mechanisms, DNA methylationvia 5-methylcytosine is a key modification in vertebrategenomes that imparts an additional layer of heritableregulatory information upon DNA and is essential forviability in a myriad of biological processes (Lister & Ecker2009).Epigenomic studies in cattle include muscle and placentaltissues analysed with non-base-resolution methods (Huanget al. 2014; Su et al. 2014) and two recent studies usingbase-resolution techniques, a low-coverage whole-genomebisulfite sequencing analysis of bovine placenta (Schroederet al. 2015) and reduced-representation bisulfite sequencing(RRBS) of 10 bovine tissues, including blood (Zhou et al.2016). However, in these studies only DNA methylomelandscapes were described and environmental influences onphenotypic variation were not explored. Thus, despiteincreasing knowledge about the genes involved in bovineadaptation to tropical climate (Gautier et al. 2009; Chanet al. 2010; Porto-Neto et al. 2014; Makina et al. 2015;Wang et al. 2016; Pitt et al. 2018), we lack understandingof relevant epigenetic function (see Varriale 2014 for areview).In this study therefore, we aimed to address the role ofepigenetic regulation on tropical adaptation in cattle bycomparing the methylomes of modern tropical Creolebovine breeds with modern day samples from breeds,including their putative Iberian ancestors. Although thenumber of samples analysed was relatively small, as inmany similar studies (e.g. Korkmaz & Kerr 2017; Semiket al. 2017), we included five different breeds to establishepigenomic differentiation among groups, accounting forbreed similarities related to their geographical location [i.e.the Iberian Peninsula (three breeds) and Colombia (twobreeds)], and used high stringency parameters to detectsignificant differentially methylated regions (DMRs). Wegenerated a genome-wide map of DNA methylation atsingle-nucleotide resolution in cattle that provides, apartfrom the inherent advance in knowledge about the bovineepigenome, insights into the biology and evolution of aspecies under profound climate change and a base for futureclimate-related research in cattle.Materials and methodsSamples and DNA extractionFive New and Old World cattle breeds were analysed in thisstudy. The sample comprised the Colombian Creole cattleCoste no con Cuernos (n 2) and San Martinero (n 1)breeds and Iberian cattle representing the main ancestors ofthese Creole populations including the Asturiana de losValles (n 1), Lidia (n 1) and Retinta (n 1) breeds.Samples were collected from adult males between 7 and11 years old. Animals were reared in their native environment under extensive conditions with access to characteristic available local vegetation, growing under theparticular climatic and dietary conditions that gave rise tothe different breed adaptations (Table 1). DNA wasextracted from blood samples using the UltraClean BloodSpin DNA Isolation Kit (MO BIO Laboratories, Inc.) for theCreole samples and the QIAamp DNA Blood Mini Kit(Qiagen) for the Spanish samples. The concentration andquality of genomic DNA were evaluated using the QubitdsDNA HS Assay Kit (Life Technologies).Reduced representation bisulfite sequencingGenomic DNA (0.5–1.0 lg) from each sample was restrictedwith the MspI enzyme (New England Biosciences), cleanedusing DNA Clean and concentrator-25 columns (ZymoResearch) and eluted in 60 ll for library preparation. The 2018 Stichting International Foundation for Animal Genetics, 50, 15–26
Epigenomics of tropical adaptation in cattleTable 1 Geographic and climatic conditions of Creole and Spanishbreeds.BreedLocationMASLMAT( C)MARH(%)MAR(mm) o conCostenCuernosDepartment of rdoba (Sin CouRiver Valley,Colombia)Department ofMeta (Colombia)Mieres (Asturias,Spain)Ig uzquiza(Navarra, Spain)Tierra de Barros(Badajoz, 001766450San MartineroAsturiana delos VallesLidia (CastaNavarra)RetintaMASL, metres above sea level; MAT, mean annual temperature;MARH, mean annual relative humidity; MAR, mean annual rainfall.sticky ends produced by MspI digestion were filled with CGnucleotides and Illumina sequencing adapters. The TruSeqNano DNA LT Library Prep Kit (Illumina) was used for 30adenylation and adapter ligation. The end-repaired sampleswere purified using 2.59 AMpure XP Beads (BeckmanCoulter) and eluted in 20 ll of resuspension buffer. Afteradapter ligation, samples were again purified using 1.09AMpure XP Beads and eluted in 40 ll of resuspensionbuffer. Size selection of DNA fragments ( 175–225 bp) wasperformed using a 2% agarose gel (Invitrogen), and theselected fragments were purified twice using 1.09 AMpureXP Beads and finally eluted in 22 ll of resuspension buffer.Bisulfite conversion of non-methylated cytosines was performed on 20 ll of size-selected fragments using the EZ DNAMethylation-Lightning Kit (Zymo Research). PCR (20cycles) was performed to enrich the sequencing libraryusing a TruSeq Nano DNA LT Library Prep Kit (Illumina).The Pfu Turbo Cx Hotstart DNA polymerase (AgilentTechnologies) and 10 mM dNTP mix (Life Technologies)were used for PCR reactions. After enrichment, the librarywas purified twice using 19 AMpure XP Beads (BeckmanCoulter) and quantified using the Qubit dsDNA HS Assay Kit(Life Technologies). The average library size was determinedusing an Agilent 2100 Bioanalyzer (Agilent Technologies).The libraries were then pooled in equimolar ratios of 2 nM,and 6.0 pM of the pool was clustered and sample trackedusing the cBot (Illumina) and sequenced following a2 9 150-bp protocol for 300 cycles using the HiSeq 2500system (Illumina).RRBS data analysis and genome-wide DNA methylationlevelsQuality assessment and control were performed using TRIMsoftware (Babraham Bioinformatics, UK). For adaptertrimming, the minimum required adapter overlap was 1 bp.To remove potential methylation-biased bases from theGALORE 2018 Stichting International Foundation for Animal Genetics, 50, 15–26MspI digestion end-repair reaction, RRBS reads weretrimmed an additional 2 bp when adapter contaminationwas detected and by 2 bp at the start when the read startedwith CAA or CGA. Trimming was performed on all readsusing a minimum Phred quality score of 20. Sequenceswere mapped with single end mapping to bovine genomeassembly UMD3.1.1 using BISMARK (Krueger & Andrews2011). Following optimisation, a seed length of 20 bp waschosen and only one mismatch was allowed. The minimumalignment score function was set at L,0, 0.6. Only thereads that were aligned to a unique region in the genomewere used for further analysis.For CpG level comparison, percentage of methylation ofindividual CpGs was calculated using the METHYLKIT packagein R (Akalin et al. 2012) and the coverage files from theBISMARK aligner. To prevent PCR bias and increase the powerof the statistical tests, we discarded bases with high (above99.9th percentile of coverage in each sample) and low(below 109 coverage, CpG10) read coverage. Eachsequenced and filtered CpG10 site was assigned a percentageof methylation score. The CpG10 bisulfite conversion ratewas calculated as the number of thymines (non-methylatedcytosines) divided by coverage for each non-CpG cytosine,as implemented in METHYLKIT. Coverage and correlation plotswere also generated by METHYLKIT. The pattern of methylation around different components of the cattle genome,including gene bodies [defined as the region from transcription start site (TSS) to transcription termination site (TTS)],TSSs, TTSs and CpG islands (CpGI), was also investigatedusing SEQMONK software (Babraham Bioinformatics) from20 kb upstream to 20 kb downstream. CpG10 were annotated with the closest/overlapping TSS ( 100 kb) (Miele &Dekker 2008; Sanyal et al. 2012) and CpGI using theIDENTGENLOC program from the DMAP package (Stockwell et al.2014). Promoters were defined as 0 to 2 kb of TSS, andCpGI shores and shelves as 0–2 and 2–4 kb flankingregions of CpGI respectively.Differentially methylated region analysisDifferentially methylated regions were established amongCreole and Spanish groups to account for breed similaritiesrelated to their geographical location, that is, the IberianPeninsula (three breeds, three samples three biologicalreplicates within the same group) and Colombia (twobreeds, three samples three biological replicates withinthe same group). To compare spatially contiguous stretchesof methylated cytosines across the Creole and Spanishgenomes, DMRs were determined using the R package DSS(dispersion shrinkage for sequencing data) (Feng et al.2014), which outperforms other methods when samplesize per group is small owing to the adoption of the Waldtest with shrinkage for determining differentially methylated cytosines (Zhang et al. 2016). We identified DMRsusing the coverage files from BISMARK and the CALLDMR17
18Sevane et al.function with a P-value threshold of 0.01, delta equal to 0.1and otherwise default parameters. To be considered significant, a DMR was required to contain at least three CpGsites (default parameter, although the smallest significantDMR included four CpGs) within a distance of 200 bp andwith an absolute mean methylation difference greater than25% when comparing Creole and Spanish samples (Akalinet al. 2012). As CpG10, DMRs were annotated with theclosest/overlapping TSS ( 100 kb) and CpGI using theIDENTGENLOC program from the DMAP package.Gene ontology analysisAnnotated DMRs were subjected to Gene Ontology (GO)enrichment using the PANTHER v.10 web resource (Miet al. 2016). This GO classification system was used toassign a putative function to each gene by way of biologicalprocess, molecular function and cellular components. TheDatabase for Annotation, Visualization and IntegratedDiscovery (DAVID) v6.8 (Huang et al. 2009) was used todetermine processes of major biological significance throughthe FUNCTIONAL ANNOTATION CLUSTER (FAC) tool based on the GOannotation function. High stringency ease score parameterswere selected to obtain confident enrichment scores. KEGGpathway analyses were performed using both DAVID andthe WEBGESTALT overrepresentation enrichment analysis(ORA) (Wang et al. 2013) to map clusters of genes involvedin common pathways and processes.Validation of RRBS data with HiSeq bisulfite sequencingPCRWe performed validation of RRBS data with HiSeq bisulfitesequencing PCR (HiSeq-BSP) for three DMRs annotated toimmune, cancer and nervous system genes, displaying bothhyper- and hypomethylation patterns (Table S1). The initialconcentration of genomic DNA was measured using theQubit dsDNA HS Assay Kit (Life Technologies). The sampleswere then diluted accordingly to achieve the recommendedDNA input of 500 ng at a concentration of 25 ng/ll forbisulfite treatment. The samples were bisulfite-treated usingthe EZ DNA Methylation-Lightning Kit (Zymo Research).The treated DNA was PCR-amplified using specific primersfor BSP designed and validated by Zymo Research(Table S1). The amplified products for these three assayswere pooled together for each sample, and sequencinglibraries were made by using the TruSeq Nano DNA LTLibrary Prep Kit (Illumina). Following the library preparation, the final concentration of the library was measuredusing the Qubit dsDNA HS Assay Kit (Life Technologies).The libraries were diluted to 12 pM and were sequenced byusing the 600 Cycles v3 Reagent Kit (Illumina) on theMiSeq (Illumina) on a 150-base paired-end run. Sequencereads were trimmed, aligned and analysed as describedabove.ResultsAssessment of RRBS data and genome-wide DNAmethylation levelsFragmentation with the restriction enzyme MspI of bloodextracted DNA from three Creole and three Spanish samplesresulted in high quality sequencing RRBS libraries enrichedfor high CG regions. Illumina HiSeq 2500 sequencinggenerated between 15 and 38 million reads per sample(accession no. GSE101796) and a total of 136 million reads(Table S2). Quality control analysis using TRIM GALORE andMETHYLKIT indicated that the 150-bp sequences displayed theexpected nucleotide composition based on MspI digestionand bisulfite conversion (98% average sodium bisulfiteconversion efficiency). On average, 98.2% of reads passedthe filtering process (Table S2). The mean percentage ofmapped reads was 85%, with 33–61% of reads mapping tomultiple locations of the genome and 29–43% mappinguniquely (Table S2). Sequences that did not map, or did notmap uniquely, were excluded from the analysis.After alignment, we filtered the CpG dinucleotides basedon a coverage of 10 or more reads (CpG10). The number ofCpG10 per sample ranged from 0.4 to 1.6 million, and themean coverage ranged from 33 to 106 (Table S3). Of thesesites, 20 234 were present in all six samples (Table S4). Weobserved high positive correlations between all the samplesanalysed (mean Pearson’s correlation coefficient 0.8),although clear variation was present between them(Fig. S1). The distribution of sequence read coverage ofCpG10 per sample is shown in Fig. S2 and highlights that,despite the observation that the filtered CpG10 displayedhigh mean coverage, the libraries did not suffer from biasdue to excessive amplification of a subset of fragments, asreflected in the absence of peaks on the right-hand side ofeach histogram. The RRBS protocol has been shown toenrich for CpGIs and, as CpGIs have been universallyreported to be regions of gene regulation via methylcytosine and are generally demethylated, the percentage ofmethylation of CpGs in RRBS libraries is expected to belower than the average methylation of the genome ( 80%).Accordingly, global CpG10 methylation ranged from 51%to 57% across samples (Table S3). The distribution ofmethylation at each CpG10 site revealed a bimodal pattern,with heavy methylation ( 95%) of 39–53% CpG10 andcompletely unmethylated bases ( 5%) ranging between35% and 47% (Fig. S3). The median methylation was high(84%) (Table S3), reflecting the heavy hypermethylation of48% of CpG10 sites. However, hypomethylated CpG10 siteswere also evident, including 42% of the analysed CpG sites(Fig. S3). The percentage of CHG and CHH methylationwas low in cattle blood, ranging from 0.9% to 1.6%(Table S3).Although some gaps existed, RRBS reads were detectedin most chromosomal regions (chromosomes 1–29 and X) 2018 Stichting International Foundation for Animal Genetics, 50, 15–26
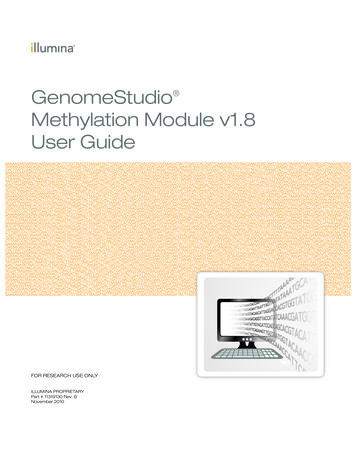
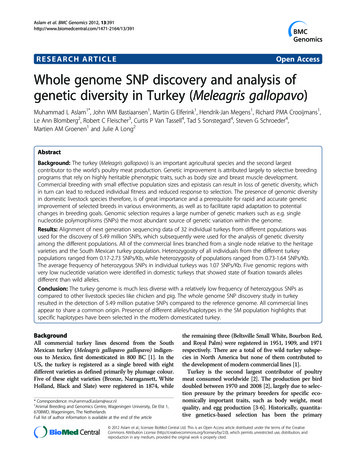
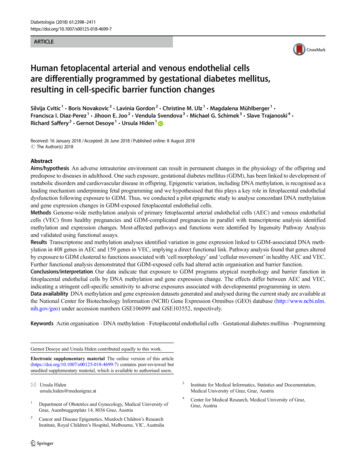
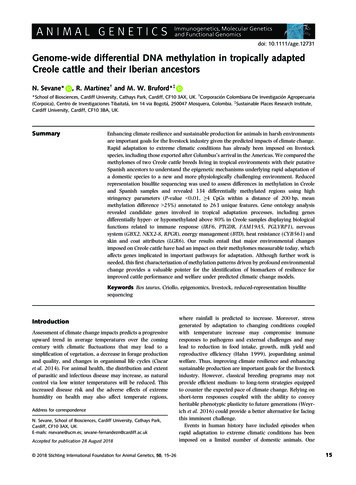
Epigenomics of tropical adaptation in cattlein each group (Fig. 1). This even-read distributionindicates that cattle blood methylomes can be detectedby RRBS technology with good representation, therebyensuring accurate examination of variation in DNAmethylation. The distribution of CpG10 related to CpGIs(6235; 31%) revealed that RRBS data are highly enrichedin CpGI cores (85%), whereas only a small amount is inCpGI shores (11%) and shelves (4%) (Table S4). Thedistribution of CpG10 in relation to genes (4389; 22%)showed that almost 85% mapped to gene bodies (92%located in introns and 8% in exons) and a much smallerpercentage mapped to gene promoters (15%), with the mainamount located in intergenic regions (15 845; 78%)(Table S4).DNA methylation levels sharply decreased in the 2-kb regionupstream of TSSs and dropped to the lowest point before TSSs(Fig. 2a), corresponding with the distribution of gene promoters, usually prone to transcription, whereas levels dramaticallyincreased in the 30 direction, peaking 50 to the TTS (Fig. 2a),related to the methylation of gene bodies contributing tochromatin structure stability and the regulation of geneexpression (Bird 2002). The level dropped slightly andplateaued after TTS (Fig. 2a). As expected, the level ofmethylation in CpGIs was lower than outside CpGIs (Fig. 2b).Figure 1 Chromosomal distribution of reads in the (a) Creole and (b) Spanish grouped samples. The distribution of reads is shown in a gradient fromblue (low) to red (high).(a)(b)Figure 2 DNA methylation levels in relation to(a) gene bodies and (b) CpG islands. Genebodies were defined as the region from thetranscription start site to transcription termination site. 2018 Stichting International Foundation for Animal Genetics, 50, 15–2619
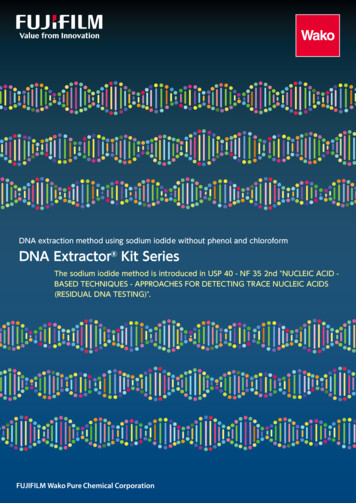
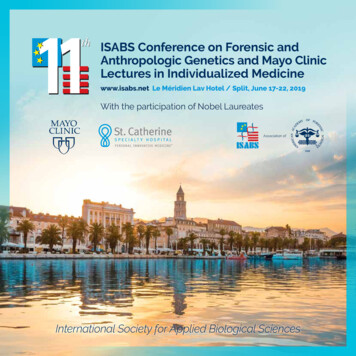
20Sevane et al.Table 2 Differentially methylated regions (DMRs) overlapping a gene or CpGI and showing hyper- and hypomethylated levels above 80% in Creolesamples.SymbolGene name1Hypermethylated in Creole samplesGBX2Gastrulation brain homeobox 2 (E1BJ47)LATS2Large tumor suppressor kinase 2BRAT1BRCA1 associated ATM activator 1BTDBiotinidase (F1MJM4)BLMBloom syndrome RecQ like helicaseNKX2-8NK2 homeobox 8 (E1BAC5)IRF6Interferon regulatory factor 6PTGDRProstaglandin D2 receptor (PD2R)TP53I11Tumor protein p53 inducible protein 11 (PIG11)TM4SF5Transmembrane 4 L six family member 5 (T4S5)ATP13A3ATPase 13A3 (E1BG26)TRIM25Tripartite motif containing 25 (A6QLA8)CYB561Cytochrome b-561 (CY561)FAM19A5Family with sequence similarity 19 member A5,C-C motif chemokine like (F19A5)RPGRRetinitis pigmentosa GTPase regulatorSNX13Sorting nexin 13Hypomethylated in Creole samplesTNRC18Trinucleotide repeat containing 18PAPLNPapilin, proteoglycan like sulfated glycoproteinLGR6Leucine rich repeat containing G protein-coupledreceptor 6 (LOC100336662)PGLYRP1Peptidoglycan recognition protein 1 (PGRP1)Gene overlapCpGI relationMeth diff2–On intron–Intron–exon boundaryOn intronOn exonOn intronOn exonOn intronIntron–exon boundary–On intron–On I– 0.84 0.83 0.83 0.82 0.82 0.81 0.81 0.81 0.81 0.81 0.81 0.80 0.80 0.80–On intronCpGI core–On intronExon–intron boundaryOn intron–––0.800.800.81On exonCpGI core0.84coreshelfcorecorecorecoreshelfcore 0.80 0.801UniProtKB/TrEMBL record displayed within parentheses.Methylation differences averaged from all CpG sites within the defined region. Negative differential methylation values indicate hypermethylation inCreole samples; positive differential methylation values indicate hypomethylation in Creole samples.2Differential methylation between Creole and Spanishcattle samplesComparison of spatially contiguous stretches of differentiallymethylated cytosines between Creole and Spanish samplesrevealed 334 DMRs (P-value 0.01, 4 CpGs within adistance of 200 bp, mean methylation difference 25%;Table S5). Annotation of these DMRs showed that 275 sites(82%), corresponding to 263 unique features, were overlapping a gene or within a distance of 100 kb from theclosest TSS. Approximately 37% of DMRs overlapped agene, whereas 4% were in regions 2 kb upstream of a TSSor promoters. Intragenic DMR were equally divided betweenintrons (52%) and exons (48%). Around 36% of DMRs werelocated in CpGIs, mainly in CpGI cores (81%), whereas only12% and 7% overlapped CpGIs shores and shelves respectively. Interestingly, a high proportion of DMRs (71%)displayed hypermethylation in Creole samples. The DMRsoverlapping a gene or CpGI hyper- and hypomethylatedabove 80% in Creole samples are shown in Table 2.level), Biological Process (sets of molecular events oroperations with a defined beginning and end) and CellularComponent (Fig. S4). The annotated DMRs were thenanalysed using DAVID and WEBGESTALT tools. DAVID FACanalysis produced 16 enriched functional clusters underhigh stringency conditions for 115 DAVID IDs (Table S6).Among these enriched functional clusters, homeobox,epidermal growth factor (two clusters) and immunoglobulin(two clusters) were identified. We analysed the distributionof annotated DMRs along the cattle chromosomes, confirming one enriched genomic region on chromosome 21 thatcomprised 12 genes related to the cellular componentmembrane (Table S6). KEGG pathway analysis retrieved atotal of 14 pathways (Table 3): 10 from WEBGESTALT, including immune-related processes such as leukocyte, T cell andlymphocyte differentiation and activation, and circulatorysystem development or cell proliferation (Fig. 3) and fourfrom the DAVID tool, including acute myeloid leukemia,insulin signalling pathway, Rap1 signaling pathway andmicroRNAs in cancer (Fig. S5).Gene ontology analysisValidation of RRBS data with HiSeq-BSPAmong the 263 differentially methylated unique annotatedfeatures, functional data for 213 genes were obtained withPANTHER, including the GO classes Molecular Function(the primary activities of gene products at the molecularWe used HiSeq-BSP to assess the methylation patterns ofthree gene-annotated DMRs, including regions displayinghigh and low differential methylation levels betweenCreole and Spanish samples and implicated in immune 2018 Stichting International Foundation for Animal Genetics, 50, 15–26
Epigenomics of tropical adaptation in cattleTable 3 KEGG pathway enrichment analysis of differentially methylated genes between Creole and Spanish cattle samples usingDAVID tools.Gene ontology(GO) tionGO:0022407Regulation of cell-cell adhesionGO:0050865ofofofofleukocyte differentiationT cell activationleukocyte cell-cell adhesionlymphocyte Regulation of cell activation104837GO:0072359Circulatory system development143013GO:2000026Regulation of multicellularorganismal development192334GO:0008283Cell proliferation212341GO:0048513Animal organ cute myeloid leukemiaInsulin signalling pathwayRap1 signalling pathwayMicroRNAs in cancer34576448354028123397(SERPINB1), cancer (SHOX2) and nervous system (NRXN2)processes. The HiSeq-BSP methylation results were significant for the three amplified regions (P-value 0.01, 4CpGs, mean methylation difference 10%) and concordantwith the methylation profiles obtained with the RRBSanalysis (Table S7).DiscussionStudies on adaptation are key to disentangling the evolutionary potential of organisms in response to biotic andabiotic stress and other environmental challenges, whichcould potentially be highly relevant in the context of globalclimate change. Tropical environments are characterizedby high temperature and humidity, episodes of feed andwater scarcity and virulent tropical diseases and parasiticinfections. Creole cattle demonstrate greater resistance tosuch conditions, surviving, breeding and producing efficiently in the tropics (Hern andez-Cer on et al. 2004;Mart ınez et al. 2008). Two tropically adapted Creole breedsand their likely Spanish ancestors were analysed toestablish epigenomic differences among groups accountingfor breed similarities related to their geographical location.The Coste no con Cuernos and San Martinero breeds have 2018 Stichting International Foundation for Animal Genetics, 50, 15–26WEBGESTALTandGenesNRARP, LIF, PGLYRP1, PRKCZ, RUNX1, NKAP, CD83NRARP, CD5, PRKCZ, MAD1L1, LMO1, NKAP, CD83NRARP, CD5, PRKCZ, MAD1L1, LMO1, NKAP, CD83NRARP, CD5, PGLYRP1, PRKCZ, MAD1L1, LMO1,NKAP, CD83NRARP, CD5, PRKCZ, ALOX12, MAD1L1, LMO1,NKAP, CD83NRARP, CD5, PGLYRP1, PRKCZ, ALOX12, PDGFA,MAD1L1, LMO1, NKAP, CD83NRARP, LIF, ALOX12, PDGFA, GBX2, MAP2K2, SMAD6,CYP1B1, EOMES, BAK1, SHOX2, FLRT2, ADM2, BCORNRARP, LIF, PGLYRP1, PRKCZ, ALOX12, PDGFA, MAP2K2,CYP1B1, EOMES, SHOX2, RUNX1, RFX4, BHLHE23,FLRT2, NKAP, CD83, ADM2, PHOX2B, BCORNRARP, LIF, NPR3, ALOX12, PDGFA, GBX2, MAP2K2,SMAD6, CYP1B1, P3H2, BAK1, MAD1L1, DAGLA,SHOX2, LMO1, LTBP3, NKX2-8, MAB21L2, NKAP,IRF6, PHOX2BNRARP, LIF, PGLYRP1, PRKCZ, ALOX12, PDGFA, GBX2,MAP2K2, SMAD6, CYP1B1, EOMES, BAK1, MAD1L1,SHOX2, IFITM5, HOXB1, RUNX1, RFX4, NKX2-8,BHLHE23, MAB21L2, FLRT2, NKAP, TMEM14C, IRF6,CD83, PHOX2B, BCORMAP2K2, KIT, RUNX1PRKCZ, SOCS2, MAP2K2, PRKAR1BPRKCZ, MAPK12, PDGFA, MAP2
Coulter) and quantified using the Qubit dsDNA HS Assay Kit (Life Technologies). The average library size was determined using an Agilent 2100 Bioanalyzer (Agilent Technologies). The libraries were then pooled in equimolar ratios of 2 nM, and 6.0 pM of the pool was clustered and sample tracked