Transcription
GenomeStudio Methylation Module v1.8User GuideFOR RESEARCH USE ONLYILLUMINA PROPRIETARYPart # 11319130 Rev. BNovember 2010
NoticeThis document and its contents are proprietary to Illumina, Inc. and its affiliates ("Illumina"), andare intended solely for the contractual use of its customer in connection with the use of theproduct(s) described herein and for no other purpose. This document and its contents shall notbe used or distributed for any other purpose and/or otherwise communicated, disclosed, orreproduced in any way whatsoever without the prior written consent of Illumina. Illumina doesnot convey any license under its patent, trademark, copyright, or common-law rights nor similarrights of any third parties by this document.The instructions in this document must be strictly and explicitly followed by qualified andproperly trained personnel in order to ensure the proper and safe use of the product(s) describedherein. All of the contents of this document must be fully read and understood prior to usingsuch product(s).FAILURE TO COMPLETELY READ AND EXPLICITLY FOLLOW ALL OF THEINSTRUCTIONS CONTAINED HEREIN MAY RESULT IN DAMAGE TO THE PRODUCT(S),INJURY TO PERSONS, INCLUDING TO USERS OR OTHERS, AND DAMAGE TO OTHERPROPERTY.ILLUMINA DOES NOT ASSUME ANY LIABILITY ARISING OUT OF THE IMPROPER USE OFTHE PRODUCT(S) DESCRIBED HEREIN (INCLUDING PARTS THEREOF OR SOFTWARE) ORANY USE OF SUCH PRODUCT(S) OUTSIDE THE SCOPE OF THE EXPRESS WRITTENLICENSES OR PERMISSIONS GRANTED BY ILLUMINA IN CONNECTION WITHCUSTOMER'S ACQUISITION OF SUCH PRODUCT(S).FOR RESEARCH USE ONLY 2009–2010 Illumina, Inc. All rights reserved.Illumina, illuminaDx, Solexa, Making Sense Out of Life, Oligator, Sentrix, GoldenGate,GoldenGate Indexing, DASL, BeadArray, Array of Arrays, Infinium, BeadXpress, VeraCode,IntelliHyb, iSelect, CSPro, GenomeStudio, Genetic Energy, HiSeq, HiScan, Eco, and TruSeqare registered trademarks or trademarks of Illumina, Inc. All other brands and names containedherein are the property of their respective owners.GenomeStudio Methylation Module v1.8 User Guideiii
NoticeivPart # 11319130 Rev. B
Revision HistoryPart #RevisionDate11319130BNovember 201011319130ANovember 2008 Initial GenomeStudio release.GenomeStudio Methylation Module v1.8 User GuideDescription of Changev
Revision HistoryviPart # 11319130 Rev. B
Table of ContentsNotice . . . . . . . . . . . . . . . . . . . . . . . . . . . . . . . . . . . . . . . . . . . . . . . . . . . . . . iiiRevision History . . . . . . . . . . . . . . . . . . . . . . . . . . . . . . . . . . . . . . . . . . . . . . vTable of Contents . . . . . . . . . . . . . . . . . . . . . . . . . . . . . . . . . . . . . . . . . . . . .viiList of Tables . . . . . . . . . . . . . . . . . . . . . . . . . . . . . . . . . . . . . . . . . . . . . . . . ixChapter 1Overview . . . . . . . . . . . . . . . . . . . . . . . . . . . . . . . . . . .1Introduction . . . . . . . . . . . . . . . . . . . . . . . . . . . . . . . . . . . . . . . . . . . . . . . . .Audience and Purpose . . . . . . . . . . . . . . . . . . . . . . . . . . . . . . . . . . . . . . . . .Installing the Methylation Module. . . . . . . . . . . . . . . . . . . . . . . . . . . . . . . . .Methylation Module Workflow . . . . . . . . . . . . . . . . . . . . . . . . . . . . . . . . . . .Chapter 22346Creating a New Project . . . . . . . . . . . . . . . . . . . . . . . .7Introduction . . . . . . . . . . . . . . . . . . . . . . . . . . . . . . . . . . . . . . . . . . . . . . . . . 8Starting the Methylation Module . . . . . . . . . . . . . . . . . . . . . . . . . . . . . . . . . 9Selecting an Assay Type . . . . . . . . . . . . . . . . . . . . . . . . . . . . . . . . . . . . . . 10Choosing a Project Location . . . . . . . . . . . . . . . . . . . . . . . . . . . . . . . . . . . 11Selecting Your Project Data . . . . . . . . . . . . . . . . . . . . . . . . . . . . . . . . . . . . 12Defining Groupsets and Groups. . . . . . . . . . . . . . . . . . . . . . . . . . . . . . . . . 14Defining the Analysis Type and Parameters. . . . . . . . . . . . . . . . . . . . . . . . 17Creating a Mask File. . . . . . . . . . . . . . . . . . . . . . . . . . . . . . . . . . . . . . . . . . 19Chapter 3Viewing Your Data. . . . . . . . . . . . . . . . . . . . . . . . . . .21Introduction . . . . . . . . . . . . . . . . . . . . . . . . . . . . . . . . . . . . . . . . . . . . . . . .Scatter Plots . . . . . . . . . . . . . . . . . . . . . . . . . . . . . . . . . . . . . . . . . . . . . . . .Scatter Plot Functions . . . . . . . . . . . . . . . . . . . . . . . . . . . . . . . . . . . . .Scatter Plot Context Menu Selections. . . . . . . . . . . . . . . . . . . . . . . . .Finding Items in the Scatter Plot . . . . . . . . . . . . . . . . . . . . . . . . . . . . .Histogram Plots . . . . . . . . . . . . . . . . . . . . . . . . . . . . . . . . . . . . . . . . . . . . .Histogram Plot Context Menu . . . . . . . . . . . . . . . . . . . . . . . . . . . . . .Heat Maps . . . . . . . . . . . . . . . . . . . . . . . . . . . . . . . . . . . . . . . . . . . . . . . . .Heat Map Tools Menu . . . . . . . . . . . . . . . . . . . . . . . . . . . . . . . . . . . . .Heat Map Context Menu . . . . . . . . . . . . . . . . . . . . . . . . . . . . . . . . . . .Cluster Analysis Dendrograms . . . . . . . . . . . . . . . . . . . . . . . . . . . . . . . . . .Similarities and Distances . . . . . . . . . . . . . . . . . . . . . . . . . . . . . . . . . .Analyzing Clusters . . . . . . . . . . . . . . . . . . . . . . . . . . . . . . . . . . . . . . . .Dendrogram Context Menu Selections . . . . . . . . . . . . . . . . . . . . . . . .Viewing the Sub-Tree List Directly in the Dendrogram . . . . . . . . . . . .Copy/Paste Gene Clusters . . . . . . . . . . . . . . . . . . . . . . . . . . . . . . . . . . . . .From Scatter Plot to Dendrogram . . . . . . . . . . . . . . . . . . . . . . . . . . . .From Dendrogram to Scatter Plot . . . . . . . . . . . . . . . . . . . . . . . . . . . .GenomeStudio Methylation Module v1.8 User Guide222324272833343637383939404243454545vii
Table of ContentsChapter 4Applying Methylation Algorithms . . . . . . . . . . . . . . . 47Methylation Analysis Algorithms . . . . . . . . . . . . . . . . . . . . . . . . . . . . . . . . .48Normalization Methods and Algorithms . . . . . . . . . . . . . . . . . . . . . . . . . . .49Average Normalization . . . . . . . . . . . . . . . . . . . . . . . . . . . . . . . . . . . . .49Normalization to Internal Controls. . . . . . . . . . . . . . . . . . . . . . . . . . . . .49Background Subtraction . . . . . . . . . . . . . . . . . . . . . . . . . . . . . . . . . . . .50Differential Methylation Analysis Algorithms . . . . . . . . . . . . . . . . . . . . . . . .51Illumina Custom Model . . . . . . . . . . . . . . . . . . . . . . . . . . . . . . . . . . . . .51Mann-Whitney Model . . . . . . . . . . . . . . . . . . . . . . . . . . . . . . . . . . . . . .51T-Test Model . . . . . . . . . . . . . . . . . . . . . . . . . . . . . . . . . . . . . . . . . . . . .52Chapter 5Comparing Methylation and Gene Expression Data 53Introduction . . . . . . . . . . . . . . . . . . . . . . . . . . . . . . . . . . . . . . . . . . . . . . . . .54Importing Gene Expression Data. . . . . . . . . . . . . . . . . . . . . . . . . . . . . . . . .55Visualize the Correlation of Methylation and Expression Levels Data. . . . .58Chapter 6User Interface Reference . . . . . . . . . . . . . . . . . . . . . 59Introduction . . . . . . . . . . . . . . . . . . . . . . . . . . . . . . . . . . . . . . . . . . . . . . . . .60Detachable Docking Windows. . . . . . . . . . . . . . . . . . . . . . . . . . . . . . . . . . .61Control Probe Profile Table . . . . . . . . . . . . . . . . . . . . . . . . . . . . . . . . . .61Infinium Methylation Controls Dashboard. . . . . . . . . . . . . . . . . . . . . . .63GoldenGate Methylation Control Summary Graph . . . . . . . . . . . . . . . .70Group Methylation Profile Table . . . . . . . . . . . . . . . . . . . . . . . . . . . . . .72Sample Methylation Profile Table . . . . . . . . . . . . . . . . . . . . . . . . . . . . .80Samples Table. . . . . . . . . . . . . . . . . . . . . . . . . . . . . . . . . . . . . . . . . . . .88Project Window . . . . . . . . . . . . . . . . . . . . . . . . . . . . . . . . . . . . . . . . . . .90Log Window . . . . . . . . . . . . . . . . . . . . . . . . . . . . . . . . . . . . . . . . . . . . .90Main Window Menus . . . . . . . . . . . . . . . . . . . . . . . . . . . . . . . . . . . . . . . . . .91Context Menus . . . . . . . . . . . . . . . . . . . . . . . . . . . . . . . . . . . . . . . . . . . . . .94Appendix ASample Sheet Format. . . . . . . . . . . . . . . . . . . . . . . . 97Introduction . . . . . . . . . . . . . . . . . . . . . . . . . . . . . . . . . . . . . . . . . . . . . . . . .98Data Section . . . . . . . . . . . . . . . . . . . . . . . . . . . . . . . . . . . . . . . . . . . . . . . .99Sample Sheet Template . . . . . . . . . . . . . . . . . . . . . . . . . . . . . . . . . . . . . .100Sample Sheet Examples . . . . . . . . . . . . . . . . . . . . . . . . . . . . . . . . . . . . . .101Technical Assistance . . . . . . . . . . . . . . . . . . . . . . . 103viiiPart # 11319130 Rev. B
List of TablesTable 1Table 2Table 3Table 4Table 5Table 6Table 7Table 8Table 9Table 10Table 11Table 12Table 13Table 14Table 15Table 16Table 17Table 18Table 19Table 20Table 21Table 22Scatter Plot Control Panel Functions and Descriptions . . . . . . . . . . . . . . . 24Scatter Plot Tools Menu Item Descriptions . . . . . . . . . . . . . . . . . . . . . . . . 26Scatter Plot Context Menu Item Descriptions . . . . . . . . . . . . . . . . . . . . . . 27Histogram Plot Context Menu Item Descriptions. . . . . . . . . . . . . . . . . . . . 35Heat Map Tools Menu Item Descriptions . . . . . . . . . . . . . . . . . . . . . . . . . . 37Heat Map Context Menu Item Descriptions . . . . . . . . . . . . . . . . . . . . . . . . 38Dendrogram Context Menu Selections . . . . . . . . . . . . . . . . . . . . . . . . . . . 43Control Probe Profile Table . . . . . . . . . . . . . . . . . . . . . . . . . . . . . . . . . . . . 62GoldenGate Assay Control Summary Graph . . . . . . . . . . . . . . . . . . . . . . . 71Group Methylation Profile Table, Infinium HD Assay . . . . . . . . . . . . . . . . . 73Group Methylation Profile Table, Infinium Assay . . . . . . . . . . . . . . . . . . . . 76Group Methylation Profile Table, GoldenGate Assay. . . . . . . . . . . . . . . . . 79Sample Methylation Profile Table, Infinium HD Assay . . . . . . . . . . . . . . . . 81Sample Methylation Profile Table, Infinium Assay . . . . . . . . . . . . . . . . . . . 84Sample Methylation Profile Table, GoldenGate Assay. . . . . . . . . . . . . . . . 86Samples Table, Infinium Assay. . . . . . . . . . . . . . . . . . . . . . . . . . . . . . . . . . 88Samples Table, GoldenGate Assay . . . . . . . . . . . . . . . . . . . . . . . . . . . . . . 89Main Menu Elements and Functions . . . . . . . . . . . . . . . . . . . . . . . . . . . . . 91Context Menu Elements and Functions . . . . . . . . . . . . . . . . . . . . . . . . . . . 94Data Section, Required and Optional Columns . . . . . . . . . . . . . . . . . . . . . 99Illumina General Contact Information. . . . . . . . . . . . . . . . . . . . . . . . . . . . 103Illumina Customer Support Telephone Numbers . . . . . . . . . . . . . . . . . . . 103GenomeStudio Methylation Module v1.8 User Guideix
List of TablesxPart # 11319130 Rev. B
Chapter 1OverviewIntroduction . . . . . . . . . . . . . . . . . . . . . . . . . . . . . . . . . . . . . . . . . . . . . . . . . . . . . 2Audience and Purpose. . . . . . . . . . . . . . . . . . . . . . . . . . . . . . . . . . . . . . . . . . . . . 3Installing the Methylation Module . . . . . . . . . . . . . . . . . . . . . . . . . . . . . . . . . . . . 4Methylation Module Workflow . . . . . . . . . . . . . . . . . . . . . . . . . . . . . . . . . . . . . . . 6GenomeStudio Methylation Module v1.8 User Guide1
OverviewIntroductionDNA methylation is an important regulatory mechanism of gene expression in manyeukaryotic cell types. In humans and most mammals, DNA methylation mostly affects thecytosine base (C) when it is followed by a guanosine (G). Thus, in these organisms, DNAmethylation generally occurs at CpG sites.The pattern of methylation is cell-type-specific and established during the development ofan organism. Changes in methylation patterns play critical roles in the regulation of geneexpression in development, differentiation, and diseases such as multiple sclerosis,diabetes, schizophrenia, aging, and cancers.The GenomeStudio Methylation Module is a software application you can use to analyzemethylation data from scanned microarray images collected from the Illumina iScanSystem, HiScan or HiScanSQ System, BeadXpress Reader, or BeadArray Reader. You canalso use the resulting GenomeStudio output files with most standard data analysisprograms.The GenomeStudio Methylation Module allows you to perform two types of dataanalysis: Methylation Analysis—calculating methylation levels Differential Methylation Analysis—determining whether methylation levels havechanged between a reference group and another experimental group.You can perform these analyses on individual samples, or on groups of samples treated asreplicates.The GenomeStudio Methylation Module includes tools that provide a quick, visual meansfor exploratory analysis, including: Line plots Bar graphs Scatter plots Histograms Dendrograms Box plots Heat maps Control summary reportsAlso included with the GenomeStudio Methylation Module are the following powerfuldata visualization and analysis tools: Illumina Genome Viewer (IGV) Illumina Chromosome Browser (ICB) Methylation/Gene Expression Comparison ToolThis manual describes Illumina’s GenomeStudio Methylation Module softwareapplication and its component tools, and presents guidelines for evaluating the quality ofyour methylation experiments.For information abut the IGV and the ICB, see the GenomeStudio Framework User Guide.2Part # 11319130 Rev. B
This guide is written for researchers who want to use the GenomeStudio MethylationModule software application to analyze data obtained by performing one or more of thefollowing assays: Illumina’s Infinium Assay for Methylation Illumina’s Infinium HD Assay for Methylation Illumina’s GoldenGate Assay for Methylation Illumina’s VeraCode Assay for MethylationThis guide includes procedures and user interface information for the GenomeStudioMethylation Module. For information about performing Methylation assays, see therelated Methylation Assay Guide.GenomeStudio Methylation Module v1.8 User Guide3Audience and PurposeAudience and Purpose
OverviewInstalling the Methylation ModuleTo install the GenomeStudio Methylation Module:1Put the GenomeStudio CD into your CD drive or navigate to the GenomeStudioinstaller.The GenomeStudio application suite unzips, then the Illumina GenomeStudioInstallation dialog box opens.Figure 1 Selecting GenomeStudio Software Modules2Read the software license agreement in the right-hand side of the IlluminaGenomeStudio Installation dialog box.3In the GenomeStudio Product area, select Methylation Module.NOTEThe GenomeStudio Framework works in conjunction withGenomeStudio software modules. Select the Framework and one ormore GenomeStudio modules to install, and have your serial number(s)available.4In the Serial Number area, enter your serial number for the Methylation Module.NOTESerial numbers are in the format ####-####-####-#### and can be foundon an insert included with your GenomeStudio CD.45[Optional] Enter the serial numbers for additional GenomeStudio modules if youhave licenses for additional GenomeStudio modules and want to install them now.6Click Install.The Software License Agreement dialog box opens.Part # 11319130 Rev. B
7Installing the Methylation ModuleFigure 2 License AgreementClick Yes to accept the software license agreement.The GenomeStudio Framework and Methylation Module are installed on yourcomputer, along with any additional GenomeStudio modules you selected.Figure 3 Installing GenomeStudioThe Installation Progress dialog box notifies you that installation is complete.Figure 4 Installation Complete8Click OK.9In the Illumina GenomeStudio Installation dialog box, click Exit.You can now start a new GenomeStudio project using any GenomeStudio moduleyou have installed.See Chapter 2, Creating a New Project, for information about starting a newMethylation project.GenomeStudio Methylation Module v1.8 User Guide5
OverviewMethylation Module WorkflowThe basic workflow for methylation is shown in Figure 5.Figure 5 GenomeStudio Methylation Module Workflow6Part # 11319130 Rev. B
Chapter 2Creating a New ProjectIntroduction . . . . . . . . . . . . . . . . . . . . . . . . . . . . . . . . . . . . . . . . . . . . . . . . . . . . . 8Starting the Methylation Module . . . . . . . . . . . . . . . . . . . . . . . . . . . . . . . . . . . . . 9Selecting an Assay Type . . . . . . . . . . . . . . . . . . . . . . . . . . . . . . . . . . . . . . . . . . 10Choosing a Project Location . . . . . . . . . . . . . . . . . . . . . . . . . . . . . . . . . . . . . . . 11Selecting Your Project Data . . . . . . . . . . . . . . . . . . . . . . . . . . . . . . . . . . . . . . . . 12Defining Groupsets and Groups . . . . . . . . . . . . . . . . . . . . . . . . . . . . . . . . . . . . 14Defining the Analysis Type and Parameters. . . . . . . . . . . . . . . . . . . . . . . . . . . . 17Creating a Mask File . . . . . . . . . . . . . . . . . . . . . . . . . . . . . . . . . . . . . . . . . . . . . 19GenomeStudio Methylation Module v1.8 User Guide7
Creating a New ProjectIntroductionUsing the intensity files produced by the Illumina iScan System, HiScan or HiScanSQSystem, or BeadArray Reader, GenomeStudio's Methylation Module allows you toproduce data tables containing: CpG locus lists Methylation levels for individual CpG loci (normalized or raw) Associated hybridization intensities in the red and green channels Information about system controlsIn addition, GenomeStudio's Differential Methylation Analysis capability allows you toproduce data tables determining the probability that the methylation level between twosamples or groups of samples has changed.Using these data tables, GenomeStudio's data visualization tools can create sophisticatedplotting analyses, including: Bar plots Line plots and scatter plots Heat maps Histograms Cluster analysis dendrograms Control summary reportsFor another level of analysis, you can also use the Illumina Genome Viewer (IGV), theIllumina Chromosome Browser (ICB), or a tool included in the Methylation Module thatcompares methylation with gene expression levels.NOTEFor more information about the IGV and the ICB, see the GenomeStudioFramework User Guide.For more information about the Methylation/Gene ExpressionComparison Tool, see Chapter 5, Comparing Methylation and GeneExpression Data of this manual.To run a methylation analysis, you must first define a GenomeStudio project. Within aproject, you define one or more groupsets, one or more groups (sample sets that can becompared against each other for the purpose of identifying differences in methylation),and one or more analyses. For more information about groups and groupsets, seeDefining Groupsets and Groups on page 14.In the simplest experiment, each group may have only one sample. However, if yourexperiment includes replicate samples, or samples that belong to similar biologicalconditions, you can assign these to the same group.In a project and within a group, GenomeStudio averages the values for each gene acrossthe samples. Its algorithms automatically take advantage of the replicates' statisticalpower to provide a sensitive determination of methylation detection and differentialmethylation.The GenomeStudio Project Wizard walks you through each step of creating a project: Starting the Methylation module Defining a project Creating groupsets and groups Applying normalization, methylation analysis, and differential methylation analysisalgorithms8Part # 11319130 Rev. B
Starting the Methylation ModuleStarting the Methylation Module Start the GenomeStudio Methylation Module by doing one of the following: Go to File New Project Methylation. On the Start page, in the New Project pane, click Methylation.The GenomeStudio Methylation Assay Selection dialog box opens.Figure 6 GenomeStudio Methylation Assay SelectionGenomeStudio Methylation Module v1.8 User Guide9
Creating a New ProjectSelecting an Assay Type1Select the Infinium or GoldenGate assay, as appropriate for the run you areanalyzing, then click OK.The examples in the following sections of this chapter reflect the choices available ifyou select Infinium and might not match the choices shown on your screen.Figure 7 GenomeStudio Project Wizard - Welcome2Click Next to continue.The GenomeStudio Project Wizard - Methylation Assay Type dialog box opens.Figure 8 GenomeStudio Project Wizard - Methylation Assay Type310Verify that the assay type is correct, and click Next.The GenomeStudio Project Wizard - Project Location dialog box opens.Part # 11319130 Rev. B
1In the Projects Repository area of the Project Location dialog box, browse to thelocation where you want to save your project.2In the Project Name area, enter a name for your project.The full path for your project appears beneath the name you enter.Choosing a Project LocationChoosing a Project LocationFigure 9 GenomeStudio Project Wizard - Project Location3Click Next to continue.The GenomeStudio Project Wizard - Project Data Selection dialog box opens.GenomeStudio Methylation Module v1.8 User Guide11
Creating a New ProjectSelecting Your Project Data1In the Repository area of the Project Data Selection dialog box, do one of thefollowing: Use the dropdown menu to select the repository folder where your intensity data(*.idat file) is stored. Type the path to the repository folder. Browse to the repository folder by using the Browse button to the right of theRepository area.When you browse to a repository folder, GenomeStudio displays all subfolderscontaining *.idat files.Figure 10 Project Wizard - Project Data Selection - Repository2In the Sentrix Array Products pane, select the product that you want to include inyour project.All samples are selected by default.Figure 11 Project Wizard - Project Data SelectionNOTEThe image of the Sentrix Array Product is different for each product.12Part # 11319130 Rev. B
To change the selected samples, in the Select area, do one or more of the following: To select a single sample, click the sample on the image. To select multiple samples, hold Ctrl and click each sample you want to select. To select all samples, click All. To select no samples, click None. To select the reverse of the samples currently selected (for example, samples 1, 2,and 3 are currently selected, but you want to select samples 4, 5, and 6), clickReverse.4Clickto add the selected samples to your project.The selected samples appear under the name of the Sentrix Array Product in theProject Data pane.Figure 12 Project Wizard - Project Data Selection - Selecting Samples5[Optional] Click(to the left of the group symbol) to display the list of sampleschosen for the current project for the given array. A project can contain several arrays,but the corresponds to only one array.6Click Next to advance to the GenomeStudio Project Wizard - Groupset Definitionscreen.GenomeStudio Methylation Module v1.8 User Guide13Selecting Your Project Data3
Creating a New ProjectDefining Groupsets and GroupsGenomeStudio projects are structured in a hierarchical manner.A project includes one or more groupsets.A groupset is a collection of groups that you choose to be analyzed simultaneously.A groupset includes one or more groups.A group is a set of arrays that share a functional relationship (e.g., replicates, zero timepoints, reference group). Within a groupset, an array can be included in more than onegroup (e.g., analyzed individually in addition to being analyzed as a member of areference group).Perform the following steps to define a groupset for your project.1Assign a name to your groupset by doing one of the following: Select New and type a name for your new groupset. Select Existing and choose a groupset from the dropdown menu.Figure 13 Project Wizard - Groupset Definition - Assigning Groupset Name214In the Sentrix Array Products pane, select the product that contains the samples youwant to assign to a groupset.All samples are selected by default.Part # 11319130 Rev. B
NOTEThe image of the Sentrix Array Product is different for each product.3To change the selected samples, in the Select area, do one or more of the following: To select a single sample, click the sample on the image. To select multiple samples, hold Ctrl and click each sample you want to select. To select all samples, click All. To select no samples, click None. To select the reverse of the samples currently selected (for example, samples 1, 2,and 3 are currently selected, but you want to select samples 4, 5, and 6), clickReverse.4Do any of the following to define project groups in a groupset:To.Click.Create a new groupAdd selected samples to a selected groupCreate a separate group for each selected sampleLoad data from a sample sheetApply a group layout fileRemove selected groups and samples from the projectRemove all groups and samples from the projectGenomeStudio Methylation Module v1.8 User Guide15Defining Groupsets and GroupsFigure 14 Project Wizard - Groupset Definition - Selecting Sentrix Array Product
Creating a New ProjectFigure 15 Project Wizard - Groupset Definition - Selecting Samples516Click Next to continue.The GenomeStudio Project Wizard - Project Analysis Type and Parameters dialog boxopens.Part # 11319130 Rev. B
1In the Analysis Type area of the Project Analysis Type and Parameters dialog box,select Methylation or Diff Methylation.Figure 16 Project Wizard - Project Analysis Type and Parameters2In the Name area, enter a name for this analysis.3In the Parameters area, select the normalization method you want to use: Average Controls Background NoneNOTEThese normalization methods are not supported for all products. Forinformation about normalization methods, see Chapter 4, ApplyingMethylation Algorithms.4Select an appropriate Content Descriptor for your project: *.bpm for Infinium assaysor *.oma for GoldenGate or VeraCode assays.5If you are performing a differential methylation analysis, select a Reference Groupand Error Model in the Differential Methylation area.GenomeStudio Methylation Module v1.8 User Guide17Defining the Analysis Type and ParametersDefining the Analysis Type and Parameters
Creating a New Project6If you want to compute the false discovery rate, select the Compute false discoveryrate check box.NOTEIf you select Compute false discovery rate, the p-values (in the p-valuecolumn in the table) are adjusted accordingly. The p-values are notadjusted if you do not select Compute false discovery rate.7[Optional, GoldenGate assay only] Select the Use Mask File check box and browseto the location of the mask file you want to use.The mask file must contain the following columns: TargetID ProbeID 0/1To create a mask file, copy the TargetID and ProbeID columns from the table, and addthe 0/1 column in Excel.For more information about mask files, see the section Creating a Mask File on page 19.NOTEA mask file allows you to choose which probes to include in youranalysis.8Click Finish.GenomeStudio begins to run your analysis. A progress bar indicates the completionlevel of your analysis.NOTEThe time it takes for your analysis to be processed depends on thenumber of samples and groups, and the type of analysis.Your GenomeStudio Methylation project opens.Figure 17 GenomeStudio - Methylation Analysis Default ViewFor information about the graphical user interface of the GenomeStudio MethylationModule, see Chapter 6, User Interface Reference.18Part # 11319130 Rev. B
Some custom GoldenGate assay probes may not provide reproducibly robust results andshould be removed from analysis. The detection p-value reported in GenomeStudio canbe used as an objective measure of overall probe performance.NOTEIllumina recommends excluding probes that have a detection p-value ofgreater than 0.05 in the assay; however, you may define your owncriteria.To exclude a probe:1Export the TargetID and ProbeID columns from the Group Methylation Profile tableor the Sample Methylation Profile table.2Create an additional column, in which 1 represents the probe to display, and 0represents the probe to hide.3Save the mask file as a *.csv file in the same repository where the content descriptorfile is stored. The mask file need not conform to a naming convention.NOTEAny *.csv file present in the same repository as Content Descriptor fileswill appear in the Experiment Parameters pulldown menu. To avoidconfusion, Illumina advises the use of separate repositories for ContentDescriptor and for SAM/BeadChip data.GenomeStudio Methylation Module v1.8 User Guide19Creating a Mask FileCreating a Mask File
Creating a New ProjectFigure 18 Mask File Example20Part # 11319130 Rev. B
Chapter 3Viewing Your DataIntroduction . . . . . . . . . . . . . . . . . . . . . . . . . . . . . . . . . . . . . . . . . . . . . . . . . . . . 22Scatter Plots . . . . . . . . . . . . . . . . . . . . . . . . . . . . . . . . . . . . . . . . . . . . . . . . . . . 23Histogram Plots . . . . . . . . . . . . . . . . . . . . . . . . . . . . . . . . . . . . . . . . . . . . . . . . . 33Heat Maps . . . . . . . . . . . . . . . . . . . . . . . . . . . . . . . . . . . . . . . . . . . . . . . . . . . . . 36Cluster Analysis Dendrograms. . . . . . . . . . . . . . . . . . . . . . . . . . . . . . . . . . .
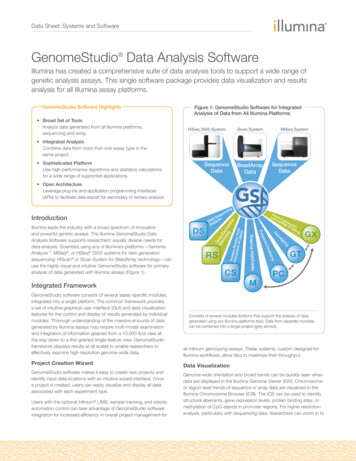
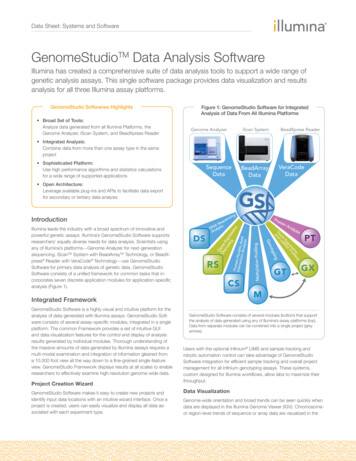
In addition, GenomeStudio's Differential Methylation Analysis capability allows you to produce data tables determining the probability that the methylation level between two samples or groups of samples has changed. Using these data tables, GenomeStudio's data visualization tools can create sophisticated plotting analyses, including: Bar plots