Transcription
Aslam et al. BMC Genomics 2012, 1RESEARCH ARTICLEOpen AccessWhole genome SNP discovery and analysis ofgenetic diversity in Turkey (Meleagris gallopavo)Muhammad L Aslam1*, John WM Bastiaansen1, Martin G Elferink1, Hendrik-Jan Megens1, Richard PMA Crooijmans1,Le Ann Blomberg2, Robert C Fleischer3, Curtis P Van Tassell4, Tad S Sonstegard4, Steven G Schroeder4,Martien AM Groenen1 and Julie A Long2AbstractBackground: The turkey (Meleagris gallopavo) is an important agricultural species and the second largestcontributor to the world’s poultry meat production. Genetic improvement is attributed largely to selective breedingprograms that rely on highly heritable phenotypic traits, such as body size and breast muscle development.Commercial breeding with small effective population sizes and epistasis can result in loss of genetic diversity, whichin turn can lead to reduced individual fitness and reduced response to selection. The presence of genomic diversityin domestic livestock species therefore, is of great importance and a prerequisite for rapid and accurate geneticimprovement of selected breeds in various environments, as well as to facilitate rapid adaptation to potentialchanges in breeding goals. Genomic selection requires a large number of genetic markers such as e.g. singlenucleotide polymorphisms (SNPs) the most abundant source of genetic variation within the genome.Results: Alignment of next generation sequencing data of 32 individual turkeys from different populations wasused for the discovery of 5.49 million SNPs, which subsequently were used for the analysis of genetic diversityamong the different populations. All of the commercial lines branched from a single node relative to the heritagevarieties and the South Mexican turkey population. Heterozygosity of all individuals from the different turkeypopulations ranged from 0.17-2.73 SNPs/Kb, while heterozygosity of populations ranged from 0.73-1.64 SNPs/Kb.The average frequency of heterozygous SNPs in individual turkeys was 1.07 SNPs/Kb. Five genomic regions withvery low nucleotide variation were identified in domestic turkeys that showed state of fixation towards allelesdifferent than wild alleles.Conclusion: The turkey genome is much less diverse with a relatively low frequency of heterozygous SNPs ascompared to other livestock species like chicken and pig. The whole genome SNP discovery study in turkeyresulted in the detection of 5.49 million putative SNPs compared to the reference genome. All commercial linesappear to share a common origin. Presence of different alleles/haplotypes in the SM population highlights thatspecific haplotypes have been selected in the modern domesticated turkey.BackgroundAll commercial turkey lines descend from the SouthMexican turkey (Meleagris gallopavo gallopavo) indigenous to Mexico, first domesticated in 800 BC [1]. In theUS, the turkey is registered as a single breed with eightdifferent varieties as defined primarily by plumage colour.Five of these eight varieties (Bronze, Narragansett, WhiteHolland, Black and Slate) were registered in 1874, while* Correspondence: muhammadl.aslam@wur.nl1Animal Breeding and Genomics Centre, Wageningen University, De Elst 1,6708WD, Wageningen, The NetherlandsFull list of author information is available at the end of the articlethe remaining three (Beltsville Small White, Bourbon Red,and Royal Palm) were registered in 1951, 1909, and 1971respectively. There are a total of five wild turkey subspecies in North America but none of them contributed tothe development of modern commercial lines [1].Turkey is the second largest contributor of poultrymeat consumed worldwide [2]. The production per birddoubled between 1970 and 2008 [2], largely due to selection pressure by the primary breeders for specific economically important traits, such as body weight, meatquality, and egg production [3-6]. Historically, quantitative genetics-based selection has been the primary 2012 Aslam et al.; licensee BioMed Central Ltd. This is an Open Access article distributed under the terms of the CreativeCommons Attribution License (http://creativecommons.org/licenses/by/2.0), which permits unrestricted use, distribution, andreproduction in any medium, provided the original work is properly cited.
Aslam et al. BMC Genomics 2012, 1strategy of genetic improvement of livestock [7]. Thisgenetic improvement was largely applied to highly heritable traits, such as body size and breast muscle development. Genetic improvement of farm animals throughselection may have increased production but has alsoresulted in a loss of genetic diversity [8]. The efficiencyof these classical methods used for genetic improvementdecreases when applied to traits that are difficult tomeasure or have lower heritability [7]. The availability ofgenome-based selection, based on a large number ofSNPs at a density equivalent to the resolution of linkagedisequilibrium (LD), has the potential to transformbreeding and incorporate previously unavailable geneticinformation into commercial lines [9] which can beexpected to change the impact of commercial breedingon diversity. A tremendous loss of SNP genetic diversityhas been observed in chicken with significant absence ofrare alleles (50% or more) in commercial breeds compared to ancestral breeds [10].SNPs are a good marker type to study diversity. SNPsrepresent the most abundant source of genetic variationwithin the genome and are linked to heritable differencesbetween individuals [11]. In addition, SNPs have a lowmutation rate and are thought to be good genetic markersof potential disease phenotypes as well as for other complex traits [12]. Moreover, SNP markers are amenable tohigh throughput genotyping platforms and are valuablefor a variety of genetic and genomic applications such asthe construction of genetic and physical maps and theanalysis of genetic diversity [13]. Next generation sequencing (NGS) has proven to be very effective for the largescale, genome-wide discovery of this type of genetic variation [14,15]. When a high quality reference genome sequence is available, genomic sequences of individuals canbe aligned more easily to this reference genome to detectnucleotide variation[15,16]. Different studies have appliedNGS platforms to achieve highly redundant coverage ofthe genome, a prerequisite for high quality genome-wideSNP discovery in the complex genomes of plants and animals [17-20].Turkey genome assembly is based on commercial turkey, containing 39 autosomes and 2 sex chromosomes[21]. The most recent build, UMD 2.01, covers 90% ofthe genome [22] The size of the turkey genome assemblyis 1.1 billion bases and, to date, about 600,000 SNPs[15,21] have been identified within the reference genomeassembly. Increasing the number of SNPs identified inthe turkey is an essential step for future improvement ofeconomically important traits through genetic association studies [23-25].Domestication of livestock species and a long historyof migrations, selection and adaptation has created anenormous variety in breeds in livestock [8]. Phenotypicselection has created a wide diversity of breeds that arePage 2 of 14adopted to different climatic conditions and purposes[26]. Phenotypic variation observed between and amongbreeds of domestic animals is overwhelming comparedwith that in natural populations [26]. Chicken is considered the most closely related domesticated agriculturalspecies to turkey. The observed phenotypic diversity inchicken is much larger than that of turkey, [26,27] mostlikely reflecting a much larger effective population sizeof chicken, before specialized commercial populationswere established during the twentieth century. This isconsistent with the extensive sequence diversity presentin domestic chicken (5 SNPs/Kb) [28,29].The presence of genetic diversity in domestic livestockspecies is of great importance for sustained genetic improvement of selected breeds in various environments, aswell as to facilitate rapid adaptation to potential changesin breeding goals [30,31]. In animal breeding, crosses withnon-commercial populations are rarely applied and genetically improved animals are often kept in small, closedpopulations. Small effective population sizes and epistasiscan result in loss of genetic diversity, which can lead toreduced individual fitness and reduced response to selection [32,33]. Several studies have assessed genetic diversityin different livestock species [32,34-40] using differenttypes of markers. A number of genetic diversity studies inchicken have reported loss of genetic diversity in commercial chicken populations because of high selection pressure and low effective population size [35,37,41]. A fewstudies have been published that explored genetic diversityin turkey genetic resources. However, these studies used alimited number of molecular markers [42,43] and onlyone study has been published that used 9 SNPs along withother molecular markers [44].The goal of this project was to investigate turkey genome variation and to provide a resource for subsequentgenomic work in the turkey and to cover a wide sampling of population for the development of a highdensity SNP chip with minimal ascertainment bias. TheSNP information will enable or improve application ofgenomic selection as well as association studies. Wehave used the identified SNPs to estimate relatednessamong the sequenced turkey populations, which will uncover the genetic diversity available to breeders. Information of genetic diversity can be used in the design ofbreeding programs including making decisions oncrosses between lines or introgression of genes fromother commercial lines that may affect economically important traits such as growth, meat quality, fitness, andsurvival traits.MethodsPopulationsEleven turkey populations were available for this study.Males from seven commercial lines, three heritage
Aslam et al. BMC Genomics 2012, 1varieties and 113 years old samples of wild turkeys fromSouth Mexico (SM turkeys) were used for whole genomesequencing. The seven commercial lines, L1 through L7,were obtained from two different primary breeding companies. The three heritage varieties were the BeltsvilleSmall White (BvSW), the Royal Palm (RP) and theNarragansett (Nset) [45-47]. Tissue samples representing the wild population were obtained from the BirdCollection of the Smithsonian Institution’s NationalMuseum of Natural History (USNM 165490, USNM166330, and USNM 166329), and were originally collected in 1899 from Chihuahua, Mexico. These samplesrepresent the progenitor subspecies, the South Mexican(SM) turkey. In total 32 individuals were selected forwhole genome re-sequencing, with three males perpopulation except for RP, which was represented by 2males.Genomic DNA extraction, library preparation andsequencingConsidering mature erythrocytes in poultry arenucleated, genomic DNA was extracted from wholeblood of the commercial and heritage lines with theQIAamp DNA blood Midi Kit (Qiagen, Valencia, CA);the procedure included a proteinase K digestion followed by column purification. Integrity of high molecular weight DNA following the extraction was confirmedby agarose gel analysis. Genomic DNA was shearedusing the Covaris S2 to yield an average fragment size of450 bp, as determined with the Agilent Bioanalyzer 2100(Agilent, Santa Clara, CA). The DNA from the three historic SM samples was extracted from the toe-pads in theancient DNA laboratory at the Smithsonian Institution’sCenter for Conservation and Evolutionary Genetics, thatis fully equipped to avoid contamination with modernDNA. DNA extraction followed a standard protocol ofproteinase k and DTT digestion followed by phenolchloroform extraction and centrifugal dialysis with Centricon concentrators (following methods provided in[48]). An extraction blank sample was used as a nosample control in each round of extraction. Extractionsinvolved alternation of turkey samples with samplesfrom other avian or non-avian taxa, in order to detectpotential cross-contamination among extracts. Extractsof the samples and extract controls were subjected toPCR with standard avian mtDNA primer sets (Cytochrome b, ND2; [49]) followed by sequencing of positiveproducts to confirm the isolation of turkey DNA fromthe toe pads. The genomic DNA of the SM samples ranged from 40-43 bp (Agilent Bioanalyzer).Genomic libraries were prepared with the Paired-endSequencing Sample Preparation Kit (Illumina, SanDiego, CA) with 5 μg of genomic DNA for commercialand heritage lines according to the manufacturer’sPage 3 of 14instructions; for the SM samples 0.54 μg was used toconstruct the libraries. All genomic DNA libraries werevalidated with the Agilent Bioanalyzer (model 2100).The automated cBot Cluster Generation System (Illumina) was used to generate clusters on the flow cell.Each individual was sequenced (paired-end; read length120 bp) in a single lane of a flow cell using the IlluminaGAIIx. The DNA extracted from museum samples forthe SM turkeys was highly degraded, and thus singleend reads of 40 bp were generated from these samples.Sequence mapping and SNP identificationSequence reads of each individual from the domesticatedpopulations (heritage varieties and commercial lines)were filtered on base quality; reads were trimmed ifthree consecutive bases had an average Phred-like quality score of less than 13. Both sequences in a pair neededto exceed 40 bp in length after trimming to be retainedfor analyses. Sequence reads from the individuals of theSM population were not quality-trimmed before furtheranalyses since they were sequenced to a length of 40 bponly. Sequence reads were aligned against the turkeyreference genome (UMD 2.01) using the MOSAIKaligner [50]. Mapping of reads from each individual tothe reference genome sequence was performed withhash size 15 (hs), 100 maximum hash positions (mhp),an alignment candidate threshold (act) of 20, and a maximum mismatch percentage (mmp) of 5. Banded SmithWaterman algorithm (bw 41) was used to increase thespeed of alignments. The algorithm implemented inMOSAIK calculates a mapping quality for each sequenceand measures the probability that a sequence belongs toa specific target. The alignments were sorted usingMosaikSort. Finally, the file was converted to BAMformat using MosaikText. All BAM files have beenuploaded to NCBI's Sequence Read Archive (SRA) database under the study accession number “SRP012021.2”.The mpileup function of SamTools version 0.1.12a[51] was used to call variants, separately for each turkey population. The view option of bcftools [51] wasused to call the genotype at each variant for each animal. Genotypes were called for each animal with aminimum genotype quality of 20, and a read depth between 1 and 25. At least one individual in a populationneeded to have a genotype call that met these criteriaat a particular position. A SNP that passed the abovementioned criteria were considered as a putative SNP.Putative SNPs were categorized into fixed differencescompared to the reference genome and segregatingSNPs. Homozygous non-reference genotypes that werethe same in all individuals of a population were considered fixed SNPs, while the SNPs that had variable/heterozygous genotypes in a population were consideredsegregating SNPs.
Aslam et al. BMC Genomics 2012, 1To estimate heterozygosity (heterozygous SNPs/kb),mpileup genotyping analysis (described above) was usedand the number of heterozygous SNPs was calculated atthe reference bases covered from 5 to 10 fold. For eachindividual in a population, heterozygosity was estimatedby dividing the total number of discovered heterozygousSNPs by the total genome sequence covered from 5 to10 fold. Population heterozygosity was estimated byaveraging the heterozygosity of all individuals within apopulation.Functional annotation of SNPsThe gene-based analysis of ANNOVAR software [52] wasused to functionally annotate the putative SNPs. For eachputative SNP, the location (exonic, intronic, intergenic,5’UTR, 3’UTR, splice acceptor or donor site, downstreamor upstream) and the functional annotation (nonsynonymous, synonymous, stop codon gain or loss, and aminoacid changes) were determined based on the turkey reference genome (UMD 2.01). Gene annotations used in thisanalysis were taken from Ensembl [53]. Standard settingsfor gene based analysis of ANNOVAR were used.Nucleotide diversity and false discovery rateGenome wide mapping density, or read depth distribution, and the nucleotide diversity across the whole genome were assessed for each individual of the 11 turkeypopulations. Read depth distribution was used to calculate average sequence coverage across the whole genome. To get genotypes of each individual withoutimputation, pileup function of SamTools version 0.1.12a[51] was used for the estimation of nucleotide diversityacross the whole genome. Genotypes were called foreach individual using minimum genotype quality of 20,and a read depth between 3 and 15. The number of heterozygous and homozygous non-reference SNP calls wasestimated compared to the reference genome within a300 Kb window. In order to estimate SNP false discoveryrate (FDR), 30 large genomic regions of variable sizes(ranging from 2.7-10.5 Mb on variable positions at chromosomes 1, 3 and 10) were investigated where one individual from each of the 10 domesticated populationswas clearly homozygous for a single haplotype. Homozygous regions were identified by visual inspection of thenucleotide diversity plots for turkey chromosome 1, 3and 10. Any SNP within these regions were consideredto be false positives. The false discovery rate was calculated as the total number of heterozygous SNP positionsdivided by the total number of bases covered (1–25 foldcoverage) in these 30 regions.Genetic diversity analysisPHYLIP software, version 3.69 [54] was used to calculatepairwise Nei’s genetic distance [55] among all thePage 4 of 14individuals from the 11 turkey populations. SNPs forwhich genotypes were called in at least 9 turkey populations (irrespective of whether SNPs were segregating inall these populations) were selected and utilized for thegenetic diversity analysis. Threshold of at least 9 turkeypopulation was selected to increase number of selectedSNPs for analysis and to make sure presence of selectedSNPs in maximum populations to have a reliable geneticcomparison. Pairwise genetic distance analyses werebased on marker data that the individuals had in common, because PHYLIP is unable to deal with missingdata [36]. Mega 5.0 [56] was used for hierarchical clustering using a Neighbour-joining procedure on the genetic distance matrix for all the individuals. The wildpopulation was used to root the phylogenetic tree.Non-reference allelic stateThe genome of each individual was screened, using thenucleotide diversity analysis described above, for the occurrence of non-reference allelic states. Determining theancestral allelic state of SNPs was not possible becausespecies with appropriate evolutionary distance are notavailable. Chicken is considered a closely related domesticated agricultural species to turkey but the evolutionary distance to the last common ancestor of these twospecies is around 30 million years [57]. To quantify regional changes in genomic diversity between SM and thedomesticated populations, we used heterozygosity aswell as the presence of non-reference allelic homozygosity of the positions sufficiently covered by sequencing.The difference in non-reference allele homozygositybetween domesticated and the SM turkey populationswas calculated for each bin. This difference was thendivided by the average homozygous non-reference alleleSNP density for the bin to yield a relative measure thatcan be compared between bins with different levels ofvariation.The ratio of non-reference homozygosity in wild SMvs. domesticated populations was calculated within binsizes of 300 Kb. A high ratio points to non-referencealleles being lost, or decreased in frequency during domestication and selection. A high ratio of non-referencehomozygosity, in combination with low heterozygosityin the domesticated populations, is interpreted as a reduction of allelic variation from wild to domesticatedpopulations, or “fixation of the reference alleles”. A binwas considered “fixed for the reference allelic state” indomesticated populations when two conditions weremet. First, bins were considered “fixed” when heterozygosity was equal or lower than 0.0002 on average acrossall domesticated populations. This threshold was chosenbecause only 5% of the bins had a heterozysity equal orlower than 0.0002 (1 heterozygous position/5000 bp).Second, bins that were considered “fixed” had to have a
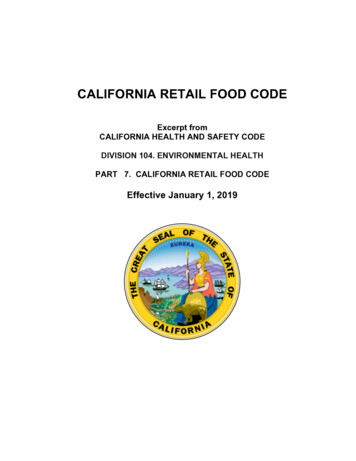
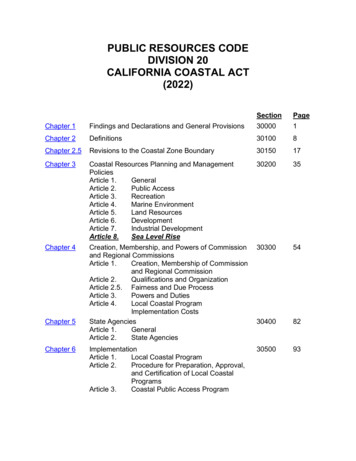
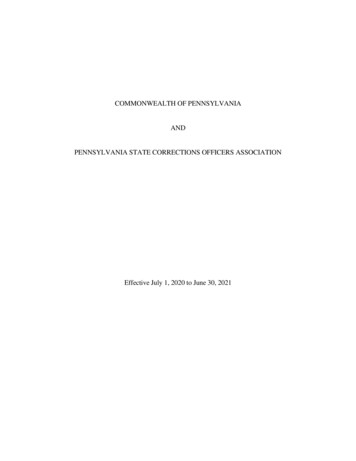
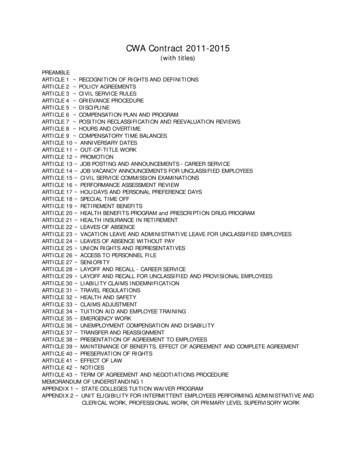
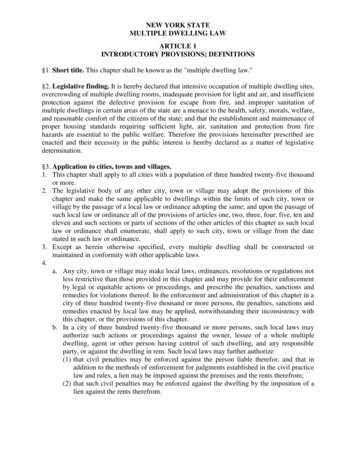
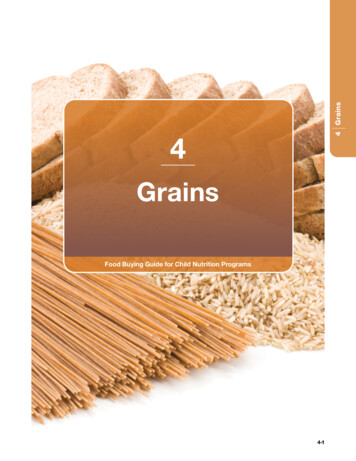
Aslam et al. BMC Genomics 2012, 1ratio of non-reference allele homozygosity above orequal to 1.73, which means that the non-reference allelehomozygosity of the wild population must be at least73% higher than the domesticated populations. Thisthreshold was chosen because only 5% of all the bins inthe genome had a ratio equal or higher than 1.73.Ethical approval for the use of animals in this studyAlthough animals were used in this study, no directexperiments were performed on them. Blood samplecollection was carried out by highly skilled and experienced personnel from the breeding companies. No approval from the ethics committee was necessaryaccording to local legislation.ResultsWhole-genome resequencing and SNPs discoveryThe obtained sequence from the DNA samples of thedomestic populations (heritage varieties and the commercial lines) varied from 2.30-13.21 Gbp (Giga basepairs) per individual. After quality trimming andalignment of the short reads, the percentage of bases inthe reference genome covered by at least 1 and a maximum of 25 reads varied from 47.48% to 86.13% for theanimals analyzed (Table 1). The sequences generatedfrom SM turkeys varied from 0.41-0.82 Gb of sequenceper individual. The sequence depth at bases covered byat least one read ranged from 1.38 to 1.81 for the SMsamples and 2.07 to 6.72 for the domesticated turkeylines (Table 1).In total, 5.49 million putative SNPs were identifiedcompared to the reference genome (Table 2). Of these5.49 million SNPs, 4.76 million SNPs were segregatingin at least one population (Table 2). The number of segregating SNPs for the different turkey populations variedfrom 0.12 to 1.58 million, with the highest number ofsegregating SNPs observed in L3 and the lowest numberobserved in SM (Table 3). The lowest number of fixedSNPs was observed in L3 and the highest number offixed SNPs was observed in BvSW (Table 3). The transition to transversion (Ti/Tv) ratio of the SNPs discoveredis 2.45. Of the total 5.49 million SNPs discovered, 75,254were located in exonic regions, including 23,795 nonsynonymous , 52,506 synonymous, 377 stop gain and 8stop loss variants. The majority of these exonic SNPs,66,795 or 89% were segregating within the populationsanalyzed (Table 4).HeterozygosityThe number of heterozygous genotypes detected withinthe individuals from the ten domesticated populations(heritage varieties and the commercial lines) varied from0.08 to 0.80 million with an average of 0.55 million heterozygous genotypes per individual. Individuals from thePage 5 of 14SM population showed relatively low numbers of heterozygous SNPs; between 0.01 and 0.07 million. Heterozygosity (heterozygous SNPs/kb) of all individuals fromthe different turkey populations ranged from 0.17-2.73while heterozygosity of populations ranged from 0.731.64 (Table 2 & 3). The BvSW population had the lowestheterozygosity, while SM showed the highest heterozygosity within the analyzed populations (Table 3).Observed average nucleotide diversity in the 10 largestchromosomes was 0.0005 segregating SNPs per nucleotide position while average nucleotide diversity in thesmaller chromosomes (20–30) was 0.0007. ChromosomeZ showed the lowest nucleotide diversity with 0.0002segregating SNPs per nucleotide position. Based onobserved homozygous regions (Figure 1), interpreted torepresent two copies of the same Identical By Descent(IBD) haplotype, the estimated average heterozygousgenotype FDR was 0.00002 per nucleotide position inthe reference genome (ranging from 0.000012-0.000023in the different individuals).Genetic diversityThere were 223,264 SNPs segregating in at least 9 turkeypopulations, and these were used to calculate Nei’s pairwise genetic distances. The tree based on Nei’s geneticdistance for the 32 turkey individuals from the 11 different turkey populations presents their genetic relationships (Figure 2). Individuals from a specific turkeypopulation clustered closely together. Inter-populationcomparisons demonstrated that commercial linesformed a cluster that was distinct from heritage lineswith the exception of the L5 line, which exhibited acloser genetic relation to the heritage varieties. Amongthe heritage varieties, RP and Nset were more geneticallyrelated than either to BvSW. Individuals from the SMpopulation also clustered together and showed relativelycloser genetic relation with BvSW population.Non-reference allelic stateSix regions on five different turkey chromosomes (3, 4,9, 14, and 22) showed differences between the SM andthe domesticated populations with respect to the occurrence of no-reference wild type and the reference allelicstates (Figure 3). Domesticated populations predominantly showed the reference allelic state, while the SMpopulations predominantly showed the no-referencewild type allelic state within these regions. These sixregions were then examined with respect to the heterozygous SNP density per nucleotide positions within thesame bin size. Within these six regions, nucleotide diversity for all the domesticated populations was found to beclose to zero, except for one region on chromosome 4that showed high segregation of non-reference alleleswithin the domesticated populations (Figure 4). The
Aslam et al. BMC Genomics 2012, 1Page 6 of 14Table 1 Alignment statistics for the individuals from different turkey populationsIDsSequence coverage (fold)1Assembly coverage (%)2Assembly coverage 1-25X 45.4145.401Average sequence depth of each base in the reference genome that is covered by at least 1 read. The used turkey reference genome (UMD 2.01) has genomesize of 1,061,982,190 bp, which is 90% of the total turkey genome size. 2 Percentage of reference genome that is covered by at least one read. 3 Percentage ofreference genome that is covered by 1–25 reads.other five genomic regions, two regions in chromosome22 and one region in each of the remaining three chromosomes, (3, 9 and 14), met the criteria mentioned inthe methodology section (Additional file 1). These genomic regions were considered fixed for the reference allelic state in the domesticated populations.DiscussionIn this study, we performed whole genome sequencingfor SNPs discovery and used the identified SNPs tocharacterize genetic diversity in the turkey genome. Toavoid imputation of genotype calls across the differentpopulations, mpileup was applied within each populationseparately because the applied method (mpileup) reliesin part on Hardy-Weinberg Equilibrium (HWE) for imputation of genotypes [51].By using a NGS (Illumina GAIIx) approach, we discovered millions of high quality SNPs in the turkey. Nextgeneration sequencing approaches are considered highlyreliable for genome-wide discovery of sequence variation[15], when used to compare different lines/strains to areference genome [58]. The adoption of NGS platforms
Aslam et al. BMC Genomics 2012, 1Page 7 of 14Table 2 Heterozygosity and the number of SNP observed in each individual of different turkey populationsIDsHomozygous NR SNP 1Heterozygous SNPHeterozygous SNP 5-10XGenome covered 5-10X (bp)Heterozygosity omozygous non
SNP discovery in the complex genomes of plants and ani-mals [17-20]. Turkey genome assembly is based on commercial tur-key, containing 39 autosomes and 2 sex chromosomes [21]. The most recent build, UMD 2.01, covers 90% of the genome [22] The size of the turkey genome assembly [15,21] have been identified within the reference genome assembly.