Transcription
Diabetologia (2018) 699-7ARTICLEHuman fetoplacental arterial and venous endothelial cellsare differentially programmed by gestational diabetes mellitus,resulting in cell-specific barrier function changesSilvija Cvitic 1 & Boris Novakovic 2 & Lavinia Gordon 2 & Christine M. Ulz 1 & Magdalena Mühlberger 1 &Francisca I. Diaz-Perez 1 & Jihoon E. Joo 2 & Vendula Svendova 3 & Michael G. Schimek 3 & Slave Trajanoski 4 &Richard Saffery 2 & Gernot Desoye 1 & Ursula Hiden 1Received: 16 January 2018 / Accepted: 26 June 2018 / Published online: 8 August 2018# The Author(s) 2018AbstractAims/hypothesis An adverse intrauterine environment can result in permanent changes in the physiology of the offspring andpredispose to diseases in adulthood. One such exposure, gestational diabetes mellitus (GDM), has been linked to development ofmetabolic disorders and cardiovascular disease in offspring. Epigenetic variation, including DNA methylation, is recognised as aleading mechanism underpinning fetal programming and we hypothesised that this plays a key role in fetoplacental endothelialdysfunction following exposure to GDM. Thus, we conducted a pilot epigenetic study to analyse concordant DNA methylationand gene expression changes in GDM-exposed fetoplacental endothelial cells.Methods Genome-wide methylation analysis of primary fetoplacental arterial endothelial cells (AEC) and venous endothelialcells (VEC) from healthy pregnancies and GDM-complicated pregnancies in parallel with transcriptome analysis identifiedmethylation and expression changes. Most-affected pathways and functions were identified by Ingenuity Pathway Analysisand validated using functional assays.Results Transcriptome and methylation analyses identified variation in gene expression linked to GDM-associated DNA methylation in 408 genes in AEC and 159 genes in VEC, implying a direct functional link. Pathway analysis found that genes alteredby exposure to GDM clustered to functions associated with ‘cell morphology’ and ‘cellular movement’ in healthy AEC and VEC.Further functional analysis demonstrated that GDM-exposed cells had altered actin organisation and barrier function.Conclusions/interpretation Our data indicate that exposure to GDM programs atypical morphology and barrier function infetoplacental endothelial cells by DNA methylation and gene expression change. The effects differ between AEC and VEC,indicating a stringent cell-specific sensitivity to adverse exposures associated with developmental programming in utero.Data availability DNA methylation and gene expression datasets generated and analysed during the current study are available atthe National Center for Biotechnology Information (NCBI) Gene Expression Omnibus (GEO) database (http://www.ncbi.nlm.nih.gov/geo) under accession numbers GSE106099 and GSE103552, respectively.Keywords Actin organisation . DNA methylation . Fetoplacental endothelial cells . Gestational diabetes mellitus . ProgrammingGernot Desoye and Ursula Hiden contributed equally to this work.Electronic supplementary material The online version of this article(https://doi.org/10.1007/s00125-018-4699-7) contains peer-reviewed butunedited supplementary material, which is available to authorised users.* Ursula Hidenursula.hiden@medunigraz.at1Department of Obstetrics and Gynecology, Medical University ofGraz, Auenbruggerplatz 14, 8036 Graz, Austria2Cancer and Disease Epigenetics, Murdoch Children’s ResearchInstitute, Royal Children’s Hospital, Melbourne, VIC, Australia3Institute for Medical Informatics, Statistics and Documentation,Medical University of Graz, Graz, Austria4Center for Medical Research, Medical University of Graz,Graz, Austria
Diabetologia (2018) 61:2398–2411AbbreviationsAECArterial endothelial cellsdAEC AEC from GDM pregnanciesDMR Differentially methylated regiondVEC VEC from GDM pregnanciesEBM Endothelial basal mediumFCFold changeFDRFalse discovery rateGDM Gestational diabetes mellitusPCAPrincipal component analysisVECVenous endothelial cellsIntroductionAdverse insults during intrauterine life can induce long-termchanges in the physiology and metabolism of the offspringand, thus, program future health. This phenomenon is referredto as fetal programming [1, 2]. Epigenetic mechanisms, including DNA methylation, are characterised by a high degreeof plasticity and responsiveness to environmental stimuli [3]and are considered to play a key role in fetal programming.Indeed, altered DNA methylation in response to the environment in utero leads to gene expression changes and consequently affects placental function [4, 5].Gestational diabetes mellitus (GDM) is a pregnancy-relatedglucose intolerance causing maternal and fetal hyperglycaemia[6]. As with other types of diabetes, GDM is a growing problem and affects 15% of pregnancies worldwide [7]. AlthoughGDM resolves after birth, it is associated with long-term adverse consequences for mother and offspring (i.e. an increasedrisk for later diabetes in the mother and development of2399features of the metabolic syndrome, including cardiovasculardisease, in the offspring) [8, 9].Accumulating evidence linking intrauterine exposures tolater risk of cardiovascular disease has raised interest in theprocess of vascular development and its programming by adverse maternal environments, such as GDM. Being directlyexposed to the altered metabolic milieu of GDM, the endothelial compartment of the fetoplacental unit represents an idealtissue for investigating the role of epigenetics due to adverseenvironments in programming cardiovascular/metabolic function [1, 10]. This notion is further supported by the observation that endothelial and vascular dysfunction [11] are amongthe most prominent long-term consequences of diabetes andhyperglycaemia.The vascular system is comprised of two major types ofblood vessels, arterial and venous, which differ in variousphysiological and anatomical factors, reflecting their distinctfunctions. The identity of arterial endothelial cells (AEC) andvenous endothelial cells (VEC) is associated with distinct geneexpression signatures established early in development [12].Epigenetic mechanisms, including DNA methylation, are keyto specifying such differences [13]. We previously demonstrated widespread DNA methylation differences in essential endothelial genes in fetoplacental AEC and VEC [14]. Importantly,the distinct phenotypical characteristics of these cells weremaintained after isolation and during in vitro culture [15].Here we hypothesised that the altered intrauterine environment associated with GDM modifies DNA methylation ofendothelial cells of the fetoplacental unit in a cell-typespecific (AEC vs VEC) manner and aimed to identify therelationship between genome-wide methylation and gene expression in fetoplacental endothelial cells from healthy andGDM-complicated pregnancies. We conducted a pilot study
2400to identify concordant gene methylation and expressionchanges induced by GDM, performed pathway analysis toidentify functions and pathways subject to epigenetic dysregulation by GDM and tested a subset of these using functionalstudies.MethodsSample collection Ethical approval was obtained from theMedical University Graz (25-008ex12/13 and 27-268ex14/15). All women participating in the study provided writteninformed consent. Control placentas were collected from pregnancies of non-smoking (self-reported) women who had a negative 75 g OGTT performed at 25–28 weeks of gestation andwere free from medical disorders or pregnancy complications.GDM was diagnosed according to WHO/IADPSG criteria[16]. The women who had a positive OGTT were either recommended a diet and classified as GDM A1 or were additionally treated with insulin (NovoRapid plus Insulatard; NovoNordisk Pharma, Vienna, Austria) and classified as GDMA2. Control and GDM samples were matched for ethnicityand fetal sex, but not for maternal BMI, since being overweightis major risk factor for GDM. However, neither BMI nor gestational weight gain differed between control and GDMgroups. In addition, the mean and median cell passage of primary cells from control and GDM women was similar. We alsoperformed covariate analysis on multiple factors (gestationalage, cord blood insulin, fetal weight and length, fetal ponderalindex, placental weight, maternal C-reactive protein [CRP],maternal height, maternal weight and BMI before pregnancyand before birth and maternal gestational weight gain) usingBioconductor package limma ml/limma.html) and identified aneffect on a total of 27 CpG sites at 21 genes (electronicsupplementary material [ESM] Table 1), representing only asmall subset of total differentially methylated positions andsuggesting that observed effects are a result of GDM. Weshould note, however, that the sample size is too small forsuch covariate analysis.We used different samples for expression and methylationanalysis. Analysis of RNA and DNA from the same samplewould have resulted in better correlation but analysis of different samples, though matched for clinical variables and passages, gives more robust results. Table 1 shows maternal, neonatal and placental characteristics of expression and methylation analyses.Cell culture Primary AEC and VEC were isolated from thirdtrimester human placentas after healthy and GDMcomplicated pregnancies following a standard protocol [15].Cells were characterised by immunocytochemical analysis[17] and cultured on 1% (vol./vol.) gelatin-coated flasksDiabetologia (2018) 61:2398–2411(75 cm2) using endothelial basal medium (EBM; CambrexClonetics, Baltimore, MD, USA) supplemented with theEGM-MV BulletKit (Cambrex Clonetics). Cell isolationswere used up to passage ten as no phenotypical change oraltered responses of the cells to culture were observed.DNA methylation analysis DNA (1 μg) isolated fromfetoplacental AEC (n 9), VEC (n 9), AEC from GDMpregnancies (dAEC) (n 5) and VEC from GDM pregnancies(dVEC) (n 9), obtained from nine control and nine GDMplacentas in total, was bisulphite converted usingMethylEasy Bisulphite Modification Kit (Human GeneticSignatures, Sydney, NSW, Australia). Conversion efficiencywas assessed by bisulphite-specific PCR (not shown).Hybridisation of bisulphite-treated samples to IlluminaInfinium Human Methylation450 (HM450) BeadChips(Illumina, San Diego, CA, USA) was performed accordingto the manufacturer’s instructions. Based on power calculations for the HM450 array, our sample size would allow us todetect changes of Δβ 0.2 and p value 0.05 [18]. TheBeadChips were scanned using Illumina iScan (Illumina)and raw data were exported as IDAT files. MinfiBioconductor package ml/minfi.html) [19] imported data into R(version R 2.15.1), performed quality control, pre-processingand normalisation using the subset-quantile within array normalisation (SWAN) method [20]. The limma package [21]was used to fit a linear model to compare dAEC and dVECvs control samples, with patient as random effect and allowingfor batch effects. False discovery rate (FDR) was calculatedby the Benjamini–Hochberg method. M values were calculated after removing probes on the sex chromosomes to eliminate potential sex bias and poor-performing probes. β valueswere derived from intensities defined by the ratio of methylated (M) to unmethylated (U) probes given by β M / (U M 100). For details of quality control, outlier identificationand HM450 platform validation using locus-specificSEQUENOM MassARRAY EpiTYPER (Agena Bioscience,San Diego, CA, USA) [22], see ESM Methods and ESM Figs1–3. For information on whether CpGs are located in differentially methylated regions (DMRs), see ESM Table 2 and fora discussion of advantages vs disadvantages of the HM450platform, see ESM Methods. Unadjusted and adjusted pvalues and information on whether CpGs are located at potential SNPs, within topological domains (TADs) published inHUVECs [23] or part of a DMR, are given in the lists ofsignificantly methylated CpGs available on Gene ExpressionOmnibus (GEO) database account GSE106099 (www.ncbi.nlm.nih.gov/geo).RNA isolation Total RNA was isolated with RNeasy mini Kit(Qiagen, Hilden, Germany) and quality was assessed using aBioAnalyzer BA2100 (Agilent, Foster City, CA, USA) with
Diabetologia (2018) 61:2398–2411Table 12401Maternal, neonatal and placental clinical variables for gene expression and DNA methylation analysesVariableMaternal dataNo. of individuals used for cell isolationNo. of cell isolations (AEC/VEC)Age (years)Gestational age (weeks)Height (m)Weight before pregnancy (kg)BMI before pregnancyWeight before birth (kg)BMI before birthGestational weight gain (kg)CRP (nmol/l)HbA1c (mmol/mol)HbA1c (%)OGTT glucose (mmol/l)Fasting1h2hGDM classification (A1/A2)Neonatal dataMale/female ratioOffspring weight (g)Offspring length (cm)Placental weight (g)Fetal ponderal indexFetus/placenta weight ratioCord blood insulin (pmol/l)Cord blood C-peptide (nmol/l)Cell culture dataCell isolation passageGene expressionDNA methylationNormal pregnancyGDM pregnancyNormal pregnancyGDM pregnancy88/834.0 7.339.6 1.51.66 0.0977.3 17.527.7 3.892.8 20.033.3 4.315.5 4.299 871410/1132.8 7.938.9 1.21.66 0.0683.0 16.630.1 5.695.1 18.134.8 5.812.1 9.656 49*99/928.4 6.340.8 1.51.70 0.0475.0 11.625.8 3.190.2 11.530.1 4.915.2 2.792 8899/532.7 6.639.2 1.3*1.70 0.0583.6 18.528.6 7.694.6 17.633.0 6.610.9 10.354 52NDND38.8 2.25.7 0.2NDND37.7 2.35.6 0.24.35 0.446.33 0.965.64 0.635.11 0.42*10.20 1.91*7.05 1.45*9/54.35 0.236.23 1.145.33 0.735.56 0.66*9.32 2.33*6.35 1.54*4/54/43547 42851.0 2.1515 19026.7 2.06.25 1.37NDND6/83275 40950.4 2.0620 18825.5 2.25.72 1.74223 2691.06 0.934/53443 48250.4 2.7619 19526.8 2.65.89 1.44150 177ND4/53318 36550.6 2.7595 15925.9 4.66.02 1.78181 2850.60 0.236.1 1.26.6 1.15.4 1.04.8 0.6Data are presented as means SDThe ethnicity was similar in all groups*p 0.05 by Student’s t test vs respective control groupND, not determinedthe RNA 6000 Nano LabChip Kit (Agilent). Samples with anRNA Integrity Number 8.5 were further used.Microarray gene expression analysis Total RNA from AEC(n 8) and VEC (n 8) isolated from eight placentas fromnormal pregnancies and dAEC (n 11) and dVEC (n 10)isolated from 14 placentas from pregnancies complicated byGDM was labelled using Ambion WT Expression Kit forAffymetrix GeneChip Whole transcript (WT) ExpressionArrays (Life Technologies, Carlsbad, CA). The cRNA washybridised to GeneChip Human 1.0 ST arrays according tothe manufacturer’s instructions (Affymetrix, Santa Clara,CA, USA). Washing and staining (GeneChip HTHybridization, Wash and Stain Kit; Affymetrix) was performed with Affymetrix GeneChip fluidics station 450.Arrays were scanned using Affymetrix GeneChip scannerGCS3000. Labelling and hybridisation controls were evaluated with Affymetrix Expression Console EC 1.1. Data wereanalysed with RMA (robust multi-chip average), includingbackground correction, quantile normalisation, log2 transformation and median polish summarisation using GenomicSuite v6.5 (Partek, St Louis, MO, USA) [24]. Statistical analysis used one-way ANOVA with fetal sex and mother as random factors. The p values were adjusted for multiple testing
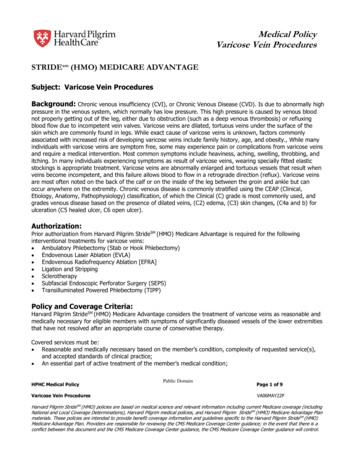
2402using the Benjamini–Hochberg method (R/Bioconductorpackage ‘multtest’; /html/multtest.html) [25, 26].qPCR cDNA was synthesized from 50 ng total RNA of differentcell isolations (n 10 per group) then used for microarray analysis according to protocol (SuperScript II Reverse Transcriptaseprotocol; Invitrogen, Carlsbad, CA, USA). qPCR was performedwith TaqMan gene expression assays (Applied Biosystems,Carlsbad, CA, USA) and ABI Prism 5700 Sequence DetectionSystem (Applied Biosystems, Foster City, CA, USA). The meanhypoxanthine-guanine phosphoribosyltransferase 1 (HPRT1)and ribosomal protein L30 (RPL30) expression was used asinternal control as their expression was unaffected by GDM(not shown). Data were analysed using the 2 ΔΔCt method[27]. Statistical analysis used Student’s t test in SigmaPlot(Systat Software, San Jose, CA, USA).Pathway analysis Gene lists were analysed with IngenuityPathway Analysis (IPA, version 2.3) (Qiagen). Cut-off formethylation differences was p 0.05 and Δβ 0.2 and forgene expression p 0.05 and fold change (FC) 1.5. Wheninvestigating pathways the cut-off was set to Δβ 0.1(methylation) and FC 1.3 (expression) in order to have sufficient genes for the analysis.F-actin immunofluorescence staining AEC (n 5), VEC (n 6), dAEC (n 5) and dVEC (n 5), each in quadruplicates,were seeded in gelatin-coated chamber slides (50,000 cells/well). Participants’ characteristics are provided in ESM Table3. After 24 h, slides were transferred to room temperature,washed with HBSS and fixed with 3.7% (wt./vol.) formaldehyde in PBS for 10 min. After washing with PBS, cells werepermeabilised with 0.1% (vol./vol.) Triton X-100 in PBS for25 min, washed with PBS, blocked with 1% (wt./vol.) BSA inPBS for 25 min and incubated phalloidin-488 FITC (1:20,Thermo Fisher, Eugene, OR, USA) with DL550 (DyLight550 goat-anti mouse, 1:100, Thermo Fisher) for 1 h in thedark. Stained cells were washed with PBS and slides weremounted with Dako fluorescent mounting medium (Dako,Carpinteria, CA, USA) with DAPI (1:2000). After overnightdrying, actin organisation was observed using a Zeiss LSM510 Meta microscope, objective Plan-Apochromat 63 /1.4Oil DIC, at 495 nm and 518 nm excitation wavelength(Zeiss, Oberkochen, Germany) using Zeiss LSM ImageBrowser. F-actin staining was performed and photographedby a blinded observer.Electrical cell-substrate impedance sensing Impedance measurements were performed using an electrical cell-substrate impedance sensing (ECIS) system (Applied Biophysics, Troy,NY, USA) [28]. AEC (n 10) and dAEC (n 6) (80,000Diabetologia (2018) 61:2398–2411cells/well), VEC (n 8) and dVEC (n 4) (110,000 cells/well)were seeded in 400 μl EBM on gelatin-coated gold electrodes(8W10E arrays; Applied Biophysics), in duplicates.Participants’ characteristics are provided in ESM Table 3.VEC are smaller in diameter and were seeded in higher density.Thus, both AEC and VEC reached confluency after 12 h.Impedance was then recorded at 4 kHz for 24 h. Linearmixed-effect model using R package nlme (https://CRAN.Rproject.org/package nlme) was fitted for AEC and VECseparately. GDM, time and the interaction between them wereused as fixed effects. Time was also used as random effect.ResultsGDM alters the DNA methylation profile of fetoplacental AECand VEC To analyse changes in DNA methylation profile associated with exposure of fetoplacental AEC and VEC toGDM in utero (dAEC and dVEC), we measured the methylation of 450,000 CpG sites. Principal component analysis(PCA) of the entire methylation dataset demonstrated cell type(AEC vs VEC) as a main source of variation but also showedclear separation according to GDM status (Fig. 1a).Hierarchical clustering identified cell type as the greatest contributor to methylation variation (ESM Fig. 1) while high correlation between technical replicates indicated low inter-arrayvariability (ESM Fig. 2).Linear regression indicated that exposure to GDM influenced methylation levels (p 0.05 and Δβ 0.2) at 2617CpGs that annotated to 2063 genes in dAEC and 1568CpGs that annotated to 1360 genes in dVEC (Fig. 1b). Thelists of differentially methylated CpGs are deposited as Excelfiles at GEO database, accession number GSE106099. Notsurprisingly given the sample size, these sites did not remainsignificant following FDR adjustment for multiple testing applied to control for false discoveries. Of the total differentialmethylation associated with GDM, 351 genes and 51 CpGswere common to both cell types. In contrast to dVEC, wherevariation was equally distributed between hyper- and hypomethylation, dAEC showed hypermethylation at only 33% ofsites while 67% were hypomethylated (Fig. 1b). This was alsoreflected by a marginal decrease of overall DNA methylation(average methylation levels detected across all probes) withGDM, particularly in AEC, as illustrated by kernel densityplot and methylation index (ESM Fig. 4a, b). The box plotsand heat maps shown in ESM Fig. 5 illustrate global and genespecific methylation differences in GDM-exposed cells inmore detail.Great distance analysis showed that most of the GDMassociated variation in CpG methylation occurs in the proximal region upstream of genes ( 5 to 0 kb from the transcriptional start) (Fig. 1e, f) in both cell types. In contrast to this,
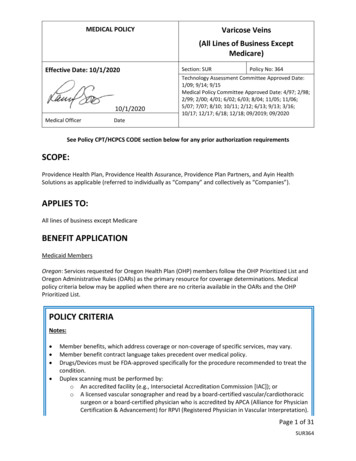
Diabetologia (2018) 61:2398–24112403Fig. 1 (a, c) PCA plot of DNA methylation (a) and gene expression (c)arrays. The first (PC1) and second principal components (PC2) are shownon the x- and y-axis, respectively. (b, d) Number of differentially methylated CpGs (b) and number of associated genes (d) in fetoplacental AECand VEC exposed to GDM (dAEC and dVEC, respectively) vs controlcells using a cut-off of p 0.05, Δβ 0.2 for methylation and p 0.05,FC 1.5 for gene expression. In (b), the grey section of the bars indicatesthe number of hypermethylated CpGs, the white section of the bars indicates the number of hypomethylated CpGs and the black bars indicate thenumber of associated genes. In (d), the grey section of the bars indicatesthe number of upregulated genes and the white section of the bars indicates the number of downregulated genes. (e–g) Great distance analysisof altered CpG methylation relative to transcription start site (TSS).Associations for gene regions are shown for differentially methylated(hyper- and hypomethylated) CpGs in dAEC vs AEC (e) and dVEC vsVEC (f) (p 0.05, Δβ 0.2) and for differentially methylated CpGs between AEC and VEC (g) (p 0.05, Δβ 0.4). The absolute number ofassociated genes is indicated above each barcell-type-specific methylation (AEC vs VEC) is enricheddownstream of the transcription start site (0 to 50 kb; Fig. 1g).Locus-specific DNA methylation profiling of selectedgenes significantly correlated with genome-wide measurements (r2 0.83 for arterial and r2 0.74 for venous group)and thus validated the HM450 DNA methylation platform(ESM Fig. 3).molecular functions ‘cellular function and maintenance’ and‘cell morphology’ were predominantly altered. Unique andcell-specific affected functions with a high number of targetgenes were ‘cellular development’ in dAEC and ‘moleculartransport’ in dVEC (Table 2).Pathways and functions of genes associated with alteredmethylation pattern in GDM Functional analysis of differentially methylated genes in dAEC and dVEC revealed that theGDM alters gene expression profile of fetoplacental AEC andVEC PCA of the global transcriptome levels assessed at 30,000 transcripts in AEC and VEC clearly separated groupsaccording to both cell type and GDM status (Fig. 1c).Unsupervised hierarchical clustering also discriminated AEC
2404Table 2 Top five significantlyenriched molecular functions inIngenuity Pathway Analysis fordifferentially methylated and topfive for the differentiallyexpressed genes in GDM-exposed AEC and VECDiabetologia (2018) 61:2398–2411Molecular functionp valueScoreaDNA methylationAECCellular function and maintenanceCellular assembly and organisationbPost-translational modification6.94 10 6 to 3.87 10 22.86 10 5 to 3.87 10 21.54 10 4 to 3.77 10 2176114262.39 10 4 to 4.01 10 22.39 10 4 to 4.40 10 2921478.24 10 4 to 4.91 10 28.24 10 4 to 4.91 10 29.34 10 4 to 4.58 10 29.34 10 4 to 4.94 10 29.34 10 4 to 2.89 10 253514548148.42 10 22 to 1.26 10 28.42 10 22 to 1.11 10 28.42 10 22 to 1.11 10 22.54 10 8 to 1.11 10 21.03 10 6 to 1.15 10 2159106159892341.75 10 6 to 1.83 10 24.96 10 5 to 1.36 10 248257.46 10 5 to 1.67 10 27.46 10 5 to 1.67 10 27.46 10 5 to 1.74 10 2463824Cell morphologybCellular developmentVECCellular function and maintenanceMolecular transportCell morphologybCell-to-cell signalling and interactionCellular compromiseGene expressionAECCell cycleCellular assembly and organisationbDNA replication, recombination and repairCellular movementbCellular growth and proliferationVECCell cycleCell death and survivalCellular assembly and organisationbCellular function and maintenanceDNA replication, recombination and repairGenes significantly differentially methylated (p 0.05; Δβ 0.2) or significantly differentially expressed (p 0.05; FC 1.5) after GDM exposure in AEC and VEC, respectively, were enriched using Ingenuity PathwayAnalysis. Molecular functions are comprised of multiple subcategories to which genes are assigned with differentsignificance yielding a p value range (Fisher’s exact test)aScore represents the number of affected genes assigned to a specific molecular functionbMolecular functions related to cell morphology and actin organisationfrom VEC, again highlighting the greatest influence of celltype. Furthermore, dAEC vs control AEC clustered, whilethere was no clear separation in the venous group (ESMFig. 6). Analysis of genes significantly influenced byGDM (p 0.05) with a 1.5-fold expression change, identified 812 genes in dAEC, with 36% being upregulated and64% downregulated (Fig. 1d). In dVEC only 211 genes hadchanged expression, with 57% being upregulated and 43%downregulated (Fig. 1d). Interestingly, only 92 genes werecommonly affected by GDM in both cell types. A list of thetop 100 differentially expressed genes in dAEC and dVECvs controls is available at the GEO database, accessionnumber GSE103552. A subset of differentially expressedgenes identified by microarray was validated by qPCR,confirming differential expression of six out of nine genes(ESM Table 4).Pathways and functions of differentially expressed genes inGDM Molecular functions enriched with the differentiallyexpressed genes in GDM were ‘cell cycle’, ‘cellular assemblyand organisation’ and ‘DNA replication, recombination andrepair’ in both AEC and VEC (Table 2), indicating a strongcommon effect of diabetes.Concordant DNA methylation and expression changes infetoplacental AEC and VEC To investigate the relationship between DNA methylation and gene expression, methylationand gene expression datasets were combined. For each CpG,differences in β values between control cells and GDMexposed cells (Δβ) were calculated and compared with corresponding gene expression differences. Setting the cut-off inthe significant methylation difference to 10% (Δβ 0.1) andin the gene expression to FC 1.3, concordant changes in
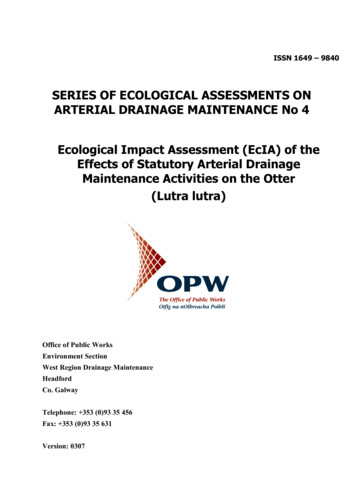
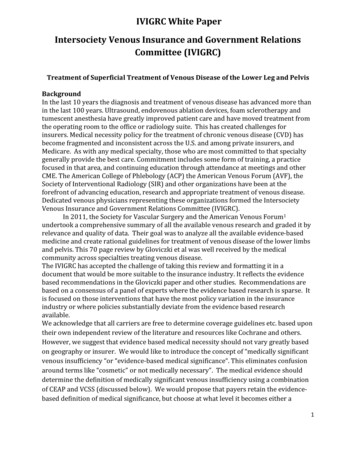
Diabetologia (2018) 61:2398–24112405Fig. 2 Relationship between DNA methylation and gene expressionchanges associated with GDM in fetoplacental AEC and VEC.Scatterplot of DNA methylation (x-axis) and gene expression (y-axis)for HM450 probes with differences between control and GDM-exposedAEC (a) and VEC (b). Cut-offs are set to 10% (Δβ 0.1) methylationdifference and to FC 1.3 in the gene expression. Points in red indicategenes likely to be under epigenetic regulation by DNA methylation, withincreased methylation associated with decreased gene expression andvice versa. The tables below the scatterplots indicate the respective direction of methylation and gene expression changes as well as the number ofaffected CpGs and genesDNA methylation and gene expression (hypermethylated –downregulated and hypomethylated – upregulated) were detected. In dAEC, 118 genes were hypermethylated and downregulated, while 290 genes were hypomethylated and upregulated (Fig. 2a). In dVEC, 42 genes were hypermethylatedand downregulated, while 117 genes were hypomethylatedand upregulated (Fig. 2b). Of all genes showing concordantmethylation and expression change in GDM, only six werealtered in dAEC and dVEC (Table 3).Genes with concordant DNA methylation and gene expression change clustered to molecular functions involvingactin reorganisation processes (‘cell morphology’ and ‘cellular movement’) in both dAEC and dVEC, with the largestnumber of affected molecules in ‘cell morphology’.‘Carbohydrate metabolism’, ‘cell cycle’ and ‘cell-to-cellsignalling and interaction’ were also listed as molecularfunctions significantly influenced by GDM in both celltypes (Table 4).Table 3 Genes commonly regulated by GDM in AEC and VECGenesymbolGene nameEGFREpidermal growth factor receptorConcordant in AEC and VECγ-Aminobutyric acid (GABA) B receptor, 1Upregulated in AEC and downregulated in VECConcordant in AEC and VECGABBR1Direction of expression and methylation changeUpregulated in AEC and VECLMF1Lipase maturation factor 1Concordant in VECNCKAP5NCK-associated protein 5Upregulated in AEC and VECConcordant in AEC and VECSKILSKI-like oncogeneUpregulated in AEC and VECConcordant in VECSULF2Sulfatase 2Upregulated in AEC and VECConcordant in VECUpregulated in AEC and VECThe table shows genes significantly differentially methylated (p 0.05; Δβ 0.1) and expressed (p 0.05; FC 1.3) after GDM exposure in both AEC and VEC. Overlap was performed after integration of DNA methylationand gene expression data
2406Diabetologia (2018) 61:2398–2411Table 4 Top five significantly enriched molecular functions in Ingenuity Pathway Analysis for genes whose expression is potentially regulated byDNA methylation by GDM in AEC and Hypermethylated/downregulatedMolecular functionp valueScoreaCell morphologybCellular movementbCell-to-cell signalling and interaction5.79 10 7 to 1.63 10 22.54 10 5 to 1.56 10 25.75 10 5 to 1.63 10 2403528Carbohydrate metabolismCellular developmentCell-to-cell signalling and interactionCellular compromiseMolecular transport
Suite v6.5 (Partek, St Louis, MO, USA) [24]. Statistical anal-ysis used one-way ANOVAwith fetal sex and mother as ran-dom factors. The p values were adjusted for multiple testing Table 1 Maternal, neonatal and placental clinical variables for gene expression and DNA methylation analyses Variable Gene expression DNA methylation